Abstract
Intracardiac echocardiography (ICE) has been demonstrated to be an effective imaging modality for the guidance of several cardiac procedures, including radiofrequency ablation (RFA). However, assessing lesion size during the ablation with conventional ultrasound has been limited, as the associated changes within the B-mode images often are subtle. Acoustic radiation force impulse (ARFI) imaging is a promising modality to monitor RFAs as it is capable of visualizing variations in local stiffnesses within the myocardium. We demonstrate ARFI imaging with an intracardiac probe that creates higher quality images of the developing lesion.
We evaluated the performance of an ICE probe with ARFI imaging in monitoring RFAs. The intracardiac probe was used to create high contrast, high resolution ARFI images of a tissue-mimicking phantom containing stiffer spherical inclusions. The probe also was used to examine an excised segment of an ovine right ventricle with a RFA-created surface lesion. Although the lesion was not visible in conventional B-mode images, the ARFI images were able to show the boundaries between the lesion and the surrounding tissue.
ARFI imaging with an intracardiac probe then was used to monitor cardiac ablations in vivo. RFAs were performed within the right atrium of an ovine heart, and B-mode and ARFI imaging with the intracardiac probe was used to monitor the developing lesions. Although there was little indication of a developing lesion within the B-mode images, the corresponding ARFI images displayed regions around the ablation site that displaced less.
I. Introduction
Intracardiac echocardiography (ICE) is capable of forming high quality ultrasound images of the heart from multiple angles [1]–[3]. Previous studies have evaluated the utility and advantages of intracardiac probes in cardiac imaging over transesophageal echocardiography [4]–[9] and fluoroscopic imaging [3], [10], [11]. In addition, several groups have demonstrated the effectiveness of intracardiac probes in the guidance of cardiac interventional procedures including: atrial septal defect closure [5], stent implantation [12], and mitral valvuloplasty [8].
Intracardiac transducers have been used effectively in the guidance for radiofrequency ablations (RFA) procedures [7], [13]–[15]. In these procedures, the imaging probe is used to guide the placement of the RFA catheters and to determine the quality of the contact between the ablation catheter tip and the target myocardium. Radiofrequency ablation has become the standard for treatment of a wide range of cardiac arrhythmias, including atrial fibrillation [16], atrial flutter [17], atrioventricular nodal reentrant tachycardia [18], and Wolff-Parkinson-White syndrome [19].
Currently, ultrasound imaging is used primarily for initial guidance of RFAs but not to image the lesion formed during the ablation. Although visible changes that indicate the creation of a lesion are present within conventional B-mode images [20], correlation of these changes to lesion size and development can be inconsistent [21]–[23]. The discrepancy between the changes observed within the B-mode images and the actual lesion size occurs because tissue damage from RFA does not necessarily result in detectable or repeatable changes in attenuation, echogenicity, or acoustic impedance [24], [25]. As a result, conventional B-mode imaging alone cannot be used to assess the lesions’ locations and sizes. The local electrocardiogram (ECG) acquired from electrodes on the ablation catheter tip can be used to determine when the targeted regions have become electrically inactive. However, ablation guidance based on the ECG has encountered varied success as it can result in inconsistent lesion formation [26]–[28], thus introducing the possibility of recurrent arrhythmias [18].
Another method to assess lesion size is to monitor the changing mechanical properties around the ablation site. As the ablation lesion develops, it becomes stiffer than the surrounding tissue [29]. Elastographic approaches have been used to visualize in vivo ablation lesions within liver [30]–[32]. Early investigations into myocardial elastography have produced cardiac elasticity images at various points of the cardiac cycle [33], [34] and demonstrated it as a promising method to diagnose ischemia and infarction. However, for radiofrequency ablations, tissue anisotropy and nonuniform cardiac deformation make determining exact lesion size within the myocardium problematic.
Acoustic radiation force impulse (ARFI) imaging is a method of elasticity imaging that measures tissue responses from long acoustic pulses that impart local displacements in soft tissue [35], [36]. As ARFI imaging measures displacements caused by an excitation external to physiologic cardiac motion, it is less affected by the nonuniform deformation of the heart. We previously demonstrated ARFI imaging, implemented in an exposed heart preparation with a large array, to be capable of producing high contrast elasticity images that visualize RFA-created lesions within myocardial tissue [37]. The quality of these ARFI images depends on depositing enough energy from the radiation force pulse into the regions of interest to displace the tissue above the noise floor, typically 0.1–0.2 µm.
Radiation force results from the momentum transfer of an acoustic pulse to the medium through which it propagates. Under plane wave assumptions, the body force (F) from an acoustic wave is [38], [39]:
| (1) |
where Iav is the temporal average intensity at that given point; c is the speed of sound; and α is the material attenuation coefficient. A single radiation-force pulse generates measurable displacements along the entire path between the transducer and the focus. As the propagating acoustic wave continues to attenuate and diverge beyond the focus, tissue displacements in this region are typically small.
Clinical studies have explored the use of ARFI imaging to visualize stiffer lesions within breast masses [40], [41] and plaques within peripheral arteries [42]. ARFI imaging recently was demonstrated at depths beyond 8 cm in abdominal applications, including monitoring radiofrequency ablations in the liver [43], [44]. Transthoracic approaches to cardiac ARFI imaging have been limited due to the depth and relative inaccessibility of the heart. Accordingly, using an intracardiac probe for ARFI imaging of the heart would likely be a more suitable method. In this paper, we explore the feasibility of ARFI imaging with an intracardiac probe and its possible application for monitoring cardiac ablations.
II. Imaging Methods
For these experiments, the Siemens SONOLINE Antares™ ultrasound scanner was used with the AcuNav™(Siemens, Issaquah, WA), intracardiac probe. The 10 French, 64 element, 7 mm aperture diagnostic ultrasound catheter was used with custom transducer/system interfaces and beam sequences to create conventional B-mode and ARFI images. Traditional B-mode images were formed with a 90 degree field of view at a line density of 2.66 lines per degree. ARFI images were acquired across a 37 degree field of view and a line density of 0.89 lines per degree. As it is difficult to superimpose and compare images with differing line densities, the ARFI images were first upsampled to the B-mode line density prior to scan-conversion.
All B-mode images and ARFI sequences were acquired with a center frequency of 7.27 MHz and a pulse repetition frequency of 16.2 kHz. The ARFI sequence consisted of one reference line, one radiation force pulse, and several consecutive tracking lines. The first line was recorded to establish the initial tissue position and was used as a reference in correlating subsequent displacements. The pushing beam then was fired along that same line and induced small tissue displacements. Radiation-force pulse amplitudes and frequencies are similar to those used in color Doppler imaging, but pulse lengths (55 µs) are longer. Displacements were estimated by recording echoes from 40 consecutive tracking lines and cross correlating them with the echoes from the initial reference line. The entire sequence then was electronically steered across the field of view to form a complete two-dimensional (2-D) image. A more detailed description of the ARFI acquisition process is described by Nightingale et al. [45].
Radial displacements were estimated using normalized cross correlation with a 0.16-mm kernel. A linear motion filter was applied to remove any bulk radial motion within the ARFI images. Prior to scan conversion, the images were spatially median filtered with a 0.17 mm × 3.37° kernel. Single frame ARFI images were formed by displaying the filtered displacements at a specified time after generation of the radiation force pulse.
III. Experimental Procedure
A. Performance Evaluation for ARFI Imaging
We first determined if an intracardiac probe would be capable of making quality ARFI images. We previously realized ARFI imaging with handheld linear/curvilinear arrays, at which the pushing beams are electronically translated across the transmitting aperture. By contrast, ICE arrays are typically phased-array probes with a limited number of very small elements and low acoustic intensity.
Four ARFI images spanning a 70° field of view were acquired at 10 different locations within the homogeneous regions of a Computerized Image Registration Systems, Inc. (Norfolk, VA) phantom. The phantom consisted of material with an elastic modulus of 4 kPa and an attenuation coefficient of 0.7 dB/cm/MHz. With the probe placed directly in contact with the phantom, ARFI images were acquired with a 1.0-cm focus and a 7.27-MHz transmit frequency. The average maximum displacements around the focus were measured and normalized to produce a relative maximum displacement plot at various steering angles. These results then were used to determine suitable field of view limits within the ARFI images.
The imaging methods above were used to measure transducer face heating for ARFI acquisitions [46]. An Omega Engineering (Stamford, CT) 36 gauge, type T thermocouple was secured onto the transducer such that the tip of the thermocouple was in contact with the center of the transducer face and covered with ultrasonic transmission gel. ARFI sequences then were run approximately once every 6 seconds (0.167 Hz) while temperature measurements were taken at 5 kHz with a SuperLogics (Walham, MA), 16-bit data acquisition card. The scanner formed conventional B-mode images between ARFI sequences, except for a brief period (approximately 500 ms) before each ARFI acquisition when no pulses were fired.
To assess image signal-to-noise ratio (SNR) and depth of penetration, we imaged a homogeneous phantom resting within a mineral oil bath. The probe was placed 0.5 cm above the surface of the phantom and secured with a ring stand such that the transducer face was completely submerged and suspended within the mineral oil bath. An ARFI sequence was acquired with a radiation-force pulse of zero pressure amplitude. Because there was no excitation pulse amplitude, the resulting images should show stationary targets, and any measured displacements were used to assess jitter levels and potential artifacts within an ARFI image.
B. Transducer Motion During ARFI Acquisitions
Our initial trials yielded evidence of transducer motion generated by the pushing pulses used in ARFI imaging. With the generation of a radiation force pulse, acoustic waves are also transmitted into the transducer which are then absorbed by the backing material. Therefore, through the same principles of (1), a body force also is applied to the transducer backing, potentially causing the transducer to move away from the imaged medium. This motion has not been observed in the larger, hand-held probes used in previous ARFI studies. However, as ICE arrays are smaller and mounted at the end of a long and flexible catheter, it is more susceptible to radiation-force induced motion.
To investigate this phenomenon, a single ARFI pulse focused at 1.0-cm depth was fired with an extended tracking interval along the center (axial) beam. Because the effects of the radiation force pulse generally are negligible at depths beyond the focus, any displacements measured within the far field were assumed to be displacements of the transducer rather than the target medium. In order to determine the extent of transducer motion during an ARFI acquisition, a complete set of radiation-force pulses was fired at the appropriate times and steering angles of a regular ARFI acquisition. The tracking lines, however, were not steered and remained focused along the center beam. Therefore, any far-field displacements measured for this acquisition would approximate the motion of the transducer during an entire ARFI sequence.
C. ARFI Imaging of Phantoms
Matched B-mode and ARFI images were formed of the 4 kPa CIRS phantom. The probe was placed on the phantom and immersed in a 0.5-cm layer of water. The imaging plane was centered over a region of the phantom containing a stiffer (32 kPa), 3-mm diameter spherical lesion at a depth of 1.0 cm. The probe was held in place with a ring stand, and sound absorbing material was placed atop the transducer to reduce reverberations within the water bath. Normal B-mode and ARFI images with a 1.0-cm radial focus were acquired.
D. ARFI Imaging of Ex Vivo Tissue
A section of the right ventricular free wall was removed from a fresh ovine heart. To reduce bulk tissue motion, the sample was placed atop a degassed sponge. Two layers of 1-cm thick sound absorptive material were placed beneath the sponge. The specimen was secured to the sponge with strands of thread and pulled taut to create tension within the sample and secure the outer segments of the tissue to the sponge. The setup was placed into an acrylic water tank (21 cm × 21 cm × 15 cm) and filled with a mixture of deionized water and saline (0.9% NaCl) at room temperature. The transducer was mounted onto a mechanical translation stage and submerged into the solution. All further adjustments to the position of the transducer were performed by the translation stage. In this configuration, transducer motion was estimated by averaging measured displacements at depths beyond 1.5 cm, then subtracted from the images.
An initial ARFI sequence was acquired on a segment of healthy, nonablated tissue. A Cardiac Pathways (Sunnyvale, CA) radiofrequency ablation device with a Boston Scientific (Natick, MA) SteeroCath catheter was used to create the lesions on the excised segment of tissue. The ablation catheter was centered within the B-mode image; and a single, 60 second, 12 W ablation was performed. While the ablation catheter was within the imaging plane, there were significant reverberations from its metallic tip, and displacement calculations within the affected regions were corrupted. Upon completion of the procedure, the ablation catheter was removed and another ARFI sequence was acquired.
The setup was translated to a second site, and another ablation was performed. The ablation catheter was positioned just tangent (approximately 3 mm) to the imaging plane such that the observed interference within the B-mode images from the metallic tip was minimal. Because the ablation catheter was no longer centered within the B-mode image, the duration was extended to 120 seconds to provide sufficient time for the lesion to gradually expand into the imaging plane. ARFI sequences were acquired approximately every 5 seconds throughout the ablation process. Upon completion, a single frame was extracted from each acquisition to form a movie that tracked the progress and development of the lesion during the entire procedure.
E. In Vivo ARFI Imaging
Radiofrequency ablations were performed at three sites within the right atrium of an ovine subject while using B-mode and ARFI imaging with the intracardiac probe to monitor the developing lesions. Both imaging and ablation catheters were positioned within the heart using live B-mode (from the intracardiac probe) and fluoroscopic imaging. During the RFA procedures, B-mode and ARFI images were recorded approximately every 5 seconds.
In order to reduce cardiac motion artifacts, the ARFI sequences were triggered off the QRS complex of the ECG. A user-selectable delay was assigned so that the images were formed during late diastole, where cardiac motion is minimized. To further reduce the effects of cardiac motion, the B-mode and ARFI images were acquired on consecutive heartbeats with individual triggers. By spreading the sequence across two heartbeats, the two shorter windows of acquisition were better positioned within the cardiac cycle.
At the first ablation site, the imaging probe was inserted via the jugular vein and imaged from within the inferior vena cava. The ablation catheter was inserted via the femoral vein and positioned within the right atrial appendage. Two consecutive ablations then were performed at this first site. The first ablation was run for 60 seconds at 12 W. For the second ablation, the duration was not extended, but the power was increased to 17 W.
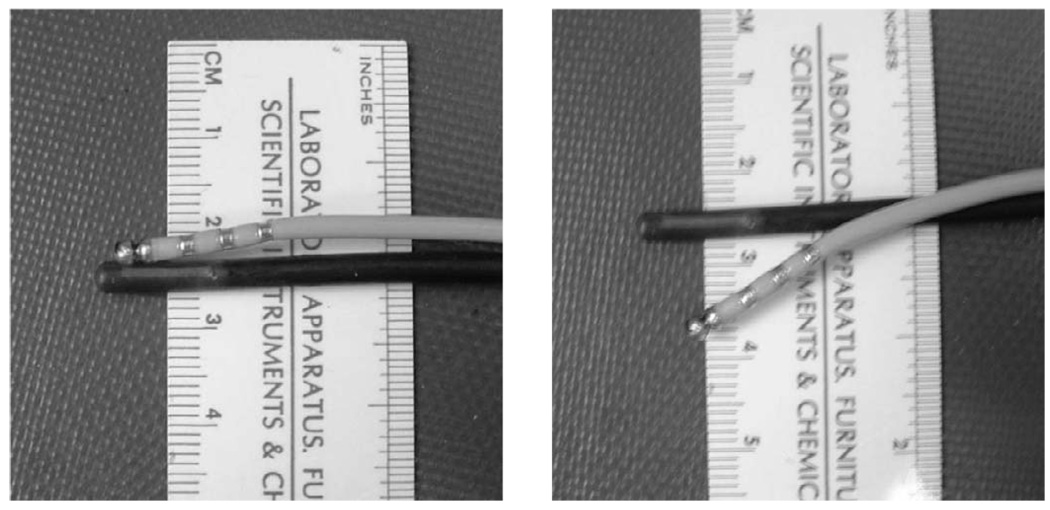
The two catheters then were withdrawn and sutured together such that the ablation catheter could flex down beside the imaging plane and be laterally centered at a depth of 1.0 cm. This obviated the independent positioning of the two catheters within the beating heart while still attempting to minimize interference from the metallic tip of the ablation catheter. The joined catheters then were inserted via the jugular vein and used for additional ablations. The coupled probes are shown in Fig. 1.
Fig. 1.
Coupled imaging and ablation (with metallic rings) catheters used at the second and third ablation sites. Joining the two probes facilitated catheter position and alignment within the heart. The two probes are fixed in their “parallel” position (a) when traveling through vessels. When properly positioned with the heart, the ablation catheter can be flexed downward (b) and onto the target myocardium for an ablation.
The second ablation site was located on the right atrial free wall near the opening to the superior vena cava. A single, 15 W, 120 second ablation was performed. The catheters were advanced slightly and the ablation catheter was repositioned for the third and final ablation within the right atrium. A single, 20 W, 30 second ablation was performed at this site.
A rapid processing scheme, in which a single ARFI frame is displayed less than a second after acquisition, was used during the entire experiment. The processing and setup used in this experiment are described by Pinton et al. [47]. This feature provided additional information concerning proper catheter placement and alignment as well as initial feedback into the progress of the developing lesions.
Upon completion of the experiment, the heart was excised and dissected in order to examine the lesions. The incision was made along the interatrial septum at which no lesions were formed. All three ablation sites within the right atrium were found and photographed to compare with the ARFI images.
IV. Results
A. Performance Assessment for ARFI Imaging
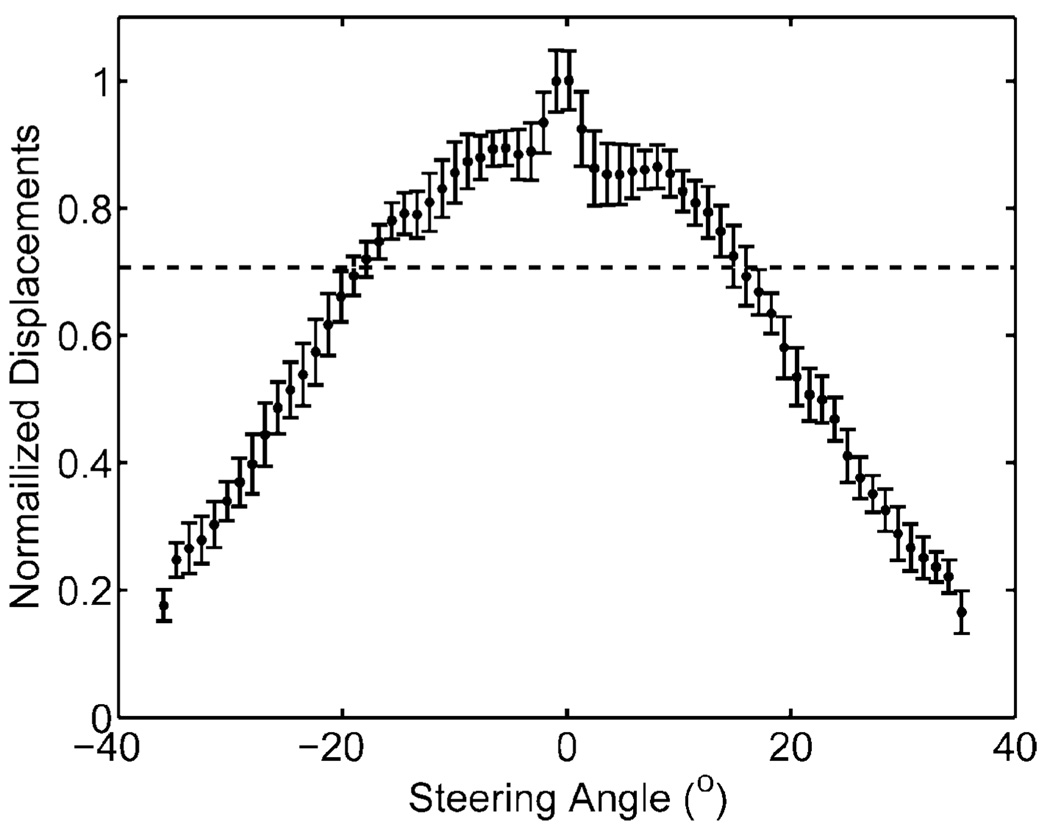
The normalized maximum displacements of a homogeneous phantom as a function of steering angle are displayed in Fig. 2. The maximum intensity is along the center beam. At angles above 15°, the normalized displacements begin to drop steeply. The −3 dB cutoff angles from this plot are at −18° and 16°. In order to produce images without large variations in displacements for a homogeneous region of interest, the ARFI field of view is limited to within these angles.
Fig. 2.
Normalized displacements (unitless) of a homogeneous phantom at various steering angles (degrees) relative to the center beam. The horizontal dotted line indicates −3 dB cutoff and field of view limits used in ARFI acquisitions.
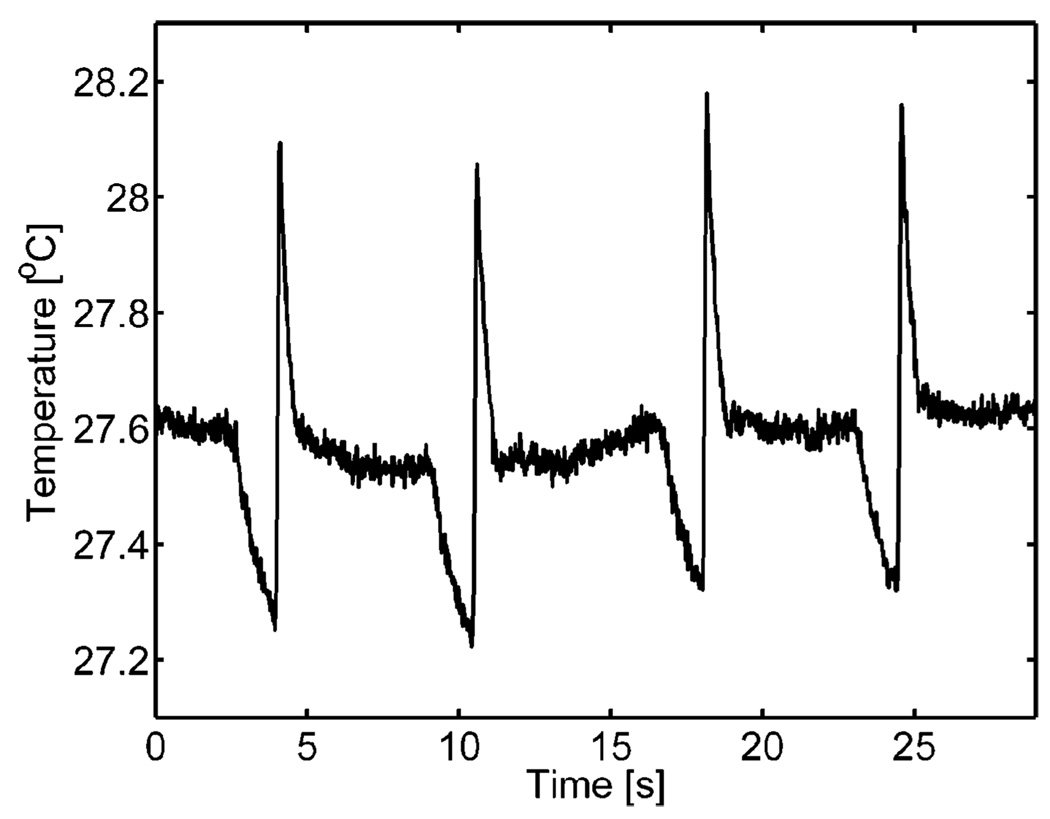
Thermocouple measurements from four consecutive ARFI acquisitions containing 38 individual radiation force pulses are shown in Fig. 3. The plot shows the heating due to an ARFI acquisition as a sharp spike in temperature. The average increase in peak-to-peak temperature on the transducer face per ARFI image was 0.88°C. The dissipation of this heat also occurs relatively quickly as the average time constant associated with the return to steady-state temperature was 330 ms. Waiting times of greater than 1 second per ARFI acquisition were used for subsequent experiments to reduce transducer heat accumulation. The temperature of the transducer face also can be observed to drop just before each ARFI acquisition. This is due to a short stoppage of imaging as the scanner is programmed to execute an ARFI acquisition.
Fig. 3.
Thermocouple measurements of the transducer face heating of four consecutive ARFI acquisitions into a layer of ultrasonic transmission gel. Each peak corresponds to an individual ARFI sequence. In between ARFI sequences, the scanner is in normal, live, B-mode imaging. The drop in temperature before an acquisition is associated with the cessation of B-mode imaging for approximately 500 ms.
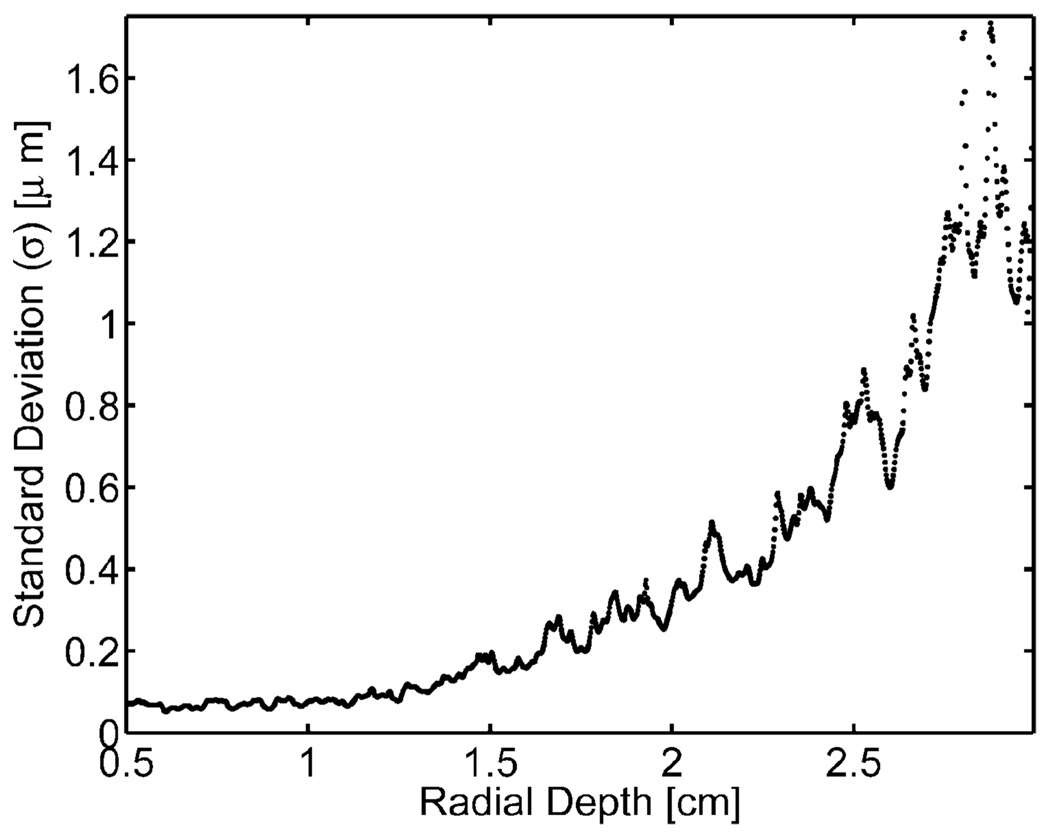
The standard deviations of measured displacement from a zero pulse amplitude ARFI sequence are shown in Fig. 4. As there was no excitation pulse for this acquisition, no displacements were expected, and all measured displacements reflect noise within the ARFI image. Fig. 4 shows the measured jitter level starting from the surface of the phantom (0.5 cm). The standard deviations within the phantom remained low (approximately 0.2 µm) and fairly constant for depths shallower than 1.2 cm. However, these levels rose quickly beyond that depth, and at 2.5 cm the jitter was above 1 µm. Because smaller displacements with ARFI images are on this order of magnitude, displacement estimations at these depths would have contained substantial amounts of jitter. Therefore, the ARFI imaging regions of interest in this experiment were at depths no greater than 1.5 cm.
Fig. 4.
Displacement noise on a homogeneous phantom from a zero amplitude radiation force pulse voltage at various radial depths.
B. Transducer Motion During ARFI Acquisitions
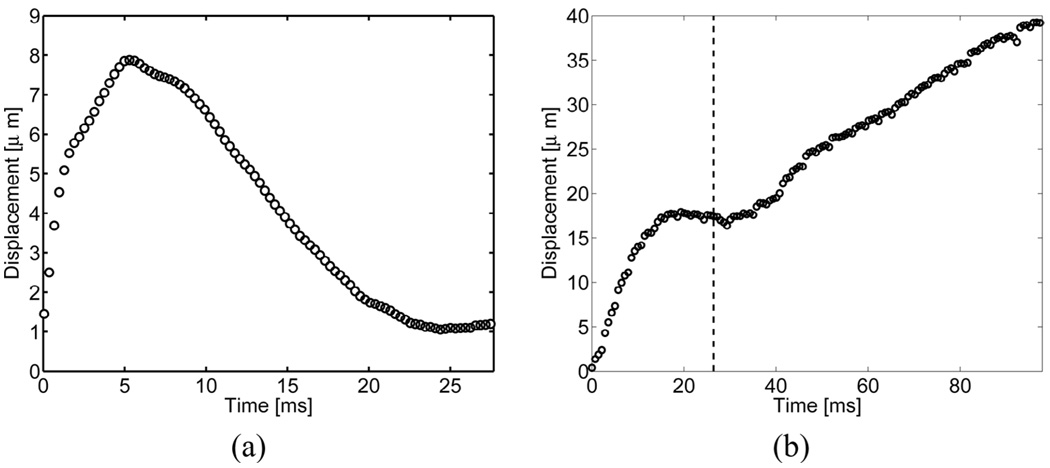
We observed artifacts in apparent target displacement consistent with transducer motion generated by each ARFI pushing pulse. This artifact was not present when the probe was secured with light pressure against the phantom. A likely reason for this artifact was that the transducer displaced when transmitting the radiation force pulses. Such motion would manifest itself as an axially uniform displacement within the images.
The average displacements through time at depths between 1.5 cm and 3.0 cm from a single radiation-force pulse with the probe suspended above a phantom are shown in Fig. 5(a). The displacement recovery time of the probe is significantly longer than those typically observed in ARFI-induced displacements within soft tissue. The maximum displacement of 8.1 µm was reached at 5.0 ms.
Fig. 5.
Transducer motion, as reflected by measurements of far-field target motion, from (a) a single radiation force pulse and (b) a full ARFI acquisition with 44 radiation force pulses. The vertical dotted line indicates the point at which data acquisition commences within regular ARFI sequences. Radiation-force pulses fired before this point cause greater nonlinear displacements and, therefore, are not used when forming ARFI images.
Transducer displacement during a full ARFI acquisition with 44 individual pushes with a push pulse repetition frequency (PRF) of 377 Hz is shown in Fig. 5(b). The total transducer displacement reaches 40 µm, and the oscillation of the transducer between pulses is 2–3 µm. Transducer displacement can be observed to become most linear and repeatable after 22 ms. Therefore, in order to acquire data when transducer motion can be most effectively filtered, the ARFI sequences used in these subsequent experiments fired high-intensity dummy pulses for the first 22 ms. After this point, the linear motion filter is able to remove a considerable portion of transducer motion from the calculated displacement profiles, and the remaining motion artifacts are observed as a uniform offset throughout the entire field of view.
C. ARFI Imaging of Phantoms
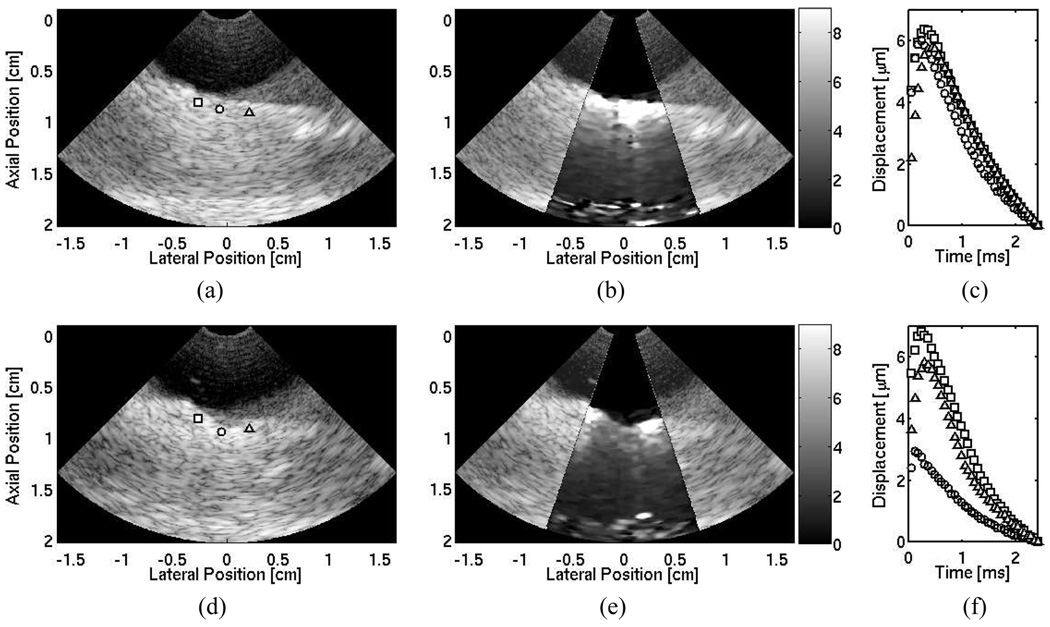
Matched B-mode and ARFI images of a laterally centered lesion embedded 0.8 cm deep within the CIRS phantom are shown in Fig. 6(a) and (b). The ARFI image displays phantom displacements at a single instant in time, 0.73 ms after generation of the radiation-force pulse. The lesion borders are not well visualized within the B-mode image. The ARFI image displays the lesion boundaries on all sides. Three displacement profiles along a single radial distance that contrast the response within the lesion to the background are shown in Fig. 6(c). The three positions are marked in the B-mode and ARFI images, by their respective shapes.
Fig. 6.
(a) B-mode image of a phantom with a 3-mm diameter lesion laterally centered and a 0.8-cm depth. (b) Corresponding ARFI image of tissue displacements (µm away from the transducer) 0.73 ms after the excitation pulse. (c) Individual displacement profiles at selected positions outside (square and triangle plots) and inside (circle plot) the lesion. These positions are marked in both B-mode and ARFI images by their corresponding shapes.
D. ARFI Imaging of Ex Vivo Tissue
B-mode and ARFI images of healthy, nonablated, ovine myocardium are shown in Fig. 7(a) and (b). The ARFI image shows a relatively uniform region with no large displacement discontinuities along the surface of the tissue. The displacements were smaller in the deeper regions of the tissue, suggesting that a significant amount of the radiation-force pulse has been attenuated on the surface of the tissue as in Fig. 7(b). Displacement profiles through time along the surface of the tissue are shown in Fig. 7(c) and are marked by their respective shapes in the B-mode image. The maximum displacements range from 6–8 µm, suggesting little variation in stiffness within the tissue.
Fig. 7.
Matched B-mode (a) and ARFI (b) images of nonablated ovine right ventricular myocardium located between axial depths of 0.5 cm to 1.7 cm, and resting on a degassed sponge below. A water/saline mixture is between the transducer and the tissue. Three shapes (square, circle, and diamond) indicate points of interest on the surface of the tissue. The circle marks the ablation site. The corresponding ARFI image (µm away from the transducer) is superimposed on the B-mode image of the healthy, nonablated cardiac tissue. (c) Displacement profiles at three points within the tissue that show local stiffnesses along the surface of the tissue. After a single radiofrequency ablation, (d) the B-mode image indicates a small crater at the ablation site. (e) The matched ARFI image superimposed on the B-mode image displays a region around the crater that displaces (µm away from the transducer) less. (f) Updated displacement profiles also reflect this decrease in displacement at the lesion site.
The B-mode and ARFI images after a single, 12 W, 120 second ablation are shown in Fig. 7(d) and (e). Although a crater is evident within the B-mode image at the ablation site, the extent of the lesion remains unclear. The ARFI images display a stiff mass at the ablation site, and lateral boundaries are evident with clear definition of lesion width. However, there is little displacement in deeper portions of the tissue, and distal boundary definition remains unclear. Three displacement profiles along the surface of the tissue are displayed in Fig. 7(f). The B-mode and ARFI images both show that a crater in the tissue was generated by the ablation. Inspection of the sample after the procedure revealed a visibly discolored and palpably stiffer region of tissue at the ablation site.
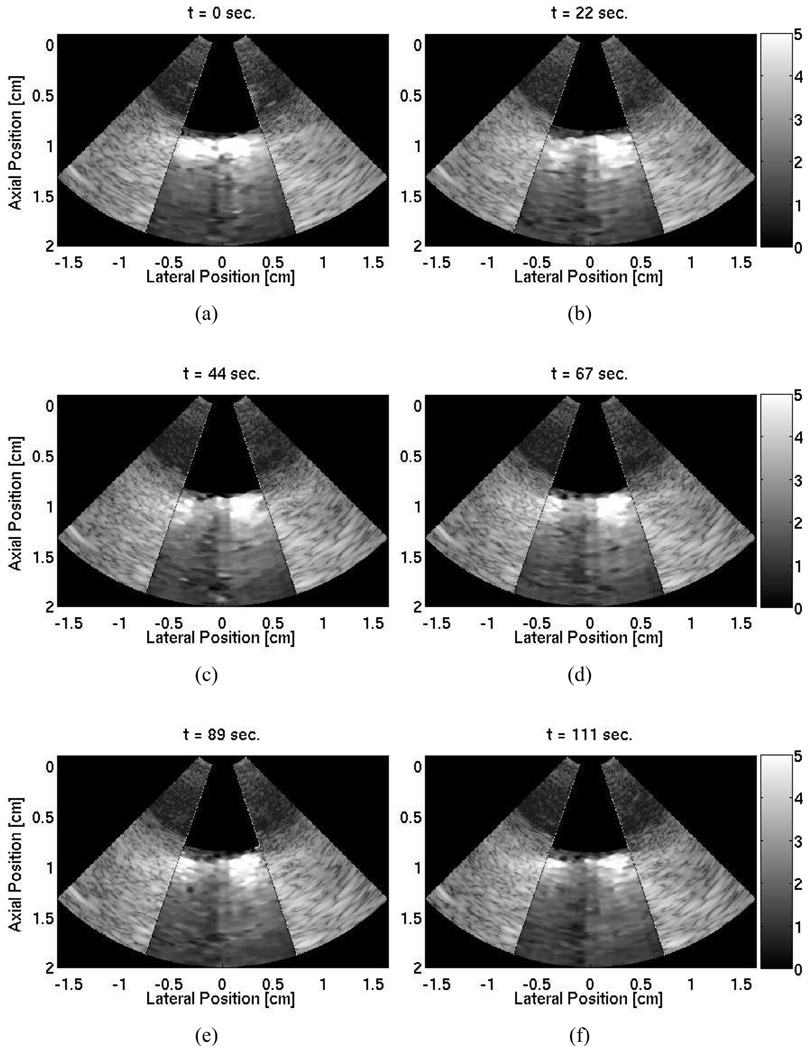
At the second ablation site, a 25-frame, time-lapse ARFI movie of a 120 second cardiac ablation shows the development of the lesion within the imaging plane. The lesion was visibly discolored and palpably stiffer after the ablation. Six ARFI images at various times during the ablation are shown in Fig. 8. The progress of the developing lesion can be tracked as the displacement gradually lessens until well-defined lateral boundaries are visible in the last frame [Fig. 8(f)]. As observed in the previous ablation, the magnitudes of displacement lessen at greater depths. As a result, the distal boundaries are not well defined. For the complete sequence of images acquired during the ablation, the reader is referred to the following website: http://ultrasound.bme.duke.edu/rtarfi/cardiacab/.
Fig. 8.
Time lapse ARFI images superimposed on their corresponding B-mode images of a 120 second cardiac ablation. A 1.0 cm bath of water/saline mixture is between the transducer and the cardiac tissue. The tissue is located between axial depths of 1.0 cm and 1.7 cm resting on a degassed sponge below. The ablation site is laterally centered on the surface of the tissue at a depth of 1.0 cm. The images show the ablation progress at times: (a) 0 s, (b) 22 s, (c) 44 s, (d) 67 s, (e) 89 s, and (d) 111 s. A developing stiffer region that displaces (µm away from the transducer) less than the surrounding tissue can be observed.
E. In Vivo ARFI Imaging
Because this experiment was performed without opening the chest, it was not possible to determine the exact orientation of the imaging plane within the heart. Therefore, the results within this section are based upon acquired images (B-mode, ARFI, and fluoroscopy), postexperiment images from pathology, entries documented in the laboratory notebook, scanner and computer time stamps, and personal expertise and recollection from the experiment.
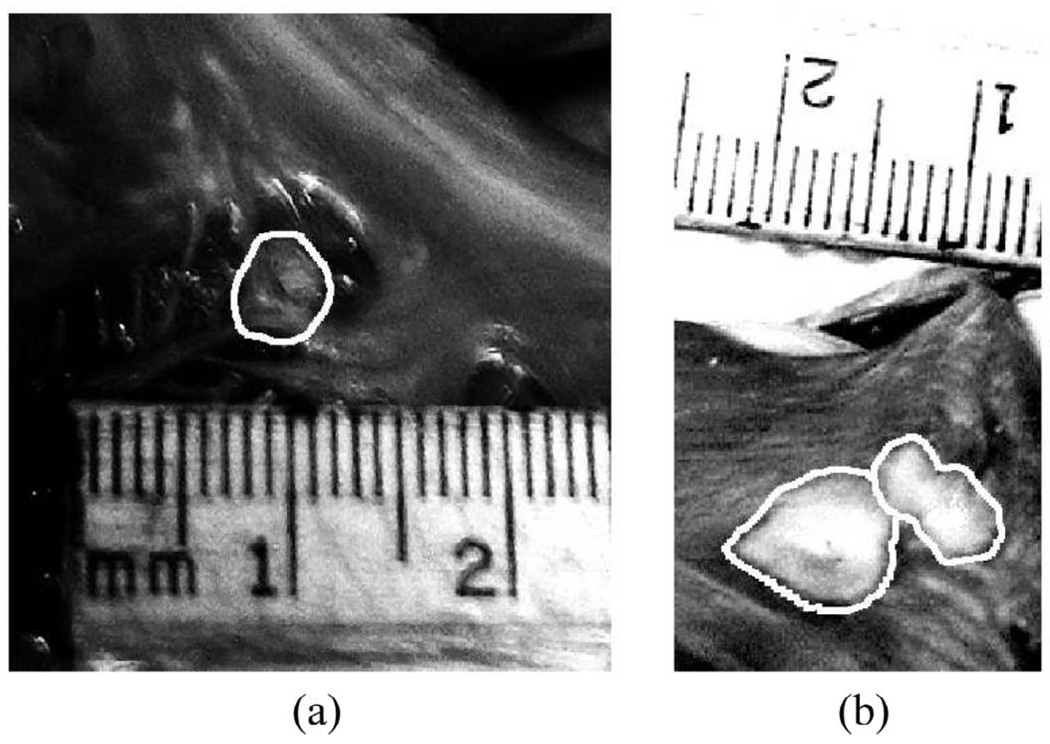
The images from pathology of the three ablation sites are shown in Fig. 9. The images taken are of the endocardial surface of the myocardium of the right atrium. The imaging probe does not image in this plane; rather it would visualize the lesion in cross section. However, as the exact orientation of the catheter relative to the lesions cannot be determined with the current experimental setup and methods, it is not possible to select a precise slice for comparison.
Fig. 9.
Images from pathology of the inner myocardial surface of the right atrium containing radiofrequency-generated lesions. The lesion boundaries were manually outlined. The first lesion (a) was located within the right atrial appendage. The second and third lesions were side-by-side lesions found on the right atrial free wall near the opening to the superior vena cava.
The first lesion was found near the right atrial appendage. The second and third lesions were found to be side-by-side lesions, with an edge separation of approximately 1 mm, and located near the opening to the superior vena cava. All three lesions spanned the entire thickness of the tissue with visible discolorations on the opposing side of the atrial wall. No additional lesions were found within the right atrium.
1. First Ablation Site
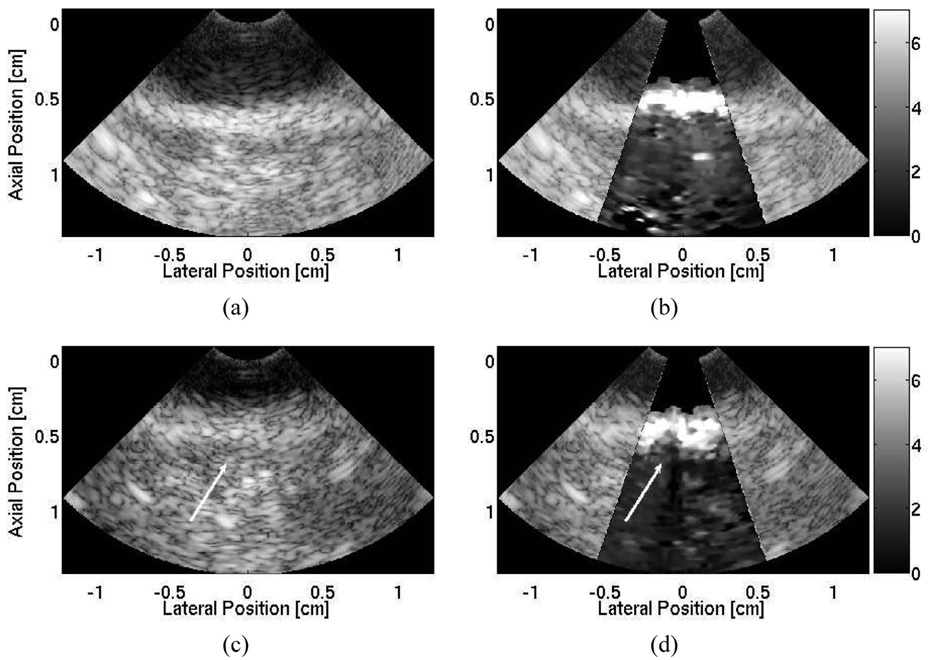
The B-mode and ARFI images at the first ablation site (right atrial appendage) are shown in Fig. 10. The corresponding image from pathology from this image is shown in Fig. 9(a). The imaging probe, focused at 1.0 cm, was positioned outside of the heart and images an ablation growing upward on the distal surface of the right atrial appendage. The B-mode image taken before the ablation [Fig. 10(a)], displayed the right atrial wall beginning at 0.5-cm depth. The distal wall and the right atrial chamber remained unclear. It is probable that the imaging plane was imperfectly aligned with the atrial wall and contained echoes from other sections of the right atrium.
Fig. 10.
B-mode and ARFI image of the first ablation site located within the right atrial appendage. The imaging catheter is located within the superior vena cava imaging a radiofrequency ablation on the distal side of the right atrial wall. The B-mode image (a) shows a region of tissue with an unclear distal boundary. The ARFI image (b), showing displacements in micrometers away from the transducer, before the ablations shows a region tissue of relatively uniform displacements. After the ablation, there is little indication of the presence of a lesion within the B-mode image (c). In contrast, the ARFI image (d) shows a small, semicircular region of tissue that displaces less, suggesting the creation of a lesion. The position of the lesion is marked by the arrow in both the postablation B-mode and ARFI images.
In contrast, the corresponding ARFI image [Fig. 10(b)] was able to visualize the distal edge of the right atrial appendage as there was a sharp drop in the measured displacements 3 mm into the tissue. The ARFI image before the ablation showed a region of tissue with relatively uniform stiffness that had an average maximum displacement of 8.9 ± 2.1 µm.
During the first ablation, the B-mode images showed that the ablation catheter drifted out of the imaging plane and, therefore, it is likely that the imaging probe had moved and was not imaging directly over the ablation site. As a result, the ARFI images did not provide much indication into the presence of a lesion. After a second, higher power ablation was performed, the B-mode image [Fig. 10(c)] did not provide any indication in the formation of a lesion; however, the matched ARFI image [Fig. 10(d)] revealed evidence of a newly formed lesion as a semicircular region of smaller displacement (average maximum displacement of 4.6±0.9 µm) was present on the distal side of the myocardium. As the displacements along the proximal surface of the myocardium appeared uniform, the ARFI image [Fig. 10(d)] suggested that the lesion did not span the entire thickness of the right atrial wall.
2. Second Ablation Site
As the second two lesions were created with the two catheters coupled together, these lesions would be located on the proximal surface of the tissue growing downward and away from the transducer. The images acquired at the second ablation site did not indicate the presence of a lesion. It is likely that the imaging catheter was not positioned over the ablation site.
3. Third Ablation Site
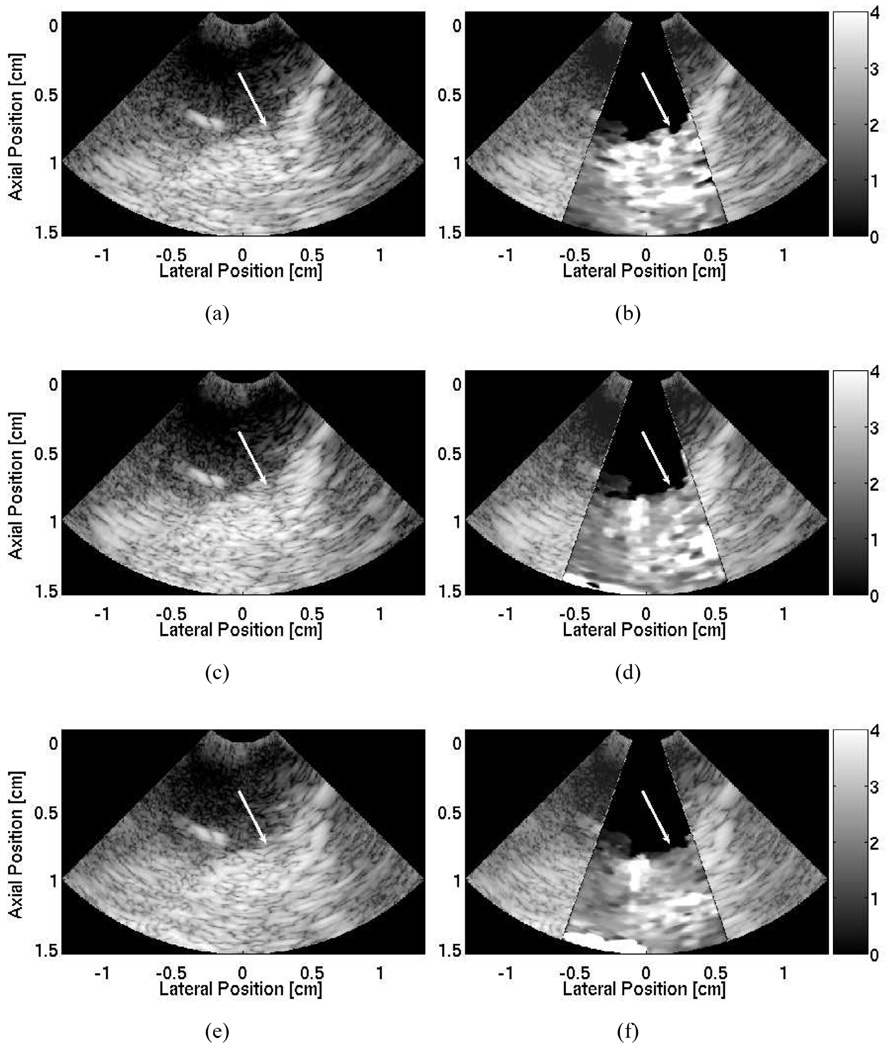
For the final ablation site within the right atrium, the joined catheters were advanced only a few millimeters from the second site. Therefore, the lesion would be formed close to the second lesion. Matched B-mode and ARFI images (focused at 1.5 cm) were acquired before and after the ablation and are shown in Fig. 11. The B-mode image taken before the ablation [Fig. 11(a)] displayed the right atrium sloping downward from right to left, but it provided little indication of the thickness of the atrial wall. A section of the ablation catheter is visible as the bright target above the atrial wall in the left side of the image. The actual catheter tip and ablation site, however, are located out of plane and on the right side of the image. The ARFI image before the ablation [Fig. 11(b)] showed a homogeneous region of myocardium at the ablation site on the right side of the image with an average maximum displacement of 4.72 ± 1.52 µm. A region of tissue with reduced tissue displacements was present on the left side of the image. The average maximum displacement within this region was 2.63 ± 0.33 µm. As there was no clear distal boundary within the ARFI image, it was uncertain at this point of the experiment whether the reduced tissue displacements were due to ablation catheter shadowing or the presence of a previous lesion.
Fig. 11.
B-mode and ARFI images of the second and third ablation sites within the right atrium near the opening to the superior vena cava. The B-mode image (a), taken after ablating at the second site but before the third, shows the right atrium sloping downward from right to left. The corresponding ARFI image (b), showing displacements in micrometers away from the transducer, displays a region of tissue on the left that displaces less than the adjacent tissue. It is believed that this is the second lesion. The B-mode images taken 18 seconds into the procedure (c) and after the ablation ended (e) show little change within the images. The corresponding ARFI images during (d) and after (f) the ablation show an additional region that gradually displaces less on the right side of the image. A narrow strip of soft tissue with greater displacement remains in the center. It is believed that this indicates the creation of side-by-side lesions separated by 1 mm. Arrows mark the position of the newly formed lesion in each image.
As the third ablation was a high power (20 W), low-duration (30 seconds) sequence, only a few images were acquired during the ablation. The B-mode image taken 18 seconds into the ablation [Fig. 11(c)] did not differ much from the B-mode image taken before the ablation. However, the corresponding ARFI image [Fig. 11(d)] showed a developing region of increased stiffness on the right side of the image. At the end of the ablation, there was little change in the B-mode image [Fig. 11(e)]. In contrast, the ARFI image [Fig. 11(f)] still showed the stiffer region in the left side of the image along with an additional stiffer region on the right side. As shadowing from the ablation catheter would cause reduced tissue displacements throughout the entire region beneath the catheter, the higher tissue displacements measured in the deeper regions of tissue on the left side of the image suggest that another lesion is present.
We believe that the ARFI images in Fig. 11(d) and (f) portray the two side-by-side lesions, as shown in Fig. 9(b), corresponding to the second and third ablation sites. The average maximum displacements in the left and right lesions region were 2.70 ± 0.25 µm and 2.46 ± 0.44 µm, respectively. A thin strip of tissue with a maximum displacement of 5.31 ± 1.13 µm remained in the center. The maximum displacements in the three (left, center, right) sections within the ARFI images taken before, during, and after the ablation are shown in Table I. The ARFI image field of view was not wide enough to encompass fully either lesion. Therefore, the entire width of the two lesions remained uncertain.
TABLE I.
Pre- and Postablation Average Maximum Displacements.
| Average maximum displacement (µm) | |||
|---|---|---|---|
| Left | Center | Right1 | |
| Preablation | 2.63 ± 0.33 | 5.60 ± 1.10 | 4.72 ± 1.52 |
| Mid-ablation | 2.59 ± 0.32 | 4.91 ± 0.67 | 3.45 ± 0.78 |
| Postablation | 2.70 ± 0.25 | 5.31 ± 1.13 | 2.46 ± 0.44 |
Location of the ablation site.
V. Discussion
Initial evaluation of intracardiac probes for ARFI imaging on the CIRS phantom indicated that the intracardiac probe was able to define the boundaries of a stiffer spherical lesion more clearly than conventional B-mode imaging. Large near field displacements within the ARFI images suggested a considerable amount of acoustic energy of the radiation force pulse was attenuated before reaching the focus. This is a typical result within higher attenuation phantoms [48] and high F/number imaging setups. As a result, boundary definition varied at different depths; however, both proximal and distal boundaries were evident with proper dynamic range selection.
The displacement plots on either side of the lesion within the phantom had similar magnitudes and profiles, and the displacement inside the lesion was considerably less. The contrast transfer efficiency (the ratio of the mean maximum displacement within the lesion to the surrounding background) was approximately 1:3. This value underestimated the actual 1:8 stiffness ratio between background material and the lesion. The underestimation in stiffness ratios also has been observed in ARFI image with larger, handheld arrays and can be attributed to a wide range of factors, including variable radiation force intensities from boundary effects and beam steering [49].
In order to form quality images of the lesion during the ablation, the imaging probe had to be positioned close enough to the ablation catheter to image the lesion, yet not directly over the ablation site as reverberations from the metallic ablation catheter tip corrupted the displacement estimates. Once the catheters were positioned properly, ARFI imaging was able to visualize RFA-created lesions in both ex vivo and in vivo myocardium.
In ex vivo tissue, the average maximum displacement within the newly formed lesion was reduced by half. Lateral boundaries of the lesion also were well defined. However, the distal boundary remained unclear due to radiation-force pulse attenuation. The ability of the time-lapse movie of the ARFI images to show the expansion of a region of tissue that displaced progressively less indicated that the probe is a suitable imaging modality for real-time monitoring of cardiac RFA procedures lasting on the order of several seconds.
In vivo ARFI images of RFAs successfully visualized three lesions created within the right atrium of an ovine heart. ARFI images taken before the ablations showed the myocardium as a region of tissue with relatively uniform displacements. After the ablations, the decreased displacements within the ARFI images at the ablation site suggested that the tissue had become stiffer and lesions were now present. There was little evidence within the B-mode images that would reflect the presence of any newly formed lesions. The lack of any noticeable changes in tissue echogenicity within the B-mode images suggested that these ablation procedures did not result in any significant changes of acoustic impedance within the targeted myocardium.
At the first ablation site, there is a slight spatial mismatch within the B-mode and ARFI images [Fig. 10(a) and (b)], as the atrial wall appears 0.2 cm closer in the ARFI images. This misregistration is due to the fact that the B-mode and ARFI images were acquired on consecutive heartbeats and, therefore, contained slight positional differences due to cardiac, respiratory, and probe motion. In vivo ARFI imaging also was able to resolve side-by-side lesions [Fig. 11(f)] with an edge separation of 1 mm. The ability of ARFI imaging to visualize these regions of nonablated tissue between individual lesions could be useful in assessing lesion continuity and determining the need for additional consolidation ablations.
As catheter placement was a concern ex vivo, it became a major difficulty in vivo with the introduction of cardiac motion and the decreased maneuverability of the two catheters. As all three lesions eventually were found, it is likely that the primary limitation during this study was the proper placement and alignment of the two probes. Slight variations in probe position and orientation would result in images that did not contain the lesion or were corrupted by the ringing from the ablation catheter tip. The uncertainty in catheter placement within the heart varied the success and repeatability in formulating these ARFI images. For example, the ARFI image at the first ablation site [Fig. 10(d)] suggested that the lesion did not completely develop through the entire thickness of the tissue, although examination through pathology revealed otherwise. However, as no portion of the ablation catheter below the tissue was visible within the corresponding B-mode image [Fig. 10(c)], it is likely that the ICE probe was imaging over the edge of the lesion and not at the plane of its largest diameter.
As the heart does not completely stop during the cardiac cycle, some degree of physiological motion was present within all of our displacement estimates. The precise synchronization of the ARFI image acquisitions with cardiac diastole ensured that the amount of cardiac motion artifacts was minimized. Motion filters were used to remove these remaining artifacts. As the in vivo filtered displacement magnitudes and profiles were similar to those measured in the stationary ex vivo experiments, we believe these motion filters satisfactorily removed the measured cardiac motion artifacts during diastole. Evaluating the performance of the motion filters was beyond the scope of this study, and further investigations are underway to quantify the extent of bias that these residual motion artifacts have on intracardiac ARFI imaging at all points of the cardiac cycle.
As the ablations were performed within the right atrium, there was less physiologic motion as compared to ventricular motion. Therefore, ARFI imaging of ventricular RFAs is more difficult as the motion filter is required to remove much larger and possibly more complex motion artifacts. Also, the larger size of the ventricles introduces the possibility that the ablation site could be located farther away from the transducer. Visualizing lesions at greater depths remains a challenge as the output power and amount of radiation force generated with an intracardiac probe is limited by its small size. It is possible that future generations of ICE probes will be capable of generating more acoustic power.
Several methods are being explored to help improve ARFI imaging quality. In future experiments, time gain compensation (TGC)-based algorithms are being considered to expand the current field of view, thereby aiding in the visualization of distal boundaries. More sophisticated motion filters and mechanical alterations to the probe itself are being explored to help reduce transducer motion. Recent advances in parallel receive ARFI imaging have reduced acquisition times by a factor of at least four [50]. Shorter sequences also have resulted in less heating per individual acquisition to a point at which multiple images could be acquired during a single heartbeat. With a higher frame rate, there is more flexibility in positioning the two catheters as the probability of forming an image with the proper catheter alignment has increased.
VI. Conclusions
Intracardiac ARFI imaging required several sequence modifications to the traditional transthoracic ARFI imaging due to beam steering, lowered SNR, and the effects related to transducer heating and motion. With these adjustments, ARFI imaging with an intracardiac probe was able to visualize a stiffer lesion within a phantom more clearly than normal B-mode imaging. Also, ARFI imaging with the intracardiac probe was able to display variations in local stiffnesses ex vivo in cardiac tissue and assess the lateral size of the developing lesion throughout the entire RFA procedure.
ARFI imaging on current commercially available systems is capable of visualizing in vivo lesions created from RFA in the right atrium of an ovine heart up to depths of 1.5 cm from both the proximal and distal surfaces within the imaging plane. The comparison between the ARFI images and pathology indicated that ARFI imaging is able to resolve lesions with an edge spacing of 1 mm.
With these promising preliminary results and continued development, we believe ARFI imaging with an intracardiac probe is a candidate to guide and monitor radiofrequency ablations within the heart.
Acknowledgments
We would like to thank Siemens Medical Solutions USA, Inc., for their hardware and system support. The AcuNav arrays used in these experiments were supplied by Duke University Medical Center, Department of Cardiology. We would also like to thank Biosense Webster. We would also like to thank Ellen Dixon-Tulloch, Kathryn Nightingale, Dale Bergman, and Nick Zadno.
This research was funded by NIH Grant #: 1R01-HL-075485-01.
Biographies

Stephen J. Hsu was born in Huntsville, AL, in 1980. He received his B.S.E. degree in biomedical and electrical engineering from Duke University, Durham, NC, in 2001. He currently is a Ph.D. graduate student in the Duke University Biomedical Engineering Department.
His research interests include acoustic radiation force impulse imaging and cardiac ultrasound imaging.
Brian J. Fahey was born in Lowell, MA, in 1980. He received his B.S. degree in biomedical engineering from Trinity College in Hartford, CT, in 2002. He is currently pursuing the Ph.D. degree in biomedical engineering from Duke University in Durham, NC.
His research interests include radiation-force, based imaging techniques and adaptive ultrasonic imaging.
Douglas M. Dumont was born in Florence, SC, in 1979. He received his B.S.E. degree from Duke University, Durham, NC, in 2002. He served in the Americorps as a Vista volunteer in 2003. He is currently pursuing the Ph.D. degree in biomedical engineering from Duke University.
His research interests include acoustic radiation-force, based imaging and vascular imaging.
Patrick D. Wolf (M’89) was born in Altoona, PA, in 1956. He received a B.S. degree in electrical engineering and an M.S. degree in bioengineering from the Pennsylvania State University, State College, PA. After receiving his Ph.D. degree from Duke University, Durham, NC, in 1992, he joined the faculty in biomedical engineering.
He is currently pursuing his research interests in instrumentation, cardiac arrhythmias, and the brain-machine interface.

Gregg E. Trahey (S’83–M’85) received the B.G.S. and M.S. degrees from the University of Michigan, Ann Arbor, MI, in 1975 and 1979, respectively. He received the Ph.D. degree in biomedical engineering in 1985 from Duke University, Durham, NC. He served in the Peace Corps from 1975 to 1978 and was a project engineer at the Emergency Care Research Institute in Plymouth Meeting, PA, from 1980–1982. He is a professor with the Department of Biomedical Engineering, Duke University.
He is conducting research in adaptive phase correction, radiation force imaging methods, and 2-D flow imaging in medical ultrasound.
References
- 1.Nightingale K, Bentley R, Trahey GE. Observations of tissue response to acoustic radiation force: Opportunities for imaging. Ultrason. Imag. 2002;vol. 24:100–108. doi: 10.1177/016173460202400301. [DOI] [PubMed] [Google Scholar]
- 2.Nyborg WLM. Acoustic streaming. In: Mason WP, editor. Physical Acoustics. vol. IIB. New York: Academic; 1965. pp. 265–331. [Google Scholar]
- 3.Mitchell MA, McRury ID, Haines DE. Linear atrial ablations in a canine model of chronic atrial fibrillation: Morphological and electrophysiological observations. Circulation. 1998 Mar.vol. 97:1176–1185. doi: 10.1161/01.cir.97.12.1176. [DOI] [PubMed] [Google Scholar]
- 4.Fahey BJ, Nightingale KR, Wolf PD, Trahey GE. Acoustic radiation force impulse imaging of myocardial radiofrequency ablation: Initial in vivo results. IEEE Trans. Ultrason., Ferroelect., Freq. Contr. 2005;vol. 52(no 4):631–641. doi: 10.1109/tuffc.2005.1428046. [DOI] [PubMed] [Google Scholar]
- 5.Yamada E, Zhang Y, Davies R, Coddington W, Kerber RE. Phased-array intracardiac echocardiographic imaging of acute cardiovascular emergencies: Experimental studies in dogs. J. Amer. Soc. Echocardiogr. 2002 Oct.vol. 15:1309–1314. doi: 10.1067/mje.2002.122631. [DOI] [PubMed] [Google Scholar]
- 6.Elvan A, Pride HP, Eble JN, Zipes DP. Radiofrequency catheter ablation of the atria reduces inducibility and duration of atrial fibrillation in dogs. Circulation. 1995 Apr.vol. 91:2235–2244. doi: 10.1161/01.cir.91.8.2235. [DOI] [PubMed] [Google Scholar]
- 7.Chu E, Kalman J, Kwasman M, Jue J, Fitzgerald P, Epstein L, Schiller N, Yock P, Lesh M. Intracardiac echocardiography during radiofrequency catheter ablations of cardiac arrhythmias in humans. J. Amer. Coll. Cardiol. 1994;vol. 24:151–1357. doi: 10.1016/0735-1097(94)90119-8. [DOI] [PubMed] [Google Scholar]
- 8.Li P, Dairywala IT, Liu Z, Stewart SR, Mathew B, Bowie D, Vannan MA. Anatomic and hemodynamic imaging using a new vector phased-array intracardiac catheter. J. Amer. Soc. Echocardiogr. 2002 Apr.vol. 15:349–355. doi: 10.1067/mje.2002.116312. [DOI] [PubMed] [Google Scholar]
- 9.Sheikh I, Kumar D, Liu Z, Kantharia B, MacMillan R, Fyfe B, Narula J, Vannan M. Novel uses of intracardiac echocardiography with a phased-array imaging catheter. J. Amer. Soc. Echocardiogr. 2003;vol. 16(no 10):1073–1077. doi: 10.1016/S0894-7317(03)00474-7. [DOI] [PubMed] [Google Scholar]
- 10.Kalman JM, Lee RJ, Fisher WG, Chin MC, Ursell P, Stillson CA, Lesh MD, Scheinman MM. Radiofrequency catheter modification of sinus pacemaker function guided by intracardiac echocardiography. Circulation. 1995 Nov.vol. 92:3070–3081. doi: 10.1161/01.cir.92.10.3070. [DOI] [PubMed] [Google Scholar]
- 11.Souchon R, Rouviére O, Gelet A, Detti V, Srinivasan S, Ophir J, Chapelon JY. Visualisation of HIFU lesions using elastography of the human prostate in vivo: Preliminary results. Ultrasound Med. Biol. 2003 July;vol. 29:1007–1015. doi: 10.1016/s0301-5629(03)00065-6. [DOI] [PubMed] [Google Scholar]
- 12.Torr G. The acoustic radiation force. Amer. J. Phys. 1984;vol. 52:402–408. [Google Scholar]
- 13.Ren JF, Marchlinski FE, Callans DJ, Herrmann HC. Clinical use of AcuNav diagnostic ultrasound catheter imaging during left heart radiofrequency ablation and transcatheter closure procedures. J. Amer. Soc. Echocardiogr. vol. 15:10. doi: 10.1067/mje.2002.124646. [DOI] [PubMed] [Google Scholar]
- 14.Morton JB, Sanders P, Sparks PB, Morgan J, Kalman JM. Usefulness of phased-array intracardiac echocardiography for the assessment of left atrial mechanical ‘stunning’ in atrial flutter and comparison with multiplane transesophageal echocardiography. Amer. J. Cardiol. 2002 Oct.vol. 90:741–746. doi: 10.1016/s0002-9149(02)02601-2. [DOI] [PubMed] [Google Scholar]
- 15.Fahey BJ, Nightingale KR, Nelson RC, Palmeri ML, Trahey GE. Acoustic radiation force impulse imaging of the abdomen: Demonstration of feasibility and utility. Ultrasound Med. Biol. 2005 Sep.vol. 31:1185–1198. doi: 10.1016/j.ultrasmedbio.2005.05.004. [DOI] [PubMed] [Google Scholar]
- 16.Martin RE, Ellenbogen KA, Lau YR, Hall JA, Kay GN, Shepard RK, Nixon JV, Wood MA. Phased-array intracardiac echocardiography during pulmonary vein isolation and linear ablation for atrial fibrillation. J. Cardiovasc. Electrophysiol. 2002 Sep.vol. 13:873–879. doi: 10.1046/j.1540-8167.2002.00873.x. [DOI] [PubMed] [Google Scholar]
- 17.Meininger GR, Calkins H, Lickfett L, Lopath P, Fjield T, Pacheco R, Harhen P, Rodriguez ER, Berger R, Halperin H, Solomon SB. Initial experience with a novel focused ultrasound ablation system for ring ablation outside the pulmonary vein. J. Interv. Cardiol. Electrophysiol. 2003 Apr.vol. 8:141–148. doi: 10.1023/a:1023613018185. [DOI] [PubMed] [Google Scholar]
- 18.Kimman GP, Bogaard MD, van Hemel NM, van Dessel PF, Jessurun ER, Boersma LV, Wever EF, Theuns DA, Jordaens LJ. Ten year follow-up after radiofrequency catheter ablation for atrioventricular nodal reentrant tachycardia in the early days forever cured, or a source for new arrhythmias? Pacing Clin. Electrophysiol. 2005 Dec.vol. 28:1302–1309. doi: 10.1111/j.1540-8159.2005.00271.x. [DOI] [PubMed] [Google Scholar]
- 19.Dahl JJ, Pinton GF, Palmeri ML, Agrawal V, Nightingale KR, Trahey GE. A parallel tracking method for acoustic radiation force impulse imaging. IEEE Trans. Ultrason., Ferroelect., Freq. Contr. 2007;vol. 54(no 2):301–312. doi: 10.1109/tuffc.2007.244. [DOI] [PMC free article] [PubMed] [Google Scholar]
- 20.Palmeri ML, Sharma AC, Bouchard RR, Nightingale RW, Nightingale KR. A finite-element method model of soft tissue response to impulsive acoustic radiation force. IEEE Trans. Ultrason., Ferroelect., Freq. Contr. 2005 Oct.vol. 52:1699–1712. doi: 10.1109/tuffc.2005.1561624. [DOI] [PMC free article] [PubMed] [Google Scholar]
- 21.Beukema WP, Elvan A, Sie HT, Misier AR, Wellens HJ. Successful radiofrequency ablation in patients with previous atrial fibrillation results in a significant decrease in left atrial size. Circulation. 2005 Oct.vol. 112:2089–2095. doi: 10.1161/CIRCULATIONAHA.104.484766. [DOI] [PubMed] [Google Scholar]
- 22.Gertner MR, Worthington AE, Wilson BC, Sherar MD. Ultrasound imaging of thermal therapy in in vitro liver. Ultrasound Med. Biol. 1998 Sep.vol. 24:1023–1032. doi: 10.1016/s0301-5629(98)00087-8. [DOI] [PubMed] [Google Scholar]
- 23.Huber CH, Nasratulla M, Augstburger M, von Segesser LK. Ultrasound navigation through the heart for off-pump aortic valved stent implantation: New tools for new goals. J. Endovasc. Therapy. 2004 Aug.vol. 11:503–510. doi: 10.1583/04-1240.1. [DOI] [PubMed] [Google Scholar]
- 24.Nightingale K, Soo M, Nightingale R, Trahey G. Acoustic radiation force impulse imaging: In vivo demonstration of clinical feasibility. Ultrasound Med. Biol. doi: 10.1016/s0301-5629(01)00499-9. [DOI] [PubMed] [Google Scholar]
- 25.Dairywala IT, Li P, Liu Z, Stewart SR, Bayoumy AA, Murthy TH, Vannan MA. Catheter-based interventions guided solely by a new phased-array intracardiac imaging catheter: In vivo experimental studies. J. Amer. Soc. Echocardiogr. 2002;vol. 15(no 2):150–158. doi: 10.1067/mje.2002.115774. [DOI] [PubMed] [Google Scholar]
- 26.Pappone C, Santinelli V, Manguso F, Augello G, Santinelli O, Vicedomini G, Gulletta S, Mazzone P, Tortoriello V, Pappone A, Dicandia C, Rosanio S. A randomized study of prophylactic catheter ablation in asymptomatic patients with the Wolff-Parkinson-White syndrome. N. Engl. J. Med. 2003 Nov.vol. 349:1803–1811. doi: 10.1056/NEJMoa035345. [DOI] [PubMed] [Google Scholar]
- 27.Sharma AC, Soo MS, Trahey GE, Nightingale KR. Acoustic radiation force impulse imaging of in vivo breast masses; Proc. IEEE Ultrason. Symp; 2004. pp. 728–731. [Google Scholar]
- 28.Trahey GE, Palmeri ML, Bentley RC, Nightingale KR. Acoustic radiation force impulse imaging of the mechanical properties of arteries: In vivo and ex vivo results. Ultrasound Med. Biol. 2004 Sep.vol. 30:1163–1171. doi: 10.1016/j.ultrasmedbio.2004.07.022. [DOI] [PubMed] [Google Scholar]
- 29.Varghese T, Zagzebski JA, Rahko P, Breburda CS. Ultrasonic imaging of myocardial strain using cardiac elastography. Ultrason. Imag. 2003 Jan.vol. 25:1–16. doi: 10.1177/016173460302500101. [DOI] [PubMed] [Google Scholar]
- 30.Ren JF, Schwartzman D, Callans DJ, Brode SE, Gottlieb CD, Marchlinski FE. Intracardiac echocardiography (9 MHz) in humans: Methods, imaging views and clinical utility. Ultrasound Med. Biol. 1999 Sep.vol. 25:1077–1086. doi: 10.1016/s0301-5629(99)00064-2. [DOI] [PubMed] [Google Scholar]
- 31.Khoury DS, Rao L, Ding C, Sun H, Youker KA, Panescu D, Nagueh SF. Localizing and quantifying ablation lesions in the left ventricle by myocardial contrast echocardiography. J. Cardiovasc. Electrophys. 2004;vol. 15(no 9):1078–1087. doi: 10.1046/j.1540-8167.2004.04087.x. [DOI] [PubMed] [Google Scholar]
- 32.Ussia GP, Privitera A, Campisi M, Carminati M, De Luca F. Intracardiac echocardiography using the AcuNav ultrasound catheter during percutaneous closure of multiple atrial septal defects. Ital. Heart J. 2004 May;vol. 5:392–395. [PubMed] [Google Scholar]
- 33.Varghese T, Zagzebski JA, Lee FT. Elastographic imaging of thermal lesions in the liver in vivo following radiofrequency ablation: Preliminary results. Ultrasound Med. Biol. 2002 Nov.–Dec.vol. 28:1467–1473. doi: 10.1016/s0301-5629(02)00656-7. [DOI] [PubMed] [Google Scholar]
- 34.Nightingale KR, Palmeri ML, Nightingale RW, Trahey GE. On the feasibility of remote palpation using acoustic radiation force. J. Acoust. Soc. Amer. 2001 July;vol. 110:625–634. doi: 10.1121/1.1378344. [DOI] [PubMed] [Google Scholar]
- 35.Koenig P, Cao QL, Heitschmidt M, Waight DJ, Hijazi ZM. Role of intracardiac echocardiographic guidance in transcatheter closure of atrial septal defects and patent foramen ovale using the Amplatzer device. J. Interv. Cardiol. 2003 Feb.vol. 16:51–62. doi: 10.1046/j.1540-8183.2003.08003.x. [DOI] [PubMed] [Google Scholar]
- 36.Varghese T, Techavipoo U, Liu W, Zagzebski JA, Chen Q, Frank G, Lee FT. Elastographic measurement of the area and volume of thermal lesions resulting from radiofrequency ablation: pathologic correlation. Amer. J. Roentgenol. 2003 Sep.vol. 181:701–707. doi: 10.2214/ajr.181.3.1810701. [DOI] [PubMed] [Google Scholar]
- 37.Dalal A, Asirvatham SJ, Chandrasekaran K, Seward JB, Tajik AJ. Intracardiac echocardiography in the detection of pacemaker lead endocarditis. J. Amer. Soc. Echocardiogr. 2002 Sep.vol. 15:1027–1028. doi: 10.1067/mje.2002.121276. [DOI] [PubMed] [Google Scholar]
- 38.Konofagou EE, D’hooge J, Ophir J. Myocardial elastography—A feasibility study in vivo. Ultrasound Med. Biol. 2002 Apr.vol. 28:475–482. doi: 10.1016/s0301-5629(02)00488-x. [DOI] [PubMed] [Google Scholar]
- 39.Boctor EM, Fichtinger G, Yeung A, Awad M, Taylor RH, Choti MA. Robotic strain imaging for monitoring thermal ablation of liver. Med. Image Comput. Comput.-Assisted Intervention. 2004:81–88. [Google Scholar]
- 40.Deng CX, Qu F, Nikolski VP, Zhou Y, Efimov IR. Fluorescence imaging for real-time monitoring of high-intensity focused ultrasound cardiac ablation. Ann. Biomed. Eng. 2005 Oct.vol. 33:1352–1359. doi: 10.1007/s10439-005-6806-4. [DOI] [PubMed] [Google Scholar]
- 41.Salem MI, Makaryus AN, Kort S, Chung E, Marchant D, Ong L, Mangion J. Intracardiac echocardiography using the AcuNav ultrasound catheter during percutaneous balloon mitral valvuloplasty. J. Amer. Soc. Echocardiogr. 2002 Dec.vol. 15:1533–1537. doi: 10.1067/mje.2002.126771. [DOI] [PubMed] [Google Scholar]
- 42.Cha CH, Lee FT, Gurney JM, Markhardt BK, Warner TF, Kelcz F, Mahvi DM. CT versus sonography for monitoring radiofrequency ablation in a porcine liver. AJR Amer. J. Roentgenol. 2000 Sep.vol. 175:705–711. doi: 10.2214/ajr.175.3.1750705. [DOI] [PubMed] [Google Scholar]
- 43.Okishige K, Kawabata M, Yamashiro K, Ohshiro C, Umayahara S, Gotoh M, Sasano T, Isobe M. Clinical study regarding the anatomical structures of the right atrial isthmus using intracardiac echocardiography: implication for catheter ablation of common atrial flutter. J. Interv. Cardiol. Electrophysiol. 2005 Jan.vol. 12:9–12. doi: 10.1007/s10840-005-5835-0. [DOI] [PubMed] [Google Scholar]
- 44.Rodrigues AC, d’Avila A, Houghtaling C, Ruskin JN, Picard M, Reddy VY. Intrapericardial echocardiography: A novel catheter-based approach to cardiac imaging. J. Amer. Soc. Echocardiogr. 2004 Mar.vol. 17:269–274. doi: 10.1016/j.echo.2003.10.024. [DOI] [PubMed] [Google Scholar]
- 45.Pinton GF, Dahl JJ, Trahey GE. Rapid tracking of small displacements with ultrasound. IEEE Trans. Ultrason., Ferroelect., Freq. Contr. 2006;vol. 53(no 6):1103–1117. doi: 10.1109/tuffc.2006.1642509. [DOI] [PubMed] [Google Scholar]
- 46.Dumont DM, Allen JD, Miller EM, Moyer C, Hsu SJ, Trahey GE. Peripheral vascular ARFI imaging: Phantom and clinical results; Proc. IEEE Ultrason. Symp; 2005. pp. 605–608. [Google Scholar]
- 47.Palmeri ML, Frinkley KD, Nightingale KR. Experimental studies of the thermal effects associated with radiation force imaging of soft tissue. Ultrason. Imag. 2004;vol. 26:29–40. doi: 10.1177/016173460402600203. [DOI] [PubMed] [Google Scholar]
- 48.Nightingale KR, Palmeri ML, Trahey GE. Analysis of contrast in images generated with transient acoustic radiation force. Ultrasound Med. Biol. 2006 Jan.vol. 32:61–72. doi: 10.1016/j.ultrasmedbio.2005.08.008. [DOI] [PubMed] [Google Scholar]
- 49.Pappone C, Rosanio S, Oreto G, Tocchi M, Gugliotta F, Vicedomini G, Salvati A, Dicandia C, Mazzone P, Santinelli V, Gulletta S, Chierchia S. Circumferential radiofrequency ablation of pulmonary vein ostia: A new anatomic approach for curing atrial fibrillation. Circulation. 2000 Nov.vol. 102:2619–2628. doi: 10.1161/01.cir.102.21.2619. [DOI] [PubMed] [Google Scholar]
- 50.Fahey BJ, Hsu SJ, Wolf PD, Nelson RC, Trahey GE. Liver ablation guidance with acoustic radiation force impulse imaging: Challenges and opportunities. Phys. Med. Biol. 2006;vol. 51(no 15):3785–3808. doi: 10.1088/0031-9155/51/15/013. [DOI] [PMC free article] [PubMed] [Google Scholar]


