Abstract
OBJECTIVE: To evaluate the influence of cardiorespiratory fitness (fitness) on the obesity paradox in middle-aged men with known or suspected coronary artery disease.
PATIENTS AND METHODS: This study consists of 12,417 men aged 40 to 70 years (44% African American) who were referred for exercise testing at the Veterans Affairs Medical Centers in Washington, DC, or Palo Alto, CA (between January 1, 1983, and June 30, 2007). Fitness was quantified as metabolic equivalents achieved during a maximal exercise test and was categorized for analysis as low, moderate, and high (defined as <5, 5-10, and >10 metabolic equivalents, respectively). Adiposity was defined by body mass index (BMI) according to standard clinical guidelines. Separate and combined associations of fitness and adiposity with all-cause mortality were assessed by Cox proportional hazards analyses.
RESULTS: We recorded 2801 deaths during a mean ± SD follow-up of 7.7±5.3 years. Multivariate hazard ratios (95% confidence interval) for all-cause mortality, with normal weight (BMI, 18.5-24.9 kg/m2) used as the reference group, were 1.9 (1.5-2.3), 0.7 (0.7-0.8), 0.7 (0.6-0.7), and 1.0 (0.8-1.1) for BMIs of less than 18.5, 25.0 to 29.9, 30.0 to 34.9, and 35.0 or more kg/m2, respectively. Compared with highly fit normal-weight men, underweight men with low fitness had the highest (4.5 [3.1-6.6]) and highly fit overweight men the lowest (0.4 [0.3-0.6]) mortality risk of any subgroup. Overweight and obese men with moderate fitness had mortality rates similar to those of the highly fit normal-weight reference group.
CONCLUSION: Fitness altered the obesity paradox. Overweight and obese men had increased longevity only if they registered high fitness.
In this study of middle-aged men with known or suspected coronary artery disease, fitness altered the obesity paradox; compared with highly fit normal-weight men, underweight men with low fitness had the highest mortality risk and highly fit overweight men had the lowest mortality risk of any subgroup.
BMI = body mass index; BP = blood pressure; CI = confidence interval; CVD = cardiovascular disease; HR = hazard ratio; MET = metabolic equivalent; VETS = Veterans Exercise Testing Study
Body mass index (BMI) has been widely used to evaluate the mortality risk associated with obesity. Although many large epidemiological studies of the general population report a positive association between BMI and mortality,1-3 consistent inverse associations (the so-called obesity paradox) have been observed among patients with heart failure,4 coronary heart disease,5,6 hypertension,7 peripheral artery disease,8 type 2 diabetes,9 and chronic kidney disease.10 An obesity paradox has also been observed in healthier populations as diverse as San Francisco longshoremen,11 Native American women of the Pima tribe,12 men from rural Scotland,13 Nauruan men,14 and the elderly.15
Although substantial evidence for an obesity paradox has accumulated during the past decade,16 including a recent examination of the influence of weight loss,17 the influence of cardiorespiratory fitness (fitness) has not been adequately explored. Objective measures of fitness from clinical exercise testing are not readily available. Consequently, few studies have examined the combined effects of fitness and BMI on mortality, and these data come from only 2 cohorts: the Lipid Research Clinics Study18,19 and the Aerobics Center Longitudinal Study.20-26 Collectively, these reports provide convincing evidence that fitness is a more powerful predictor of mortality than BMI. However, these findings are from populations without an obesity paradox.
For editorial comment, see page 112
The Veterans Exercise Testing Study (VETS) affords a unique opportunity to study simultaneous measures of fitness and adiposity in a large patient population exhibiting an obesity paradox. A previous report from our group provided compelling evidence that higher levels of fitness, as well as higher BMI, reduced mortality risk in men referred for exercise testing.27 However, this report did not examine the combined effects of fitness and BMI on mortality. Such joint analyses may identify associations obscured in independent analyses alone. To avoid bias associated with age,28 we confined our investigation to men aged 40 to 70 years. The purpose of the current study was to examine the influence of fitness on the obesity paradox in middle-aged men with known or suspected cardiovascular disease (CVD).
PATIENTS AND METHODS
VETS is an ongoing, prospective epidemiological investigation of veteran patients that began in 1983. All patients are referred for exercise testing either as a routine evaluation or as an evaluation for exercise-induced ischemia. Participants in the current study were drawn from a cohort of 15,660 male veterans (excluding patients with a history of implanted pacemaker, those who developed left bundle-branch block during the test, and those who were clinically unstable or required emergent intervention) at the Veterans Affairs Medical Center, Washington, DC (n=9042) and the Veterans Affairs Palo Alto (CA) Health Care System (n=6618) who completed an exercise tolerance test at least once during 1983-2007. After patients younger than 40 (n=711) and older than 70 (n=2532) years were excluded, 12,417 patients were included in the analysis.
The 12,417 participants were either African American (n=5435) or white (n=6982) men who ranged in age from 40 to 70 years (mean ± SD, 57±8 years). Ethnicity was determined by electronic records and self-reports at the time of exercise testing. All patients gave written consent before the exercise tolerance test. The study was approved by the institutional review board at each site.
Additional information on study methods and characteristics of this cohort has been previously published.29
Clinical Evaluation and Exercise Testing
A standardized medical examination by a physician, including personal and family histories, was completed for all participants before exercise testing. All demographic, clinical, and medication information was obtained from patients' computerized medical records just before the exercise tolerance test. Each participant also was asked to verify the computerized information with regard to history of chronic disease, current medications, and cigarette smoking habits. Medications were not changed or stopped before testing. Body weight and height were recorded before the test. Body mass index was calculated as weight in kilograms divided by height in meters squared.
The exercise capacity of the participants at the Veterans Affairs Medical Center (Washington, DC) was assessed by the standard Bruce protocol.30 For participants at the Veterans Affairs Palo Alto Health Care System, an individualized ramp protocol was used, as described previously.31 Peak exercise time was recorded in minutes. Peak workload was estimated as metabolic equivalents (METs). One MET is defined as the energy expended at rest, which is equivalent to an oxygen consumption of 3.5 mL · kg-1 · min−1.32 Exercise capacity (in METs) was estimated on the basis of American College of Sports Medicine equations.32 Participants were encouraged to exercise until volitional fatigue in the absence of symptoms or other indicators of ischemia. Supine resting heart rate and blood pressure (BP) were assessed after 5 minutes of rest. Exercise BP was recorded every 2 minutes, at peak exercise, and during recovery. Indirect arm-cuff sphygmomanometry was used for all BP assessments. ST-segment depression was measured visually. ST depression of 1.0 mm or greater, horizontal or downsloping, was considered suggestive of ischemia.
Patients were classified according to 5 predetermined BMI groups: less than 18.5 (underweight), 18.5 to 24.9 (normal weight), 25.0 to 29.9 (overweight), 30.0 to 34.9 (obese I), and 35.0 or more (obese II or III). They were also classified according to 3 predetermined fitness groups: less than 5.0 (low), 5.0 to 10.0 (moderate), and more than 10.0 (high) METs. We used this approach to maintain consistency in our study methods and because a widely accepted clinical categorization of fitness does not exist. The normal-weight group (BMI, 18.5-24.9) and high-fitness group (>10.0 METs) were used as the reference groups. To evaluate the joint effects of BMI and fitness on mortality, we further classified patients within fitness strata according to BMI group.
Mortality Surveillance
We recorded death dates from the Veterans Affairs Beneficiary Identification and Record Locator System File. The Social Security Death Index was used to match all patients to their records according to Social Security number. Accuracy of deaths was reviewed by 2 clinicians blinded to exercise test results and was confirmed using the Veterans Affairs computerized medical records. Vital status was determined as of June 30, 2007.
Statistical Analyses
Continuous variables are presented as mean ± SD, and categorical variables as absolute and relative frequencies (percent). Descriptive statistics summarized baseline characteristics by BMI category.
Cox proportional hazards analyses were used to determine separate and combined associations of fitness and BMI with time to death. Continuous variables (age, BMI, and METs) were tested using analysis of variance, and categorical variables (fitness, BMI, and fitness-BMI groups) were tested using χ2 tests. We tested models for potential interactions of BMI and race, and BMI and fitness, with all-cause mortality.
Independent effects of fitness were examined by 1 proportional hazards model, adjusting for age in years, ethnicity, examination year, test site, CVD (history of myocardial infarction, angiographically documented coronary artery disease, coronary angioplasty, coronary bypass surgery, chronic heart failure, stroke, and/or peripheral arterial disease), CVD risk factors (hypertension, dyslipidemia, diabetes mellitus, and/or current smoking), CVD medications (aspirin, angiotensin-converting enzyme inhibitors, β-blockers, calcium channel blockers, vasodilators, and/or statins), and BMI (entered as a continuous variable). Independent effects of BMI were assessed using 2 proportional hazards models—first, adjusting for age, ethnicity, examination year, test site, CVD, CVD risk factors, and CVD medications; second, by adding fitness entered as a continuous variable. This second model was also used to assess independent effects of hypertension, diabetes, and current smoking (except CVD risk factors were mutually adjusted). Cox proportional hazards analyses were repeated after excluding current smokers and patients who died in the first 2 years of follow-up.
Follow-up was calculated from the date of a patient's baseline exercise test and examination until the date of death or June 30, 2007. Statistical tests were 2-sided, and values of P<.05 were considered statistically significant. All statistical analyses were performed using NCSS 2007 software (NCSS, Kaysville, UT).
RESULTS
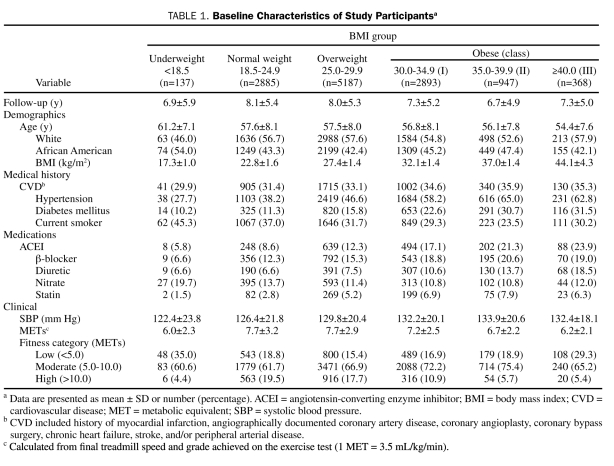
During a mean ± SD follow-up of 7.7±5.3 years (range, 0.08-22.92 years), 2801 deaths were recorded. Baseline characteristics grouped according to BMI category are presented in Table 1. The study population consisted of 6982 (56.2%) white and 5435 (43.8%) African American men who ranged in age from 40 to 70 years. There were 137 underweight patients (1.1%), 2885 normal-weight (23.2%), 5187 overweight (41.8%), and 4208 obese (33.9%) (2893 obese I [23.3%], 947 obese II [7.6%], and 368 obese III [3.0%]) patients. Median BMI was 28.0 (range, 13.2-65.6); ranges for quartiles 1 through 4 were 13.2 to 25.1, 25.2 to 27.9, 28.0 to 31.3, and 31.4 to 65.6, respectively. Testing of interaction models revealed a significant interaction between BMI and fitness (P=.001), but not BMI and race (P=.79).
TABLE 1.
Baseline Characteristics of Study Participantsa
Multivariate adjusted hazard ratio (HR) (95% confidence interval [CI]) for hypertension, diabetes mellitus, and current smoking was 1.1 (1.0-1.2), 1.3 (1.2-1.4), and 1.4 (1.3-1.5), respectively (data not shown).
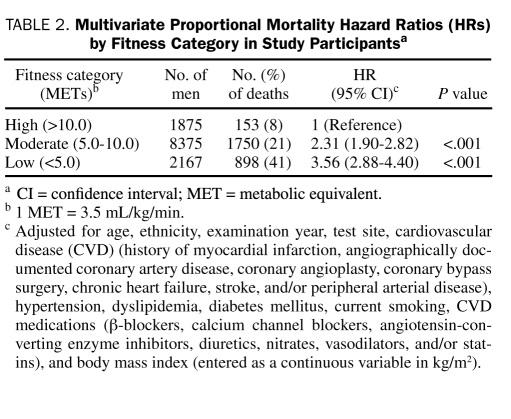
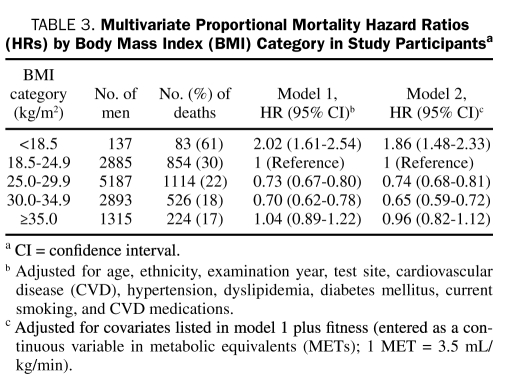
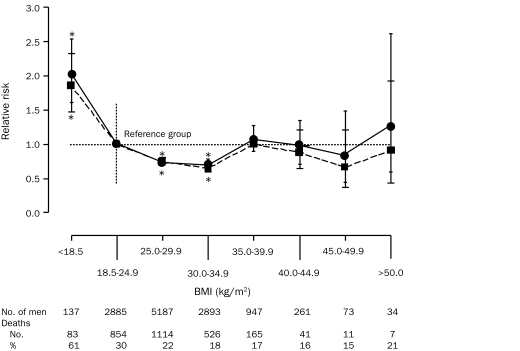
Multivariate BMI-adjusted HR (95% CI) for low and moderate fitness, compared with the high-fitness reference group, was 3.6 (2.9-4.4) and 2.3 (1.9-2.8), respectively (Table 2). Multivariate fitness-adjusted HR (95% CI) for all-cause mortality associated with BMI categories of underweight, normal weight, overweight, obese I, and obese II or III was 1.9 (1.5-2.3), 1.0 (reference), 0.7 (0.7-0.8), 0.7 (0.6-0.7), and 1.0 (0.8-1.1), respectively (Table 3). These analyses were repeated for nonsmokers, and no substantial differences were found when compared with the entire cohort. Body mass index mortality curves, extended further in 5-unit increments from 35.0 to 50.0 or greater, with and without adjustment for fitness, are presented in the Figure.
TABLE 2.
Multivariate Proportional Mortality Hazard Ratios (HRs) by Fitness Category in Study Participantsa
TABLE 3.
Multivariate Proportional Mortality Hazard Ratios (HRs) by Body Mass Index (BMI) Category in Study Participantsa
FIGURE.
Multivariate hazard ratios for all-cause mortality by body mass index (BMI), adjusted for age, ethnicity, examination year, test site, cardiovascular disease, diabetes, hypertension, dyslipidemia, smoking status, and cardiovascular disease medications (solid line), and with additional adjustment for fitness, entered as a continuous variable (dashed line). Error bars are 95% confidence intervals. Number of men and number and percentage of deaths are given below each BMI category. *Differs significantly from reference group (P<.001).
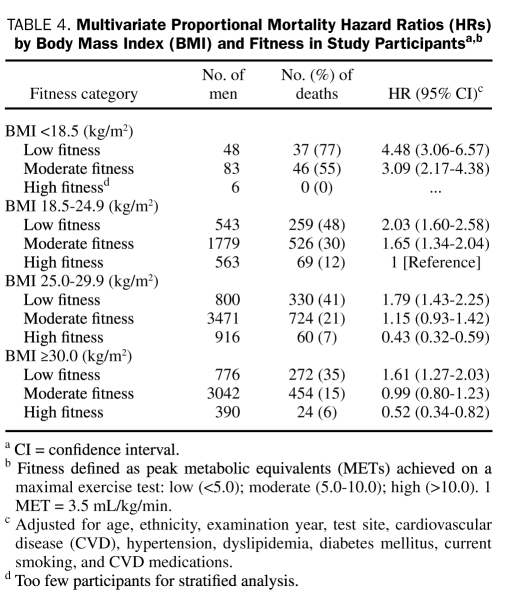
Results of the joint effects of fitness and BMI on all-cause mortality are presented in Table 4. Compared with findings for highly fit normal-weight men, adjusted HR (95% CI) for all-cause mortality was lower for highly fit overweight men (0.4 [0.3-0.6]) and highly fit obese men (0.5 [0.3-0.8]) and higher for the following groups: low-fitness underweight (4.5 [3.1-6.6]), moderately fit underweight (3.1 [2.2-4.4]), low-fitness normal-weight (2.0 [1.6-2.6]), moderately fit normal-weight (1.7 [1.3-2.0]), low-fitness overweight (1.8 [1.4-2.3]), and low-fitness obese (1.6 [1.3-2.0]). No significant differences were found for the moderately fit overweight (P=.19) and moderately fit obese (P=.96) groups compared with the reference group. Removing current smokers and patients who died during the first 2 years of follow-up from the analysis did not appreciably alter the results.
TABLE 4.
Multivariate Proportional Mortality Hazard Ratios (HRs) by Body Mass Index (BMI) and Fitness in Study Participantsa,b
DISCUSSION
In multivariate analyses, both fitness and BMI were independently and inversely associated with mortality risk. To ascertain whether low BMI resulted from undetected illness at baseline, we excluded all patients who died during the first 2 years of follow-up and current smokers, but this did not substantially change the primary findings. In joint analyses, elevated BMI generally reduced mortality risk within each fitness category, and higher levels of fitness decreased mortality risk within each BMI category. Highly fit overweight men (n=916) had the lowest mortality risk of any fitness-BMI combination and were 57% less likely to die (HR, 0.43 [95% CI, 0.32-0.59]) as highly fit normal-weight men. Fitness altered the obesity paradox in that overweight and obese men with low fitness were less likely to survive than normal-weight men with high fitness. However, an obesity paradox persisted within fitness group strata.
Our findings that BMI and fitness are inversely associated with all-cause mortality are consistent with earlier results from the VETS27 and extend them to joint analyses of fitness and BMI in a larger cohort of middle-aged men. Explanations for better survival with higher BMI in the current study include the following: (1) reverse causation in clinically referred patients,33 (2) increased coronary artery size,34 (3) the “veteran effect,”27 (4) healthy obesity,35 and (5) the survival effect.36
Several previous studies have reported an obesity paradox in specific patient populations.4-10 First, in patient populations similar to ours, Galal et al33 and Johnson et al37 found significantly lower mortality in overweight and obese patients with known or suspected coronary artery disease compared with patients with normal BMI; this finding was consistent with our results.
Second, greater coronary artery size among patients with higher BMI has been proposed as a possible mechanism for the obesity paradox.34 This may also be a factor in the favorable survival outcomes we observed among overweight and obese men in the current study of clinically referred patients, one third of whom had documented CVD.
Third, a related issue that might further explain our counterintuitive findings is the veteran effect, which we have previously noted.27 Veterans differ from other populations in that they all must meet selection criteria at the time of enlistment. These criteria include minimum height requirements and maximum weight requirements, which must be maintained for the duration of military service. Specifically, maximum allowable weights for different branches of the service correspond to BMI of 25.9 to 29.9 for men.38 Hence, obesity, when present in our population, must have developed after discharge from the service in later life. Some investigators have suggested that adult-onset obesity is less hazardous than obesity developing in childhood or adolescence.39 In addition, men qualifying for military service may have greater than average muscle mass. This might explain the inverse associations between BMI and mortality found in other self-selected populations with physical attributes similar to veterans, such as longshoremen.11
Fourth, in the larger population of obese adults, some experience good health. This is illustrated in some of the findings from the Framingham Heart Study.1 Participants who had a normal BMI at 40 years of age but developed obesity during 20 years of follow-up had no increased mortality risk. Moreover, in healthy obese mice, preferential storage of triglycerides in adipose tissue and reduced levels in the liver40 may result in improved insulin sensitivity, preventing diabetes and heart disease in such animals. A similar mechanism has been proposed for obese humans,41 and a metabolically benign form of obesity has been recently identified.35
Fifth, our findings may be explained in part by the well-known survival effect,36 which has particular relevance in epidemiological studies of older adults. Although our study patients were middle-aged, those in the upper range of this age group were possibly less susceptible to the negative effects of overweight.
Because objective measures of fitness (maximal exercise testing on a treadmill) are often unavailable, data on the joint effects of BMI and fitness on mortality are sparse. We know of 9 published studies that have specifically assessed the joint effects of fitness (as measured from standard exercise testing) and BMI on mortality.18-26 Two studies18,19 examined this issue by using data from the Lipid Research Clinics Study. All 7 of the remaining published studies used data from the Aerobics Center Longitudinal Study.20-26 Collectively, these studies demonstrated that fitness was a stronger predictor of mortality than BMI and that higher fitness eliminated the mortality risk of elevated BMI (the fat-but-fit hypothesis). Our results differ from these studies in that both high fitness and higher BMI independently reduced mortality risk. The effect of higher BMI on fitness in our cohort was that it generally reduced mortality risk across fitness categories. When highly fit patients were compared by BMI category, those who were overweight and obese experienced dramatic reductions in mortality risk (HR [95% CI], 0.43 [0.32-0.59] and 0.52 [0.34-0.82], respectively). However, only 916 overweight and 390 obese men registered high fitness at baseline, which represents only 7% and 3% of our cohort, respectively. Further study of individuals having this rare phenotype is needed to confirm our findings.
Our study has several strengths. First, all participants underwent an extensive physical examination, and detailed information on medication use was obtained, providing thorough information on the presence or absence of baseline disease. Second, fitness level was determined objectively by maximal exercise testing. Third, the study had a large sample size of more than 12,000 men and an average follow-up of nearly 8 years. Fourth, when smokers and patients who died during the first 2 years of follow-up were excluded, the results were not meaningfully altered.
Our study also has limitations. First, because waist circumference measures were not obtained, we were unable to evaluate body fat distribution characteristics. Second, we included only men who had prior military service and were referred for exercise testing for clinical reasons. Any effort to predict mortality by using fitness, BMI, or clinical or demographic data should be considered population-specific. Although most men were free of CVD, all patients were referred for exercise testing for clinical reasons. Third, fitness is a single measure that is influenced by many factors, including age, heredity, and recent and lifelong activity patterns.32,42 The extent of fitness improvement in adults, or the influence this may have on mortality, cannot be determined from the current investigation. Fourth, we had insufficient information about diet or physical activity patterns to study these factors. Fifth, because we have only baseline data on weight, exercise capacity, and other exposures, we do not know if changes in any of these variables occurred during follow-up and how this might have influenced the results.
CONCLUSION
Both higher BMI and higher fitness were protective for all-cause mortality in this cohort of white and African American middle-aged male veterans with known or suspected CVD. Fitness altered the obesity paradox such that overweight and obese men had increased longevity only if they registered high fitness. Future studies should focus on the influence of fitness and BMI on mortality in diverse populations and whether changes in fitness level and/or body weight affect health outcomes.
REFERENCES
- 1.Peeters A, Barendregt JJ, Willekens F, Mackenback JP, Mamun AA, Bonneux L, NEDCOM, Netherlands Epidemiology and Demography Compression of Morbidity Research Group Obesity in adulthood and its consequences for life expectancy: a life-table analysis. Ann Intern Med. 2003;138(1):24-32 [DOI] [PubMed] [Google Scholar]
- 2.Calle EE, Thun MJ, Petrelli JM, Rodriguez C, Heath CW., Jr Body-mass index and mortality in a prospective cohort of U.S. adults. N Engl J Med. 1999;341(15):1097-1105 [DOI] [PubMed] [Google Scholar]
- 3.Lee IM, Manson JE, Hennekens CH, Paffenbarger RS., Jr Body weight and mortality: a 27-year follow-up of middle-aged men. JAMA 1993;270(23):2823-2828 [DOI] [PubMed] [Google Scholar]
- 4.Oreopoulos A, Padwal R, Kalantar-Zadeh K, Fonarow GC, Norris CM, McAlister FA. Body mass index and mortality in heart failure: a meta-analysis. Am Heart J. 2008;156(1):13-22 [DOI] [PubMed] [Google Scholar]
- 5.Romero-Corral A, Montori VM, Somers VK, et al. Association of body-weight with total mortality and with cardiovascular events in coronary artery disease: a systematic review of cohort studies. Lancet 2006;368(9536):666-678 [DOI] [PubMed] [Google Scholar]
- 6.Buettner HJ, Mueller C, Gick M, et al. The impact of obesity on mortality in UA/non-ST-segment elevation myocardial infarction. Eur Heart J. 2007;28(14):1694-1701 [DOI] [PubMed] [Google Scholar]
- 7.Uretsky S, Messerli FH, Bangalore S, et al. Obesity paradox in patients with hypertension and coronary artery disease. Am J Med. 2007;120(10):863-870 [DOI] [PubMed] [Google Scholar]
- 8.Galal W, van Gestel YR, Hoeks SE, et al. The obesity paradox in patients with peripheral artery disease. Chest 2008;134(5):925-930 [DOI] [PubMed] [Google Scholar]
- 9.Khalangot M, Tronko M, Kravchenko V, Kulchinska J, Hu G. Body mass index and the risk of total and cardiovascular mortality among patients with type 2 diabetes: a large prospective study in Ukraine. Heart 2009;95(6):454-460 [DOI] [PubMed] [Google Scholar]
- 10.Schmidt D, Salahudeen A. The obesity-survival paradox in hemodialysis patients: why do overweight hemodialysis patients live longer? Nutr Clin Pract. 2007;22(1):11-15 [DOI] [PubMed] [Google Scholar]
- 11.Borhani NO, Hechter HH, Breslow L. Report of a ten-year follow-up study of the San Francisco longshoremen: mortality from coronary heart disease from all causes. J Chronic Dis. 1963December;16:1251-1266 [DOI] [PubMed] [Google Scholar]
- 12.Hanson RL, McCance DR, Jacobsson LT, et al. The U-shaped association between body mass index and mortality: relationship with weight gain in a Native American population. J Clin Epidemiol. 1995;48(7):903-916 [DOI] [PubMed] [Google Scholar]
- 13.Garn SM, Hawthorne VM, Pilkington JJ, Pesick SD. Fatness and mortality in the west of Scotland. Am J Clin Nutr. 1983;38(2):313-319 [DOI] [PubMed] [Google Scholar]
- 14.Hodge AM, Dowse GK, Collins VR, Zimmet PZ. Mortality in Micronesian Naurans and Melanesian and Indian Fijians is not associated with obesity. Am J Epidemiol. 1996;143(5):442-455 [DOI] [PubMed] [Google Scholar]
- 15.Kulminski AM, Arbeev KG, Kulminskaya IV, et al. Body mass index and nine-year mortality in disabled and nondisabled older U.S. individuals. J Am Geriatr Soc. 2008;56(1):105-110 [DOI] [PubMed] [Google Scholar]
- 16.Lavie CJ, Milani RV, Ventura HO. Obesity and cardiovascular disease: risk factor, paradox, and impact of weight loss. J Am Coll Cardiol. 2009;53(21):1925-1932 [DOI] [PubMed] [Google Scholar]
- 17.Lavie CJ, Milani RV, Artham SM, Petel DA, Ventura HO. The obesity paradox, weight loss, and coronary disease. Am J Med. 2009;122(12):1106-1114 [DOI] [PubMed] [Google Scholar]
- 18.Stevens J, Cai J, Evenson KR, Thomas R. Fitness and fatness as predictors of mortality from all causes and from cardiovascular disease in men and women in the Lipid Research Clinics Study. Am J Epidemiol. 2002;156(9):832-841 [DOI] [PubMed] [Google Scholar]
- 19.Stevens J, Evenson KR, Thomas O, Cai J, Thomas R. Associations of fitness and fatness with mortality in Russian and American men in the Lipids Research Clinics Study. Int J Obes Relat Disord. 2004;28(11):1463-1470 [DOI] [PubMed] [Google Scholar]
- 20.Blair SN, Kohl HW, III, Paffenbarger RS, Jr, Clark DG, Cooper KH, Gibbons LW. Physical fitness and all-cause mortality: a prospective study of healthy men and women. JAMA 1989;262(17):2395-2401 [DOI] [PubMed] [Google Scholar]
- 21.Barlow CE, Kohl HW, III, Gibbons LW, Blair SN. Physical fitness, mortality and obesity. Int J Obes Relat Metab Disord. 1995;19(suppl 4):S41-S44 [PubMed] [Google Scholar]
- 22.Farrell SW, Kampert JB, Kohl HW, III, et al. Influences of cardiorespiratory fitness levels and other predictors on cardiovascular disease mortality in men. Med Sci Sports Exerc. 1998;30(6):899-905 [DOI] [PubMed] [Google Scholar]
- 23.Lee CD, Blair SN, Jackson AS. Cardiorespiratory fitness, body composition, and all-cause and cardiovascular disease mortality in men. Am J Clin Nutr. 1999;69(3):373-380 [DOI] [PubMed] [Google Scholar]
- 24.Wei M, Kampert JB, Barlow CE, et al. Relationship between low cardiorespiratory fitness and mortality in normal-weight, overweight, and obese men. JAMA 1999;282(16):1547-1553 [DOI] [PubMed] [Google Scholar]
- 25.Sui X, LaMonte MJ, Laditka JN, et al. Cardiorepiratory fitness and adiposity as mortality predictors in older adults. JAMA 2007;298(21):2507-2516 [DOI] [PMC free article] [PubMed] [Google Scholar]
- 26.McAuley P, Sui X, Church TS, Hardin JW, Myers JN, Blair SN. The joint effects of cardiorespiratory fitness and adiposity on mortality risk in men with hypertension. Am J Hypertens. 2009;22(10):1062-1069 [DOI] [PubMed] [Google Scholar]
- 27.McAuley P, Myers J, Abella J, Froelicher V. Body mass, fitness and survival in veteran patients: another obesity paradox? Am J Med. 2007;120(6):518-524 [DOI] [PubMed] [Google Scholar]
- 28.Stevens J, Cai J, Pamuk ER, Williamson DF, Thun MJ, Wood JL. The effect of age on the association between body-mass index and mortality. N Engl J Med. 1998;338(1):1-7 [DOI] [PubMed] [Google Scholar]
- 29.Kokkinos P, Myers J, Kokkinos JP, et al. Exercise capacity and mortality in black and white men. Circulation 2008;117(5):614-622 [DOI] [PubMed] [Google Scholar]
- 30.Bruce RA. Exercise testing of patients with coronary heart disease: principles and normal standards for evaluation. Ann Clin Res. 1971;3(6):323-332 [PubMed] [Google Scholar]
- 31.Myers J, Buchanan N, Walsh D, et al. Comparison of the ramp versus standard exercise protocols. J Am Coll Cardiol. 1991;17(6):1334-1342 [DOI] [PubMed] [Google Scholar]
- 32.American College of Sports Medicine ACSM's Guidelines for Exercise Testing and Prescription 8th ed.Baltimore, MD: Lippincott Williams & Wilkins; 2009. [Google Scholar]
- 33.Galal W, van Domburg RT, Feringa HH, et al. Relation of body mass index to outcome in patients with known or suspected coronary artery disease. Am J Cardiol. 2007;99(11):1485-1490 [DOI] [PubMed] [Google Scholar]
- 34.Gruberg L, Mercado N, Milo S, et al. Arterial Revascularization Therapies Study Investigators Impact of body mass index on the outcome of patients with multivessel disease randomized to either coronary artery bypass grafting or stenting in the ARTS Trial: the obesity paradox II? Am J Cardiol. 2005;95(4):439-444 [DOI] [PubMed] [Google Scholar]
- 35.Steffan N, Kantartzis K, Machann J, et al. Identification and characterization of metabolically benign obesity in humans. Arch Intern Med. 2008;168(15):1609-1616 [DOI] [PubMed] [Google Scholar]
- 36.Zamboni M, Mazzali G, Zoico E, et al. Health consequences of obesity in the elderly: a review of four unresolved questions. Int J Obes. (Lond) 2005;29(9):1011-1029 [DOI] [PubMed] [Google Scholar]
- 37.Johnson NP, Wu E, Bonow RO, Holly TA. Relation of exercise capacity and body mass index to mortality in patients with intermediate to high risk of coronary artery disease. Am J Cardiol. 2008;102(8):1028-1033 [DOI] [PubMed] [Google Scholar]
- 38.Nolte R, Franckowiak SC, Crespo CJ, Andersen RE. U.S. military weight standards: what percentage of U.S. young adults meet the current standards? Am J Med. 2002;113(6):486-490 [DOI] [PubMed] [Google Scholar]
- 39.Boreham C, Twisk J, Murray L, et al. Fitness, fatness, and coronary heart disease risk in adolescents: the Northern Ireland Young Hearts Project. Med Sci Sports Exerc. 2001;33(2):270-274 [DOI] [PubMed] [Google Scholar]
- 40.Kim JY, van de Wall E, Laplante M, et al. Obesity-associated improvements in metabolic profile through expansion of adipose tissue. J Clin Invest. 2007;117(9):2621-2637 [DOI] [PMC free article] [PubMed] [Google Scholar]
- 41.Abernathy RP, Black DR. Is adipose tissue oversold as a health risk? J Am Diet Assoc. 1994;94(6):641-644 [DOI] [PubMed] [Google Scholar]
- 42.Mandic S, Myers JN, Oliveira RB, Abella JP, Froelicher VF. Characterizing differences in mortality at the low end of the fitness spectrum. Med Sci Sports Exerc. 2009;41(8):1573-1579 [DOI] [PubMed] [Google Scholar]


