Abstract
OBJECTIVE: To evaluate the effects of prescription omega-3-acid ethyl esters on non—high-density lipoprotein cholesterol (HDL-C) levels in atorvastatin-treated patients with elevated non—HDL-C and triglyceride levels.
PATIENTS AND METHODS: This study, conducted between February 15, 2007, and October 22, 2007, randomized patients with elevated non—HDL-C (>160 mg/dL) and triglyceride (≥250 mg/dL and ≤599 mg/dL) levels to double-blind treatment with prescription omega-3-acid ethyl esters, 4 g/d, or placebo for 16 weeks. Patients also received escalating dosages of open-label atorvastatin (weeks 0-8, 10 mg/d; weeks 9-12, 20 mg/d; weeks 13-16, 40 mg/d).
RESULTS: Prescription omega-3-acid ethyl esters plus atorvastatin, 10, 20, and 40 mg/d, reduced median non—HDL-C levels by 40.2% vs 33.7% (P<.001), 46.9% vs 39.0% (P<.001), and 50.4% vs 46.3% (P<.001) compared with placebo plus the same doses of atorvastatin at the end of 8, 12, and 16 weeks, respectively. Prescription omega-3-acid ethyl esters plus atorvastatin also reduced median total cholesterol, triglyceride, and very low-density lipoprotein cholesterol levels and increased HDL-C levels to a significantly greater extent than placebo plus atorvastatin. Percent changes from baseline low-density lipoprotein-cholesterol, apolipoprotein A-I, and apolipoprotein B levels were not significantly different between groups at the end of the study.
CONCLUSION: Prescription omega-3-acid ethyl esters plus atorvastatin produced significant improvements in non—HDL-C and other lipid parameters in patients with elevated non—HDL-C and triglyceride levels.
Prescription omega-3-acid ethyl esters plus atorvastatin produced significant improvements in non—high-density lipoprotein cholesterol and other lipid parameters in patients with elevated levels of non—high-density lipoprotein cholesterol and triglycerides.
ANOVA = analysis of variance; apo = apolipoprotein; CHD = coronary heart disease; HDL-C = high-density lipoprotein cholesterol; LDL-C = low-density lipoprotein cholesterol; P-OM3 = prescription omega-3-acid ethyl esters; TC = total cholesterol; VLDL = very low-density lipoprotein; VLDL-C = VLDL-cholesterol
For patients with triglyceride levels lower than 500 mg/dL (to convert to mmol/L, divide by 88.6), the National Cholesterol Education Program, Adult Treatment Panel III recommends lowering low-density lipoprotein cholesterol (LDL-C) levels as the primary lipid treatment target, with the target LDL-C value being based on risk of atherosclerotic coronary heart disease (CHD).4 If triglyceride levels remain elevated (≥200 mg/dL) after achieving LDL-C treatment goals, then the secondary treatment target is to achieve the non—high-density lipoprotein cholesterol (HDL-C) goal, which is defined as 30 mg/dL (to convert to mmol/L, divide by 38.7) above the LDL-C treatment goal. Increasingly, non—HDL-C is identified by guidelines4 and recommendations5 as an important treatment target because it represents the sum of cholesterol carried by potentially atherogenic apolipoprotein (apo) B—containing lipoproteins, beyond LDL-C alone.6-8 A meta-analysis of 14 statin trials suggests that, for every 1% reduction in non—HDL-C, the relative CHD risk is reduced by approximately 1%.9
Unfortunately, a substantial proportion of patients with elevated non—HDL-C and triglyceride levels do not achieve non—HDL-C level goals despite the use of statins.10,11 In NEPTUNE II (National Cholesterol Education Program Evaluation ProjecT Utilizing Novel E-Technology) study, 61% of patients with hypertriglyceridemia (triglyceride level ≥200 mg/dL) achieved their LDL-C treatment goal, whereas only 39% achieved their non—HDL-C goal. Among the subset with hypertriglyceridemia and CHD or CHD-risk equivalents, 52% achieved their LDL-C goal, whereas 27% achieved their non—HDL-C goal. Part of the challenge in achieving the non—HDL-C goal is that statins have less robust effects on triglyceride levels relative to their reductions in LDL-C levels11 and thus may not optimally reduce the cholesterol level carried by triglyceride-rich lipoproteins, such as very low-density lipoproteins (VLDLs), intermediate-density lipoproteins, and chylomicrons. Options that enable patients with elevated non—HDL-C and triglyceride levels to better achieve their non—HDL-C targets include increasing the statin dose or adding other lipid-altering therapies to statins, which may produce complementary lipid-altering effects.
Prescription omega-3-acid ethyl esters (P-OM3; Lovaza; GlaxoSmithKline, Research Triangle Park, NC) contain highly concentrated omega-3-acid ethyl esters (eg, eicosapentaenoic acid and docosahexaenoic acid) and are indicated for the treatment of adult patients with very high triglyceride (≥500 mg/dL) levels. Prior studies indicate that the use of P-OM3 often reduces non—HDL-C levels in hypertriglyceridemic patients treated with a statin.12-16 The objectives of this randomized, double-blind, placebo-controlled, multicenter study were to evaluate the effects of combining P-OM3 with atorvastatin on non—HDL-C levels and other lipid parameters in patients with combined hyperlipidemia and to compare the effects of adding P-OM3 to those of increasing the atorvastatin dose.
PATIENTS AND METHODS
Men and women were eligible to participate in the study if they were between the ages of 18 and 79 years, medically stable, and, in the judgment of the investigators, otherwise acceptable for entry on the basis of the findings of medical history, physical examination, electrocardiography, and routine laboratory tests. Lipid entry criteria required a non—HDL-C level greater than 160 mg/dL and a triglyceride level between 250 and 599 mg/dL at the end of a diet lead-in period. Women of childbearing potential were required to use an acceptable form of contraception.
Major exclusion criteria included the use of nonstudy lipid-altering therapy (eg, statins, bile acid sequestrants, cholesterol absorption inhibitors, or fibrates), marine oil—based omega-3 fatty acid or fish oil supplements, or niacin (or its analogues) at dosages greater than 400 mg/d after the first study visit; known allergy or sensitivity to statins or omega-3 fatty acids; symptoms of unexplained muscle pain, tenderness, or weakness within 2 months before the study; or history of myopathy or rhabdomyolysis.
Study Design and Conduct
This 20-week, randomized, multicenter, double-blind, placebo-controlled, parallel-group study was conducted at 37 clinical sites in the United States between February 15, 2007, and October 22, 2007. The protocol was approved by the institutional review board of each study site, and the study was conducted under the guidelines of Good Clinical Practice. After giving written informed consent, eligible patients withheld all lipid-altering agents after the first (screening) visit and entered a 4-week lead-in period. Patients were counseled on the National Cholesterol Education Program therapeutic lifestyle changes diet throughout the study.
Eligible patients were then randomized to receive double-blind treatment with either P-OM3 at 4 g/d (465 mg of eicosapentaenoic acid and 375 mg of docosahexaenoic acid per 1-g capsule) or matching placebo capsules (containing corn oil), each with open-label atorvastatin at 10 mg/d. After the initial 8 weeks of treatment with double-blind drug and atorvastatin at 10 mg/d, use of the double-blind medications was continued and the atorvastatin dosage was escalated to 20 mg/d for the next 4 weeks and to 40 mg/d for the final 4 weeks of this 16-week treatment period.
End Points
The primary efficacy end point was the percent change in non—HDL-C level between baseline and week 8 (end of treatment with atorvastatin at 10 mg/d). The baseline value was calculated as the mean of 2 fasting measurements obtained during the last 2 weeks of the 4-week, diet run-in phase. The value for the end of the 10-mg atorvastatin treatment period was calculated as the mean of the fasting values at week 7 and week 8 of active treatment.
Secondary end points included the percent changes in non—HDL-C level between baseline and the end of treatment with atorvastatin at 20 mg/d (ie, the mean of week 11 and week 12 values) and between baseline and the end of treatment with atorvastatin at 40 mg/d (ie, the mean of week 15 and week 16 values). Other secondary end points included changes or percent changes from baseline in total cholesterol (TC), HDL-C, LDL-C, very low-density lipoprotein cholesterol (VLDL-C), triglyceride, and apo A-I and apo B concentrations. Safety assessments occurred at each visit and included adverse events, clinical laboratory parameters, and vital signs.
Statistical Analyses
The primary efficacy analyses were completed on a modified intention-to-treat population, which comprised all randomized patients who received at least 1 dose of the study drug and provided at least 1 postrandomization blood sample. All randomized patients who received at least 1 dose of study medication were included in the population used for safety analyses.
Analyses were completed with the SAS statistical package for the personal computer, version 9.1.3 (SAS Institute Inc, Cary, NC). Missing values were handled using the last observation carried forward method. No values were carried forward across dose escalation periods. Responses in the 2 treatment groups for the initial 8-week treatment period were compared by analysis of variance (ANOVA). Each ANOVA model included terms for treatment group and baseline triglyceride stratum (<400 or ≥400 mg/dL). The Shapiro-Wilk test was used to test the normality of the residuals from the ANOVA models. If the normality hypothesis was rejected at an α level of .05, the ANOVA model was run on rank-transformed values. Responses for most response variables were not normally distributed. Accordingly, median values for response variables are reported throughout as the measure of central tendency. Sensitivity analyses run to assess possible treatment-by-center interactions showed no significant treatment-by-center interactions.
Repeated-measures ANOVA models were used to compare responses between treatment groups. Each model included terms for the treatment group, triglyceride stratum, treatment period, and treatment group—by—treatment period interaction as independent variables and percent change as the dependent variable.
RESULTS
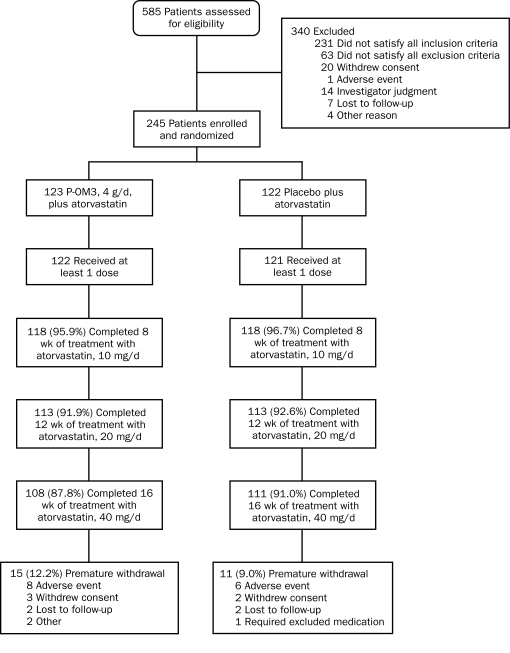
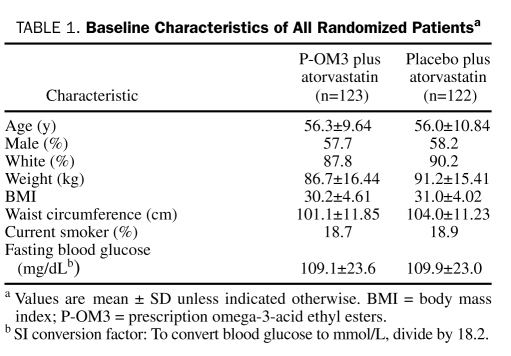
A total of 585 patients were screened for eligibility, with 245 patients (41.9%) being randomized (123 to P-OM3 plus atorvastatin and 122 to placebo plus atorvastatin) and 219 (89.4%) completing 16 weeks of study treatment. Disposition of patients is shown in Figure 1. Baseline characteristics of randomized patients (Table 1) revealed no statistically significant differences between the 2 groups. The mean age of study participants was 56 years, and most randomized patients were men (142/245 [58.0%]) and white (218/245 [89.0%]).
FIGURE 1.
Flow of patients through the trial. P-OM3 = prescription omega-3-acid ethyl esters.
TABLE 1.
Baseline Characteristics of All Randomized Patientsa
Efficacy
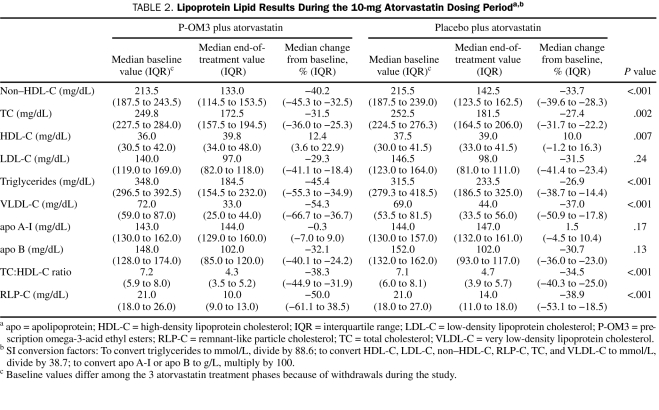
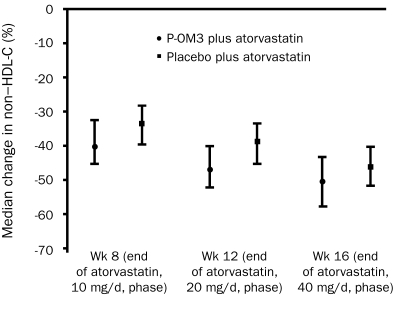
The baseline median non—HDL-C level was 213.5 mg/dL (interquartile range, 187.5-243.5 mg/dL) in recipients of P-OM3 plus atorvastatin and 215.5 mg/dL (interquartile range, 187.5-239.0 mg/dL) in recipients of placebo plus atorvastatin in the modified intention-to-treat population (Table 2). At the end of the 10-mg atorvastatin phase, the median change from baseline non—HDL-C level was −40.2% in patients treated with P-OM3 plus atorvastatin and −33.7% in patients treated with placebo plus atorvastatin (difference, −6.5%; 90% confidence interval, −7.2% to −2.9%; P<.001) (Figure 2). In addition, P-OM3 reduced non—HDL-C levels compared with placebo during the 20-mg/d atorvastatin and 40-mg/d atorvastatin phases (Figure 2), and the difference in median change from baseline in non—HDL-C level between treatment groups remained statistically significant. In a post hoc analysis, the proportions of patients who achieved predefined LDL-C targets (ie, <160 mg/dL, <130 mg/dL, or <100 mg/dL; to convert to mmol/L, divide by 38.7) at the end of study treatment were 85.7% (90/105) in the P-OM3 plus atorvastatin group vs 91.5% (97/106) in the placebo plus atorvastatin group (P=.20). The proportions of patients who achieved predefined non—HDL-C targets (ie, <190 mg/dL, <160 mg/dL, or <130 mg/dL) at the same time point were 88.7% (94/106) for those receiving P-OM3 plus atorvastatin and 87.8% (94/107) for those receiving placebo plus atorvastatin (P>.99).
TABLE 2.
Lipoprotein Lipid Results During the 10-mg Atorvastatin Dosing Perioda,b
FIGURE 2.
Median change from baseline in non—high-density lipoprotein cholesterol (HDL-C) levels (modified intention-to-treat population). Error bars represent interquartile ranges. The difference between medians was −6.5% (90% confidence interval [CI], −7.2% to −2.9%; P<.001) at week 8, −7.9% (90% CI, −9.1% to −4.9%; P<.001) at week 12, and −4.1% (90% CI, −6.8% to −2.4%; P<.001) at week 16. P-OM3 = prescription omega-3-acid ethyl esters.
Other Lipid and Lipoprotein Parameters
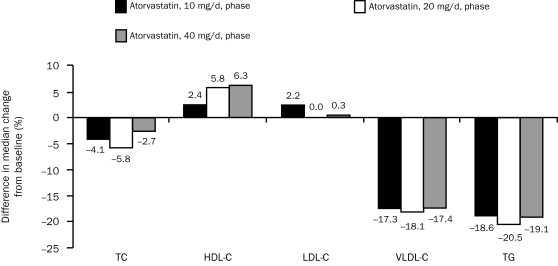
Prescription omega-3-acid ethyl esters plus atorvastatin, 10, 20, and 40 mg/d, also produced consistent and statistically significant reductions in median TC (P-OM3 at 4 g/d plus atorvastatin at 10 mg/d, 20 mg/d, or 40 mg/d, all P<.001), TC:HDL-C ratio (all P<.001), triglycerides (all P<.001), VLDL-C (all P<.001), and remnant-like particle cholesterol (all P<.001) levels vs treatment with the respective dose of atorvastatin alone (Table 2 and Figure 3). The median percent increase from baseline in HDL-C level also was greater with P-OM3 plus atorvastatin vs atorvastatin alone at all 3 atorvastatin doses (P-OM3 at 4 g/d plus atorvastatin at 10 mg/d, P=.001; P-OM3 at 4 g/d plus atorvastatin at 20 mg/d and at 40 mg/d, P<.001 vs placebo) (Table 2 and Figure 3). The median percent change from baseline in LDL-C, apo A-I, or apo B levels was not significantly different between the 2 treatment groups (Table 2), except for a greater reduction in apo B in the P-OM3 plus atorvastatin group during the 20-mg atorvastatin phase (−36.8% vs −33.6% for a treatment difference of 3.2%; P=.005). A post hoc analysis found no consistent association between baseline LDL-C tertile (61-126 mg/dL, 128-158 mg/dL, and 159-268 mg/dL) and LDL-C or apo B responses between the 2 treatment groups.
FIGURE 3.
Difference in median change from baseline in lipoprotein lipid parameters between prescription omega-3-acid ethyl esters (P-OM3) and placebo, when given in combination with atorvastatin, 10, 20, and 40 mg/d. P values are calculated for the difference in the median percentage change from baseline between P-OM3 and placebo. P values were <.001 for total cholesterol (TC); <.001 for high-density lipoprotein cholesterol (HDL-C); 0.24, 0.86, and 0.64 for low-density lipoprotein cholesterol (LDL-C) during the 10-mg, 20-mg, and 40-mg phases, respectively; and <.001 for very low-density lipoprotein cholesterol (VLDL-C) and triglycerides (TG).
Safety
This study revealed no clinically meaningful differences between treatment groups in general adverse events, treatment-related adverse events, adverse events leading to withdrawal, or treatment-related adverse events leading to withdrawal. During the 16-week treatment period, 8 patients (6.5%) who received P-OM3 plus atorvastatin and 6 patients (4.9%) who received placebo plus atorvastatin discontinued treatment because of an adverse event. Two patients treated with P-OM3 plus atorvastatin and 3 patients treated with placebo plus atorvastatin were withdrawn from treatment because of events that were considered to be treatment related, defined as possibly, probably, or definitely due to study drugs.
One patient in each treatment group had 1 or more alanine aminotransferase values greater than 3 times the upper limit of normal, and 3 patients in each treatment group had 1 or more creatine kinase values greater than 3 times the upper limit of normal. None of the patients with elevations in alanine aminotransferase or creatine kinase had values that surpassed the level of 5 times the upper limit of normal.
Overall, both groups had slight increases in blood glucose and hemoglobin A1c values during the study. At week 16, mean ± SD changes from baseline in fasting blood glucose level were 6.18±24.29 mg/dL (to convert to mmol/L, divide by 18.2) in the P-OM3 and atorvastatin group vs 4.39±18.67 mg/dL in the placebo plus atorvastatin group. Increases in hemoglobin A1c were 0.18%±0.45% vs 0.10%±0.33%, respectively. Serious adverse events occurred in less than 5% of patients in both treatment groups, and none were considered treatment related, defined as having been judged to be possibly, probably, or definitely due to study drugs.
DISCUSSION
In this study, coadministration of P-OM3, 4 g/d, with atorvastatin, 10 to 40 mg/d, lowered non—HDL-C levels to a significantly greater extent than the same dose of atorvastatin alone in patients with elevated triglyceride and non—HDL-C levels. The effects of adding P-OM3 to either 10 or 20 mg/d of atorvastatin were comparable to that of doubling the atorvastatin dose in lowering non—HDL-C levels.
Combining P-OM3, 4 g/d, with atorvastatin also reduced median TC, triglyceride, and VLDL-C levels and increased HDL-C levels to a significantly greater extent than the same dose of atorvastatin alone. Lipoprotein parameters that were not significantly changed by the coadministration of P-OM3 and atorvastatin (vs atorvastatin alone) were LDL-C, apo A-I, and apo B levels.
In the COMBOS (COMBination of prescription Omega-3 with Simvastatin) study,12 addition of P-OM3 to ongoing simvastatin therapy slightly blunted the LDL-C—lowering effect (vs baseline) among those who continued to receive simvastatin monotherapy; however, the treatment effect was not statistically significant (P=.052). In the current study, a different design was used in which P-OM3 was coadministered with atorvastatin at randomization, which significantly reduced the LDL-C level vs baseline in both groups (P-OM3 plus atorvastatin and atorvastatin alone). Although the magnitude of LDL-C lowering was numerically greater with atorvastatin alone, the difference was not statistically significant (P=.24). This finding is consistent with results from a previous clinical trial with a similar (ie, coadministration) study design.16
From a safety and tolerability standpoint, the coadministration of P-OM3, 4 g/d, with atorvastatin was generally well tolerated. Although mild glucose elevations were observed in this trial, this finding is consistent with those from other randomized clinical trials involving omega-3 fatty acid administration.17,18 Otherwise, no unexpected tolerability or safety concerns were found in this study.
The triglyceride-lowering properties of omega-3 fatty acids are well known; however, the mechanisms through which this effect is achieved are not completely understood.19 One potential mechanism involves increased degradation of fatty acids in the liver (through enhancing β-oxidation), which decreases the amount of substrate available for triglyceride synthesis and incorporation into VLDL particles.20 Omega-3 fatty acids may also lower triglyceride levels by enhancing triglyceride clearance from circulating VLDL particles through increased lipoprotein lipase activity.21 This may be mediated through a reduction in apo CIII, which inhibits lipoprotein lipase activity.22 Other proposed mechanisms to explain the triglyceride-lowering effects of omega-3 fatty acids include decreased activity of phosphatidic acid phosphatase/phosphohydrolase and diacylglycerol acyltransferase23—2 key enzymes involved in triglyceride synthesis—and decreased lipogenesis through a reduction in enzymatic conversion of acetyl coenzyme A to fatty acids.24 However, not all evidence consistently supports these latter mechanisms.19 Non—HDL-C levels appear to be reduced because of decreased VLDL synthesis and secretion and through increased conversion to intermediate-density lipoprotein and low-density lipoprotein, which result from enhanced activity of lipoprotein lipase.19
The current study provides clinically relevant information for treating patients with elevated non—HDL-C levels and reflects the relative merits of coadministering another lipid-altering drug with a complementary mechanism of action to a statin vs simply doubling the statin dose. An advantage of increasing the statin dose is that statins are generally well tolerated and have been proven to reduce CHD events, as evidenced by numerous CHD outcomes trials. However, a potential disadvantage of increasing the statin dose is that statin-related adverse events typically occur at higher statin doses, particularly in older, chronically ill patients treated with multiple medications.25 The risk-to-benefit ratio associated with increasing the statin dose is an important consideration, given that doubling the statin dose typically results in only a modest incremental reduction in LDL-C and non—HDL-C levels (approximately 6%).4,26 This consideration is substantiated by the current trial in which increasing the atorvastatin dosage from 10 to 20 mg/d resulted in further lowering of the median non—HDL-C level by 5.3% and by 7.3% when the atorvastatin dosage was increased from 20 to 40 mg/d. Finally, although increasing the statin dose may further reduce LDL-C levels (accounting for most of its non—HDL-C—lowering effects), it may have only a modest effect on other lipid parameters that potentially influence CHD risk, such as triglyceride, VLDL-C, and remnant-like particle cholesterol levels.6,27 Again, this is substantiated by the current study, which demonstrated that increasing the atorvastatin dosage from 10 to 20 mg/d resulted in further lowering of median triglyceride levels by only 3.8% and by only 4.1% when the atorvastatin dose was increased from 20 to 40 mg/d, whereas these same parameters were improved to a greater extent in the P-OM3 group.
CONCLUSION
Coadministration of P-OM3 with 10 to 40 mg of atorvastatin significantly reduced non—HDL-C levels compared to the same dose of atorvastatin alone in patients with elevated non—HDL-C and triglyceride levels. In addition, P-OM3 improved other lipid parameters. Generally, P-OM3 added to atorvastatin was well tolerated at all atorvastatin doses. Coadministration of P-OM3 with statin therapy may be a rational treatment approach for improving non—HDL-C levels and other lipid parameters in patients with elevated non—HDL-C and triglyceride levels.
Acknowledgments
We acknowledge the following individuals for their contributions to the draft development and critical review of the submitted manuscript: Rose Snipes, MD; Amy Meadowcroft, PharmD; Rosemary Schroyer, MS; and Doug Wicks, MPH.
Footnotes
Manuscript writing and editing support by Kevin Jarvis, PharmD, from BioCentric, inc, was funded by GlaxoSmithKline. Funding for this study was provided by GlaxoSmithKline, Research Triangle Park, NC (NCT00435045).
REFERENCES
- 1.Bays HE, McKenney J, Doyle RT, Carter RN, Stein E. Effect of prescription omega-3 fatty acids coadministered with escalating doses of atorvastatin in patients with hypertriglyceridemia [abstract 5150]. Circulation 2008;118:S1152 [Google Scholar]
- 2.Bays HE, McKenney J, Doyle RT, Carter RN, Stein E. Prescription omega-3s coadministered with atorvastatin for patients with hypertriglyceridemia Encore poster presented at: American Association of Diabetes Educators 2009 Annual Meeting; August5-8, 2009, Atlanta, GA [Google Scholar]
- 3.Bays HE, McKenney J, Doyle RT, Carter RN, Stein E. Effect of prescription omega-3 fatty acids coadministered with escalating doses of atorvastatin on non-HDL-C in patients with hypertriglyceridemia Encore poster presented at: American College of Clinical Pharmacy Annual Meeting 2009, Anaheim, CA, October18-21, 2009 [Google Scholar]
- 4.National Cholesterol Education Program (NCEP) Expert Panel on Detection, Evaluation, and Treatment of High Blood Cholesterol in Adults (Adult Treatment Panel III) Third report of the National Cholesterol Education Program (NCEP) Expert Panel on detection, evaluation, and treatment of high blood cholesterol in adults (Adult Treatment Panel III) final report. Circulation 2002;106(25):3143-3421 [PubMed] [Google Scholar]
- 5.Brunzell JD, Davidson M, Furberg CD, et al. Lipoprotein management in patients with cardiometabolic risk: consensus conference report from the American Diabetes Association and the American College of Cardiology Foundation. J Am Coll Cardiol. 2008;51(15):1512-1524 [DOI] [PubMed] [Google Scholar]
- 6.Bays HE, Tighe AP, Sadovsky R, Davidson MH. Prescription omega-3 fatty acids and their lipid effects: physiologic mechanisms of action and clinical implications. Expert Rev Cardiovasc Ther. 2008;6(3):391-409 [DOI] [PubMed] [Google Scholar]
- 7.Gotto AM, Jr, Whitney E, Stein EA, et al. Relation between baseline and on-treatment lipid parameters and first acute major coronary events in the Air Force/Texas Coronary Atherosclerosis Prevention Study (AFCAPS/Tex-CAPS). Circulation 2000;101(5):477-484 [DOI] [PubMed] [Google Scholar]
- 8.Kastelein JJ, van der Steeg WA, Holme I, et al. TNT Study Group. IDEAL Study Group Lipids, apolipoproteins, and their ratios in relation to cardiovascular events with statin treatment. Circulation 2008;117(23):3002-3009 [DOI] [PubMed] [Google Scholar]
- 9.Robinson JG, Wang S, Smith BJ, Jacobson TA. Meta-analysis of the relationship between non-high-density lipoprotein cholesterol reduction and coronary heart disease risk. J Am Coll Cardiol. 2009;53(4):316-322 [DOI] [PubMed] [Google Scholar]
- 10.U. S. Department of Health and Human Services. National Institutes of Health. National Heart, Lung, and Blood Institute Your Guide to Lowering Cholesterol With TLC: Therapeutic Lifestyle Changes Bethesda, MD: National Institute of Health Publication No. 06-5235; December2005. http://www.nhlbi.nih.gov/health/public/heart/chol/chol_tlc.pdf Accessed November 6, 2009 [Google Scholar]
- 11.Davidson MH, Maki KC, Pearson TA, et al. Results of the National Cholesterol Education (NCEP) Program Evaluation ProjecT Utilizing Novel E-Technology (NEPTUNE) II survey and implications for treatment under the recent NCEP Writing Group recommendations. Am J Cardiol. 2005;96(4):556-563 [DOI] [PubMed] [Google Scholar]
- 12.Davidson MH, Stein EA, Bays HE, et al. Efficacy and tolerability of adding prescription omega-3 fatty acids 4 g/d to simvastatin 40 mg/d in hypertriglyceridemic patients: an 8-week, randomized, double-blind, placebo-controlled study. Clin Ther. 2007;29(7):1354-1367 [DOI] [PubMed] [Google Scholar]
- 13.Nordøy A, Bønaa KH, Nilsen H, Berge RK, Hansen JB, Ingebretsen OC. Effects of simvastatin and omega-3 fatty acids on plasma lipoproteins and lipid peroxidation in patients with combined hyperlipidaemia. J Intern Med. 1998;243(2):163-170 [DOI] [PubMed] [Google Scholar]
- 14.Durrington PN, Bhatnagar D, Mackness MI, et al. An omega-3 polyun-saturated fatty acid concentrate administered for one year decreased triglycerides in simvastatin treated patients with coronary heart disease and persisting hypertriglyceridaemia. Heart 2001;85(5):544-548 [DOI] [PMC free article] [PubMed] [Google Scholar]
- 15.Chan DC, Watts GF, Nguyen MN, Barrett PH. Factorial study of the effect of n-3 fatty acid supplementation and atorvastatin on the kinetics of HDL apolipoproteins A-I and A-II in men with abdominal obesity. Am J Clin Nutr. 2006;84(1):37-43 [DOI] [PubMed] [Google Scholar]
- 16.Maki KC, McKenney JM, Reeves MS, Lubin BC, Dicklin MR. Effects of adding prescription omega-3 acid ethyl esters to simvastatin (20 mg/day) on lipids and lipoprotein particles in men and women with mixed dyslipidemia [published correction appears in am J Cardiol. 2008;102(10):1425] Am J Cardiol. 2008;102(4):429-433 [DOI] [PubMed] [Google Scholar]
- 17.Hartweg J, Farmer AJ, Holman RR, Neil A. Potential impact of omega-3 treatment on cardiovascular disease in type 2 diabetes. Curr Opin Lipidol. 2009;20(1):30-38 [DOI] [PubMed] [Google Scholar]
- 18.Balk E, Chung M, Lichtenstein A, et al. Effects of omega-3 fatty acids on cardiovascular risk factors and intermediate markers of cardiovascular disease Evidence report/technology assessment no 93 (Prepared by Tufts-New England Medical Center Evidence-based Practice Center under Contract No. 290-02-0022). AHRQ publication no 04-E010-2 Rockville, Md: Agency for Healthcare Research and Quality; 2004. http://www.ncbi.nlm.nih.gov/book-shelf/br.fcgi?book=hserta&part=A136037 Accessed November 6, 2009 [PMC free article] [PubMed] [Google Scholar]
- 19.Bays HE, Tighe AP, Sadovsky R, Davidson MH. Prescription omega-3 fatty acids and their lipid effects: physiologic mechanisms of action and clinical implications. Expert Rev Cardiovasc Ther. 2008;6(3):391-409 [DOI] [PubMed] [Google Scholar]
- 20.Davidson MH. Mechanisms for the hypotriglyceridemic effect of marine omega-3 fatty acids. Am J Cardiol. 2006;98(4A):27i-33i [DOI] [PubMed] [Google Scholar]
- 21.Khan S, Minihane AM, Talmud PJ, et al. Dietary long-chain n-3 PUFAs increase LPL gene expression in adipose tissue of subjects with an atherogenic lipoprotein phenotype. J Lipid Res. 2002;43(6):979-985 [PubMed] [Google Scholar]
- 22.Davidson MH, Maki KC, Bays HE, Bays H, Carter R, Ballantyne CM. Effects of prescription omega-3-acid ethyl esters on lipoprotein particle concentrations, apolipoproteins AI and CIII, and lipoprotein associated phospholipase A2 mass in statin-treated subjects with hypertriglyceridemia. J Clin Lipidol. 2009;3(5):442-340 [DOI] [PubMed] [Google Scholar]
- 23.Harris WS, Bulchandani D. Why do omega-3 fatty acids lower serum triglycerides? Curr Opin Lipidol. 2006;17(4):387-393 [DOI] [PubMed] [Google Scholar]
- 24.Zaima N, Sugawara T, Goto D, Hirata T. Trans geometric isomers of EPA decrease LXRα-induced cellular triacylglycerol via suppression of SREBP-1c and PGC-1β. J Lipid Res. 2006;47(12):2712-2717 [DOI] [PubMed] [Google Scholar]
- 25.Bays H. Statin safety: an overview and assessment of the data--2005. Am J Cardiol. 2006;97(8A):6C-26C [DOI] [PubMed] [Google Scholar]
- 26.Isaacsohn J, Hunninghake D, Schrott H, et al. Effects of simvastatin, an HMG-CoA reductase inhibitor, in patients with hypertriglyceridemia. Clin Cardiol. 2003;26(1):18-24 [DOI] [PMC free article] [PubMed] [Google Scholar]
- 27.Bays H. Rationale for prescription omega-3-acid ethyl ester therapy for hypertriglyceridemia: a primer for clinicians. Drugs Today (Barc) 2008;44(3):205-246 [DOI] [PubMed] [Google Scholar]


