Abstract
One of the most, basic trade-offs in ultrasound imaging involves frame rate, depth, and number of lines. Achieving good spatial resolution and coverage requires a large number of lines, leading to decreases in frame rate. An even more serious imaging challenge occurs with imaging modes involving spatial compounding and 3-D/4-D imaging, which are severely limited by the slow speed of sound in tissue. The present work can overcome these traditional limitations, making ultrasound imaging many-fold faster. By emitting several beams at once, and by separating the resulting overlapped signals through spatial and temporal processing, spatial resolution and/or coverage can be increased by many-fold while leaving frame rates unaffected. The proposed approach can also be extended to imaging strategies that do not involve transmit beamforming, such as synthetic aperture imaging. Simulated and experimental results are presented where imaging speed is improved by up to 32-fold, with little impact on image quality. Object complexity has little impact on the method’s performance, and data from biological systems can readily be handled. The present work may open the door to novel multiplexed and/or multidimensional protocols considered impractical today.
I. Introduction
Ultrasound imaging is a low-cost, safe, and mobile imaging modality, which explains in part its widespread use in clinical radiology. Safety is one of its major strengths, because it does not involve ionizing radiations. Although ultrasound imaging may seem very rapid, generating images as fast as the human eye can see them, image quality has to be compromised for sufficiently high frame rates to be achieved. The present work proposes an approach to speed up the image acquisition process in ultrasound imaging by potentially many-fold, to enable improvements in image quality. This proposed approach is referred to here as the separation of paths with element encoding and decoding (SPEED) method.
To achieve sufficiently high frame rates (or volume rates in 3-D/4-D imaging), essentially every other imaging parameter must typically be, to some extent, sacrificed. Parameters such as the number of lines per image and the maximum depth, for example, must be adjusted in consequence. Other more subtle sacrifices may also be necessary, in the sense that more elaborate types of scans may be considered impractical if they negatively affect frame rates. Yet these scans might become feasible and useful if combined with faster imaging techniques. Although frame rates are already arguably sufficient in diagnostic ultrasound, faster imaging would nevertheless be extremely valuable, not necessarily to reach higher frame rates, but rather to obtain more elaborate images while keeping frame rates unchanged. A current solution to this issue, called explososcanning, involves transmitting a broad beam and forming multiple receive beams within the envelope formed by the transmit beam [1]. Typically, 4 such receive beams are used today with a trend toward 16:1, and even up to 64:1 (e.g., see [2]). Difficulties associated with this approach include crosstalk among beams and the modulation of the receive beam by the transmit envelope, and consequences include loss of spatial and contrast resolution, and deviation of the acoustic ray path from the intended straight line (“beam wander”). Alternately, one could transmit several beams essentially simultaneously in different directions [3]–[8] or even probe the entire object using a plane wave [9], [10]. In these cases also, crosstalk between receive beams remains an issue. Synthetic aperture imaging [11], [12] is another fast-imaging approach, capable of generating an image after every transmit event. It involves firing a single actual (or virtual [13]) element of a transducer array while receiving signal from all elements. Although extremely fast, synthetic aperture imaging is adversely affected by low SNR and high artifact content. Insightful modifications have been proposed to partly alleviate these problems, such as extending the acquisition over more than one transmit event [14] and using simultaneously transmitted coded excitations that can be discriminated at the reconstruction stage [15]–[20].
Our proposed fast-imaging approach includes both a spatial strategy based on the fact that all elements of a phased-array transducer “see” the object differently at the receive stage and a temporal strategy based on temporal modulations of signals at the emit stage. The spatial strategy is, in principle, compatible with any transmit scheme, whether wide beam [1], multibeam [3]–[8], or plane wave [9], [10]. The temporal scheme, however, appears to be compatible only with a multibeam approach. For this reason, a multibeam transmit scheme is presented as the preferred option for the present work, because both our proposed spatial and temporal strategies are combined for improved performance. Accordingly, instead of sending one focused ultrasound beam at a time to probe the object in a single direction, we propose sending several beams at once; the overlapped signals from different beams are then separated at the reconstruction stage, using our proposed spatial and temporal strategies.
Our proposed spatial strategy is inspired from multireceiver technologies that have been developed in the field of magnetic resonance imaging (MRI) under the name of parallel imaging [21], [22] and in the field of wireless communications under the name of multiple-input multiple-output (MIMO) [23]. Although ingenious work has been presented to make ultrasound transmissions from different elements and/or beams more orthogonal to each other in function space, in the present work, the image reconstruction process is replaced instead by a matrix inversion that does not require orthogonality. For example, the coded-excitation method by Shen and Ebbini [8] involves carefully selecting distinct excitation waveforms for different beams to allow separation of signals. In contrast, the present approach uses the same excitation waveform for all beams. As a consequence, our proposed spatial strategy should be compatible with essentially any excitation waveform and any transmit scheme (e.g., wide beam, multibeam, or plane wave). On the other hand, our proposed temporal strategy is inspired from our work in the field of MRI, which we called unaliasing by Fourier-encoding the overlaps in the temporal dimension (UNFOLD) [24]. The overlapped signals from different simultaneous beams can be separated by modulating, from time frame to time frame, the phase of some of these beams, forcing their associated signals to behave in a conspicuous way along the time axis. Once a given signal gets labeled with an unusual temporal modulation, it can be identified and isolated through temporal processing. Existing temporal encoding strategies have involved changing the transmitted waveform from one transmit event to the next, within one image acquisition [14]. In contrast, it is performed here through changes in the transmitted waveform from image to image, in a time series of images. For example, with τ the time required for acquiring data from one encoding scheme, alternating between 2 different transmission schemes with our approach would lead to a temporal resolution of about 1.1 ×τ. This is significantly different from previous strategies where all encoding schemes would be acquired for every image, which in this example would lead to a lower temporal resolution of 2 × τ. Because our proposed temporal strategy requires changes in the polarity of the excitation waveform from time frame to time frame, it appears to be compatible only with a multibeam approach (and not with a wide-beam or plane-wave transmission scheme).
Accelerated imaging can, for example, enable high-speed 3-D imaging of dynamic structures such as cardiac valves. To acquire a conventional 3-D data set with 100 by 100 acoustic lines to the depth of 15 cm requires 2 s. Being able to speed this up by a factor of 32 allows a very respectable volume update rate of 16 volumes per second. Other modes that may gain dramatically from the proposed approach include compound imaging with multiple transmit focal locations. This mode improves lesion detectability by suppressing speckle and emphasizing perpendicular interfaces at the expense of frame rate. It may also enable the acquisition of more elaborate, multiplexed, and/or multidimensional images. Ultrasound imaging has the valuable ability to capture motion, flow, and perfusion in real time, but as scans become increasingly rich information-wise, difficult compromises have to be made on spatial resolution and/or frame rates. By increasing the acquisition speed, the SPEED method may allow multiplexed and/or multidimensional scans to be performed, while preserving spatial and temporal resolution.
II. Methods
A. Accelerated Acquisition Scheme
A normal, nonaccelerated ultrasound image acquisition process is depicted in Fig. 1 for comparison purposes. Four snapshots are displayed for a given beam. The simulation software package that we developed to generate such images will be described in the Results section. The beam is shown shortly after it was emitted from the transducer, Fig. 1(a); just before it hit the object, Fig. 1(b); shortly after being scattered by the object, Fig. 1(c); and after the scattered signal had time to propagate away from the object, Fig. 1(d).
Fig. 1.
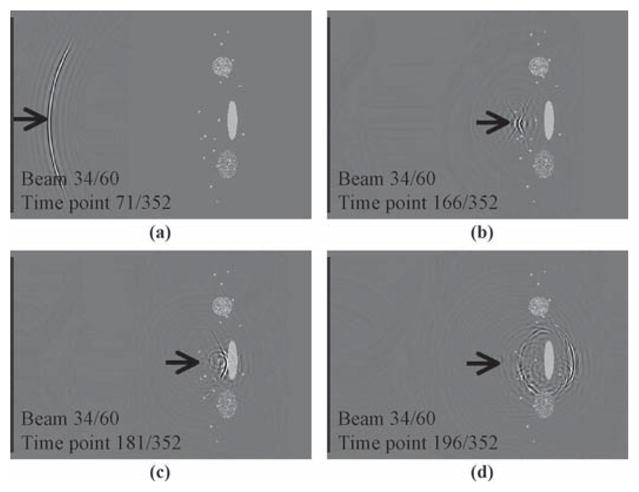
The propagation and scattering of a given beam, #34 out of 60, are captured here in several snapshots. The object, shown in gray, consists of several small scatterers, one homogeneous oval shape, and 2 inhomogeneous ones. The beam is shown (a) shortly after emission, (b) shortly before impact, (c) shortly after impact, and (d) after the scattered wave traveled away from the object.
Accelerated ultrasound image acquisitions are depicted in Fig. 2. To speed up the acquisition process by a factor of n, we propose sending out n different beams together in a single shot. The resulting acquisition scheme is depicted in Fig. 2 for n = 2, 4, and 6. For example, with n = 2, only (Nl/2) shots are required to acquire all of the Nl lines that form a given image, allowing images to be acquired twice as fast as normal. Similarly, only (Nl/4) or (Nl/6) shots are required with an acceleration factor of 4 or 6, respectively.
Fig. 2.
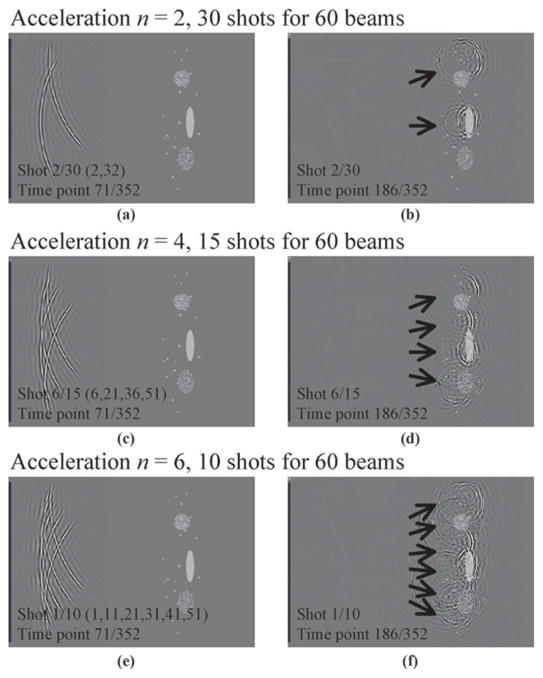
For faster imaging, we sent several beams at a time. Examples are shown for n = 2, 4, and 6, shortly after the beams were emitted (a, c, and e) and shortly after they impacted with the object, near their focus point (b, d, and f). Although sending n simultaneous beams allows images to be acquired n times faster, it also leads to a complicated scattered field, as seen in (f), for example. Sections II-B and II-C explain how this signal can be reconstructed into images.
By sending out several beams simultaneously, the scattered fields from all of these beams overlap, leading to more complicated signals being measured by the transducer. Although firing several simultaneous beams is in principle straightforward, making sense of the resulting signal is more difficult. The following sections describe our image reconstruction algorithm based on spatial (Section B), and also temporal (Section C) considerations. These algorithms aim at separating the signals associated with different beams, despite the fact that they were emitted simultaneously.
B. Reconstruction, with Element-Encoding/Decoding
1) Description of Vectors s and o
Consider a vector s, which contains all of the signal data points measured by the transducer array following the emission of a given shot. If Nt time points were sampled by each one of Ne transducer elements, the vector s contains Nt × Ne elements. It consists of Nt modules pasted one after the other, where each module contains the data measured by all Ne elements at a given time point. The vector o, which contains one entry for each object voxel being probed during a given shot, may be shorter than s. With Nax image voxels in the axial direction, and n beams per shot, o contains n × Nax elements. It consists of n modules pasted one after the other, each module containing all Nax voxels along a given beam. The object voxels and the measured signal are related through the encoding matrix E, which converts an imaged object into an ultrasound signal:
| (1) |
where ξ represents digitized random noise. The signal s, the sonicated locations o, and the encoding matrix E are all specific to one transmit event and change from one transmit event to the next.
2) Description of Encoding Matrix E and Decoding Matrix D
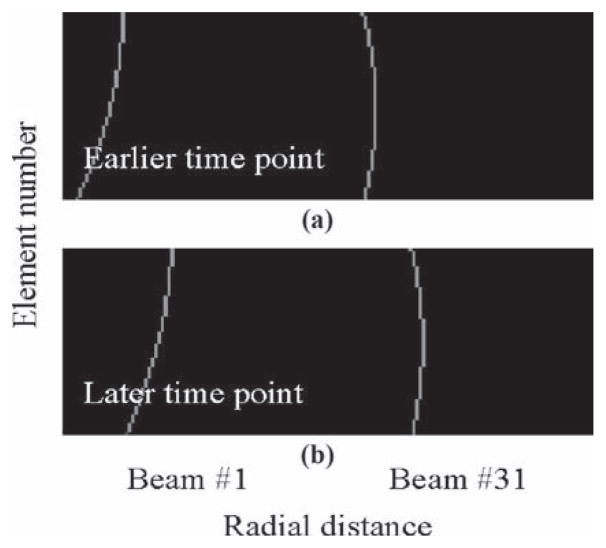
The encoding matrix E is an elongated, vertical matrix featuring Nt × Ne rows and n × Nax columns. The matrix E can be thought of as Nt modules, each one Ne by n x Nax in size, pasted vertically one over the other. Two of these modules are shown in Fig. 3. For n = 2, shot #1 features both beam number 1 and beam number (Nl/2), emitted together; see Fig. 3(a). Because beam #1 tends to remain closest to element #1 as it propagates, a signal from this element at any given time point comes from deeper within the object than that received by other elements, leading to the shape seen in the left part of Fig. 3. Beam number (Nl/2) on the other hand propagates nearly perpendicularly to the transducer face, so elements in the middle of the array receive deeper signals, leading to the curved shape seen on the right side of Fig. 3. Later time points correspond to deeper positions, and accordingly, Fig. 3(b) resembles a shifted version of Fig. 3(a), shifted toward higher axial distances. Magnitude variations can be included in these curves to account for the fact that signals from deeper locations are more attenuated. When included, such magnitude variations are calculated using a typical attenuation value, e.g., 0.3 dB/cm/MHz (not included in Fig. 3). In the present work, whether or not such magnitude variations were included in the makeup of E proved to have little impact on the results. The shape of the curves in Fig. 3, rather than magnitude variations along these curves, carries most of the spatial-encoding information. By inverting the encoding matrix E, one obtains the decoding matrix D used to reconstruct ô, an estimate of the scatter strength at the spatial locations found along the insonified beams:
| (2) |
Fig. 3.
Two representative sections of a matrix E are shown, each one Ne by n × Nax in size, with n = 2. (a) Element #1, at the top, is closest to beam #1. Accordingly, the signal associated with beam #1 and captured by element #1 comes from deeper within the object, i.e., from a higher radial distance, than for other elements. In contrast, beam #31, sent along with beam #1 in the same transmit event, is closest to the middle of the array. Information regarding beam #31, a matrix Ne by in Nax size, is pasted next to that of element #1. (b) For a later time point, signals associated with both beams tend to come from deeper within the object. The matrix E. which is Nt × Ne by n × Nax in size, consists of Nt sections such as the 2 displayed in (a) and (b).
3) D is Independent of the Imaged Anatomy
It is worth noting that the matrix E, and thus its inverse D, does not depend on the imaged object. E depends only on the geometry of the transducer and on imaging parameters such as the number of lines, the angle range covered by these lines, and the imaging depth. For a given transducer, one could in principle build a repository of inverse matrices associated with commonly used imaging parameters and simply load the relevant ones for a given scan. This is in sharp contrast with parallel MR imaging, where the encoding matrix is so dependent on the imaged object that a separate calibration scan is typically performed. The need to invert matrices while the patient is in the MR scanner and while the user is waiting may well influence the choice of numerical solvers, because processing speed may get valued enough to justify compromises on accuracy. In contrast, the ability to perform inversions once and for all, independently of the imaged anatomy, might prove to be a key feature of the present approach.
4) Numerical Solution
Solving (2) using a regularized least-squares approach produces the expression
| (3) |
where the superscript H represents a Hermitian transpose, λ2L is a damped least-squares regularization term, and EHΨ−1 is a system preconditioning term. Regularization suppresses the noise amplification that may occur when the system defined by E is poorly conditioned, while preconditioning is used to manipulate the spectrum of E to reduce the system condition number and/or produce a more computationally tractable problem. For example, when Ψ−1 is square and complex conjugate symmetric, then EHΨ−1E is also square and complex conjugate symmetric. Such methods have been widely used in parallel MRI [22], [25]–[28] to good effect. In the present work, Ψ and L are simply identity matrices, although in future work prior knowledge about noise correlation and/or object signal might in principle be included into these matrices. It should be noted that equations such as (3), i.e., regularized least-square solutions, have been used in a wide range of applications and problems. Eq. (3) becomes relevant to the problem of accelerated ultrasound imaging when the matrices involved, especially E, are built as described above. In the present problem, E features information from distinct but overlapped beams (Fig. 3), and (3) is used to separate these beams. As described above, E does not feature any information about, for example, possible spatial variations in sound speed. Accordingly, in the present work, (3) cannot be expected to correct for associated distortions and aberrations. The goal here is to obtain clinical images faster, not necessarily to correct artifacts found in clinical images. For an acceleration n = 1, (2) and (3) lead to results essentially identical to receive beamforming. For accelerations n > 1, however, with matrix E built as described above, (2) and (3) are not equivalent to receive beamforming and explososcanning [1], as demonstrated in the Results section and explained below.
5) Geometrical Analogy
A geometrical analogy is offered to help explain how the algorithm from (1)–(3) offers advantages over currently available approaches. Imagine we would like to express a vector s⃗ = s1i⃗ + s2j⃗ in a reference system defined by and . This can be done through projections, using a dot product: s⃗ = Σl(s⃗· u→l)u→l. Projections are appropriate in this case because the basis vectors u→l form an orthonormal set: u→l · u→k = δlk. In contrast, when expressing s⃗ in a reference frame defined by and υ→2 = i⃗, projections would not be appropriate. Instead, the coefficients in s⃗ = sαυ→1 + sβυ →2 can be obtained by solving:
| (4) |
A receive-beamforming reconstruction, when performed digitally rather than through hardware, involves taking the acquired signal in a transducer-element vs. time space, called e-t space here—e.g., Fig. 4(a)—and multiplying it by an arc associated with one pixel location in the reconstructed image—e.g., Fig. 4(b) for a shallower location and Fig. 4(c) for a deeper location. The reconstruction process is entirely analogous to a change of reference system using projections. Imagine the entire signal in Fig. 4(a) as a vector in a multidimensional space, where the value at each point in Fig. 4(a) gives the coefficient for one basis vector (like s1 and s2 in the example above). This multidimensional function space features as many dimensions as there are points in the e-t plane. The signal as represented in a first frame of reference (where coefficients form the e-t plane) is converted to a second frame of reference (where coefficients form an image plane, before envelope detection and Cartesian gridding). Each spatial location corresponds to an arc in e-t space, just like each vector υ→l had a representation in terms of i⃗ and j⃗ in the example above. A receive-beamforming reconstruction is equivalent to projections: Each dimension (i.e., point) of the signal vector, as shown in Fig. 4(a), gets multiplied by its corresponding value from a basis vector, e.g., Fig. 4(b), and a sum is performed over all dimensions, i.e., the whole e-t plane. When there is just one receive beam per transmit event, it can be shown that all υ→l arcs have no overlap with each other in e-t space and thus form an orthogonal set. For accelerated imaging, with several receive beams per transmit event, arcs overlap and do not form an orthonormal set; e.g., the arcs in Figs. 4(c) and (d) occupy common locations in e-t space, and thus are not expected to be orthogonal to each other. When reconstructing several receive beams per transmit event, because the resulting arcs do not generally form an orthonormal set, the solution from (1)–(3) is expected to be more accurate than receive beamforming. This argument remains valid in principle for any transmit scheme, whether using wide beams [1], multibeams [3]–[8], or plane waves [9], [10].
Fig. 4.
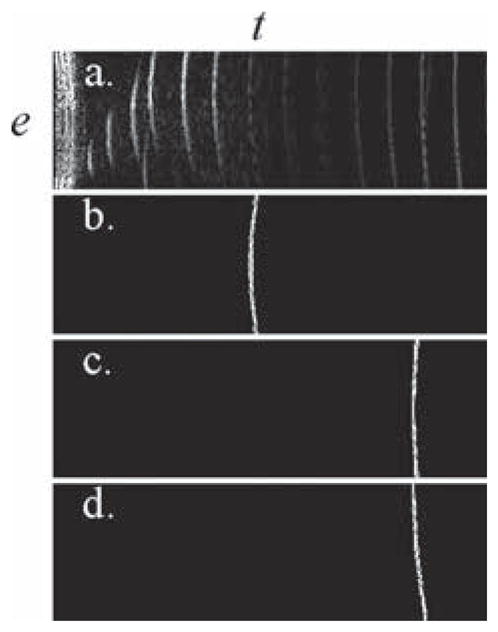
(a) The received signal belongs to an e-t space, where e represents the transducer element number and t represents time. (b) The signal from a given spatial location corresponds to an arc in e-t space. (c) Such an arc becomes shallower and translated along the time axis for locations deeper within the object. Arcs that correspond to different receive beams may overlap, such as those shown in (c) and (d).
6) On Calculating E
The coefficients that form E are identical to those used in a (digital) receive beamforming reconstruction, e.g., the arcs shown in Figs. 4(b)–(d). This can be understood from the example above and (4), where the matrix to invert is made of coefficients from υ→l and υ→2, which could alternately have been used in dot-product projections. Accordingly, E depends only on geometry, the speed of sound, and attenuation effects. Coefficients are however organized differently in E than in Figs. 4(b)–(d). While Figs. 4(b)–(d) represent an e-t space for a given spatial location (r,φ), each E module shown in Fig. 3 represent an e-r space at a given t and φ. In the special case where n = 1, the reconstruction scheme from (1)–(3) becomes equivalent to receive beamforming.
It should be noted that the forward transform, modeled through (1), is performed by the imaging system itself. The corresponding inverse transform, from (2), may prove accurate only if the matrix E is accurately known. To achieve higher acceleration factors, increasingly accurate representations of E may be required, including any further information available about the imaging process itself. For example, the actual voltage waveform used when firing the elements and the frequency response of these elements could be included into the makeup of E, at the cost of decreased sparsity and increased processing time. Although at low acceleration factors small errors in E may lead to small errors in the reconstructed images, at higher acceleration factors small errors in E may more readily get amplified and lead to large errors in the reconstructed images, hence a need for greater accuracy on E at higher acceleration factors.
C. Further Including Temporal Encoding/Decoding
In addition to the spatial element-encoding scheme described above, a temporal encoding scheme is also proposed. Fig. 5 depicts the proposed modified acquisition scheme for n = 2 (a)–(d) and n = 6 (e)–(h). As a time series of images is acquired at a typical rate of about 20 frames per second, the beam generation process gets modified from frame to frame. If we define “fast time” as the time along the depth dimension and “slow time” as the time from pulse to pulse, the present encoding scheme functions along a “very slow time” axis, defined here as the time between images. Figs. 5(a) and (b) show a case similar to that described in Figs. 2(a) and (b), whereby 2 beams are sent simultaneously. But as shown in Figs. 5(c) and (d), when the same shot is sent again as part of acquiring the next time frame, one of the beams is sent inverted. Indeed, close comparison of the indicated region of interest (ROI) in Fig. 5(d) with the equivalent location in Fig. 5(b) reveals that every bright crest has become dark, and vice versa. Similarly, for n = 6, every second beam gets inverted every second frame, as can be noted by comparing Figs. 5(f) and (h). This strategy is very analogous to our previous work in fast MRI, whereby aliasing artifacts are time-modulated to make them easily identifiable and removable [24], [29], [30]. A time series of images I(x, y, z, t) is reconstructed as follows from an acquired ultrasound data set Dm(s, r, t), where m refers to the transducer-element number, s to the shot number and r to the radial dimension:
| (5) |
where C{} is a scan converter operator that performs envelope detection followed by Cartesian gridding; On is an operator that separates n overlapped beams in the manner described above, i.e., multiplies the signal assembled in a s vector with a D matrix as shown in (2); l is the number of overlapped beams sharing the same temporal modulation scheme and is equal to either floor(n/2) or ceil(n/2), depending on the particular beam being processed; F−DC,Ny is an operator that removes regions around the DC and Nyquist temporal frequencies; and Fo is an operator that selects only a frequency band either around Ny or DC, depending on whether the particular beam being processed is Nyquist-modulated or not, respectively.
Fig. 5.
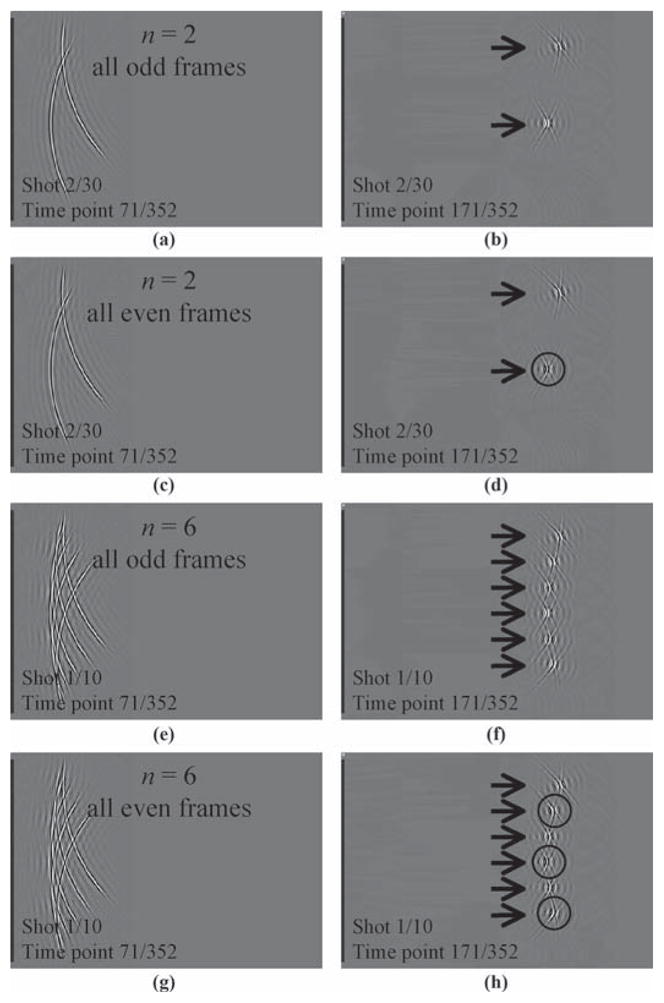
The present approach involves sending n beams together, as shown for n = 2 in (a)–(d) and n = 6 in (e)–(h). As several time frames are acquired, a different acquisition process is used for even and odd frames. For every even time frame, every even beam in a given shot is inverted. Comparing the circular region of interest (ROI) in (d) to the same region in (b), and the ROIs in (h) to corresponding locations in (f), it can be noted that all bright crests have been inverted into dark ones, and vice versa. This change in the acquisition process greatly simplifies the task of separating overlapped signals from overlapped beams.
When n beams are overlapped, any failure to separate them using a spatial operator On{} will cause artifacts. Forcing some of the beams to reverse phase every second frame, i.e., to impose a Nyquist modulation to some of the beams, can help discriminate the signal associated with these beams from that associated with other, nonmodulated beams. The general idea can be understood in the temporal frequency domain, as overlapped signal components are modulated and moved toward higher frequencies, creating regions, shaded in Fig. 6, where the overlap problem is less serious, and where an operator Ol{} with l ≈ n/2 can be used instead of On{}. Placing these better-behaved regions near temporal DC and Nyquist, where most of the signal energy is expected, can greatly simplify the task of separating all components involved while generating as few artifacts as possible [31]–[33]. The price to pay is a slight reduction in temporal resolution, due to the loss of a narrow frequency band around Nyquist. Using filters with full-width-half-maxima equal to 10% of the full bandwidth, and with τ the time to acquire one time frame, temporal resolution is thus reduced from a value of τ to a value of about 1.1 × τ.
Fig. 6.
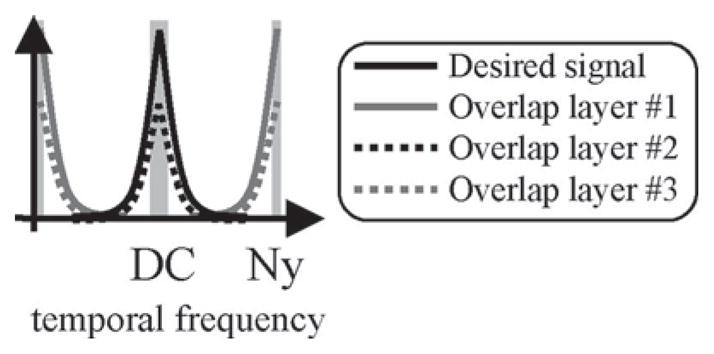
By moving half of the components at Nyquist, regions with lower levels of overlap, shown shaded, are created. These shaded regions are expected to contain most of the energy in the bandwidth.
D. On Generalizing the SPEED Method
Up to this point, the transmitted ultrasound energy has been assumed to travel along well-defined beams. Accordingly, the number of insonified locations per transmit event has been limited to only n × Nax voxels, allowing the reconstruction of all Nl × Nax voxels to be broken into Nl/n independent and smaller problems. In principle, transmit events that reach all object locations could also be considered. The encoding and the decoding matrices would then become considerably larger in the process, as they would relate all Nl × Nax reconstructed image locations into a single solution. Doing so would lift the assumption that the ultrasound energy is confined to narrow beams, but the price to pay would be larger E matrices with possibly poorer conditioning, and longer processing times.
Using the present approach along with a usual transmit beamforming scheme seemed a reasonable first step, because it keeps processing requirements at a manageable level and allows more direct comparisons with clinical scanners, because they also use transmit beamforming. On the other hand, the strategies introduced here should presumably prove compatible with several of the ingenious transmit-based encoding schemes developed mostly in the context of synthetic aperture imaging [13]–[20]. As future work, the possibility of combining our work to these existing methods for added speed and performance appears promising.
III. Results
A. Simulation Based on an In Vivo Image
1) Simulation Results
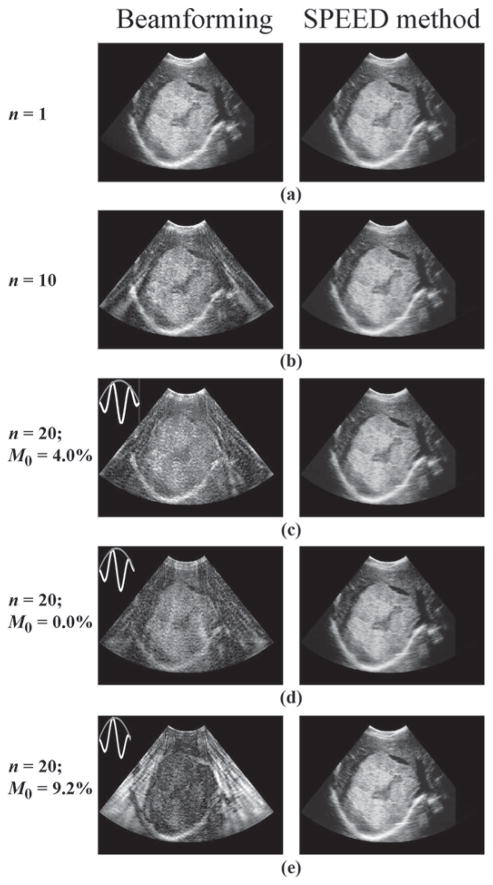
A clinical liver image showing a large hemangioma with cystic degeneration was interpolated along 120 beams, and nearly 3500 points per beam. These data in polar coordinates were used to evaluate the object-vector o in (1), which was then multiplied by E to synthesize the raw RF signal s. By compounding data from different beams, a vector sn was obtained that corresponds to the signal that would have been acquired using an acceleration factor of n. The signals from such accelerated acquisitions were then reconstructed through (2) and (3), and results can be compared with the nonaccelerated case (Fig. 7). It should be noted that accelerated results reconstructed using receive beamforming (Fig. 7, beam-forming column) are corrupted by artifacts, while those reconstructed using the present approach are essentially identical to the nonaccelerated case. The present simulation represents an ideal scenario for the SPEED method, because the matrix E is perfectly known. For this reason, the results in Fig. 7 are not intended as a realistic test of the acceleration limits of the proposed approach, but rather as a demonstration that complex objects can be readily handled by the method.
Fig. 7.
A clinical liver image showing a large hemangioma with cystic degeneration was sampled along 120 different beams to translate the object to polar coordinates. The raw RF data were then simulated through (1), and data from different beams were combined to simulate acceleration factors of 1, 10, and 20. The resulting data sets were reconstructed using receive beamforming and the proposed spatial-encoding approach of (2), (3), and (5). Although accelerated results obtained with a beam-forming reconstruction featured artifacts, results from the proposed approach were essentially artifact-free. The quality of beamforming results was found to depend greatly on the waveform used for the transmitted waveform, and the n = 20 results were repeated for waveforms featuring slightly different envelopes. A normalized version of the zeroth moment, M0 = |∫w(t)dt|/∫|w(t)|dt with w(t) the transmitted waveform, was used to characterize the waveforms. The quality of images obtained with a receive beamforming reconstruction tended to decrease with increasing values of M0. A main purpose of this simulation was to demonstrate that neither object complexity nor M0 adversely affects the proposed algorithm.
2) Beamforming’s Uneven Performance
Unlike the approach proposed here, the performance of receive beam-forming was found to vary greatly depending on the precise shape of the emitted waveform. As a rule of thumb, receive beamforming performed better for longer waveforms featuring many oscillations and/or for waveforms of vanishing zeroth moment. The zeroth moment is simply a measure of the mean value of a pulse, defined here as M0 = |∫w(t)dt|/∫|w(t)|dt, with w(t) the transmitted waveform. This latter point is illustrated in Fig. 7, where pulses with zeroth moments of 4.0%, 0.0%, and 9.2% were used, and image quality decreased with increasing zeroth moment. Pulses with nonzero zeroth moment arise naturally in the presence of damping, because negative lobes and positive lobes may not exactly cancel out each other when damped differently.
3) Proposed Method Handles Complex Objects
A main purpose of this simulation was to demonstrate that object complexity does not in itself cause difficulties to the present algorithm. The main factors that can challenge the present approach are inconsistencies between E in (1) and the encoding performed by the actual imaging system, poor conditioning of E, and system noise. Because the imaging process was simulated here through (1), E was known with perfect precision, and the noise ξ was simply set to zero. In such ideal conditions, very high acceleration factors could be reached with essentially perfect reconstructions, even though the imaged anatomy was fairly complex. In Sections III-B and III-C below, the imaging process will be simulated in a more realistic fashion, and results will much better capture the actual limits of the present approach. Imaged objects will be fairly simple, but as demonstrated here, object complexity has little impact on the method’s performance. The main bulk of the processing, i.e., inverting E through (3), is in fact completely object independent.
B. Simulation Package
Programs were written in the Matlab language (Math-Works, Natick, MA) to simulate and visualize an ultrasound field as it propagates and interacts with objects. The simulations were based on a propagation strategy similar to [34]–[36] and were used to generate the snapshots displayed in Figs. 1, 2, and 5. The gray line on the left edge of each frame in Figs. 1, 2, and 5 represents the transducer face. It is a phased array transducer, 4 cm in length, 128 individual elements, 2.25 MHz, transmit focus at 40 cm, [−22°,22°] azimuthal range.
Looking at Fig. 2, for example, the axis along the length of the transducer face, in the vertical direction, will be referred to as the x axis and the horizontal direction, perpendicular to the transducer’s planar face, will be referred to as the z axis. The ultrasound field is displayed in grayscale, and when appropriate, the object is overlaid in white (as in Fig. 2, for example). The simulated object was placed roughly at focus, at z ≈ 40 mm. All 128 elements were actuated for each beam generation. A total of 60 beams were sent into directions ranging uniformly between +22° and −22°, where 0° corresponds to the x = 0 line. The time increment dt was 0.2 μs when generating the displays in Figs. 1, 2, and 4, and 0.1 μs when generating simulated RF signal to reconstruct. The starting point, t = 0, is slightly before the first element was actuated. In simulations, the ultrasound field is known at all points of space and time and can be displayed in snapshots or in animations. In contrast, during experiments the field is known only where detectors are placed, i.e., at the transducer.
C. Simulation Results
1) Beamforming Reconstruction
The simulated field was averaged over the face of each transducer element, providing 128 different time functions, one for each element, as scattered waves propagate back to the transducer plane. Using the signals from each simulated element, for each one of the 60 beams, a simulated ultrasound image was generated using a regular beamforming reconstruction. The resulting image is shown in Figs. 8(a) and (b), with and without object overlay, and gray lines show the limits of the imaged field-of-view (FOV). In Fig. 8(a), where both simulated object and simulated image are overlaid, a good agreement between the 2 can be noted.
Fig. 8.
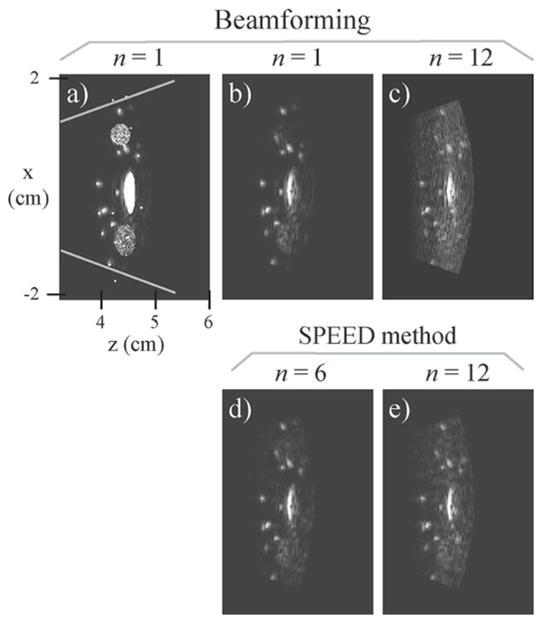
The simulated signal was reconstructed into images. (a) and (b) Non-accelerated reference images were obtained with a receive beam-forming reconstruction, shown here with and without object overlay. (c) Although beamforming could be used to reconstruct accelerated data, it led to images with significantly increased artifact levels. (d) and (e) Results for acceleration factors 6 and 12 are shown. The transmitted waveform used here had a zeroth moment M0 of about 5%.
2) Proposed Reconstruction Algorithm
Images reconstructed using our proposed reconstruction algorithms are displayed in Figs. 8(d) and (e), for acceleration factors of 6 and 12, respectively. Artifact power measurements, defined as a sum-of-squares operator applied to an artifact-only image, normalized by the results of a sum-of-squares operator applied to a corresponding reference image, Fig. 8(b), were performed. The artifact power values for the n = 6 and 12 cases were, respectively, 5.1% and 16%. Fig. 8(c) shows an n = 12 image reconstructed with receive beamforming and featuring a higher artifact level of 87%. Matrix inversions may cause noise amplification, and the so-called g factor often used in parallel MRI gives a measure of noise amplification as a function of spatial location, within the imaged object [22]. A value of 1 corresponds to no noise amplification, and it is the main purpose of regularization schemes to keep such amplification, and g factors, to a minimum. Spatial maps of the g factor were generated, and their mean/standard-deviation values for the n = 6 and 12 cases were, respectively, 1.07/0.03 and 1.10/0.03. The regularization parameter λ in (3) was set to 1%, with E scaled such that the eigenvalues of EHE average to precisely 1.
D. Experimental Results
1) Data Set
The RF signal from a phantom scan was graciously provided by Verasonics, Inc. (Redmond, WA). The ultrasound engine developed by Verasonics, Inc., described at http://www.verasonics.compdf/verasonics_ultrasound_eng.pdf, allows the signal from individual transducer elements to be captured and digitized, at a rate of 4 samples per cycle. A phantom was scanned using a 3.9-cm wide, 128-element linear array operating at 5 MHz, with a 1.0 wavelength pitch and a transmit focus at 100 wavelengths. A total of 128 beams were emitted to scan the whole width of the imaged FOV. Accelerated data sets were synthesized by compounding the signal for n different beams at a time.
2) Results
Figs. 9(b)–(e) show reconstructed images for acceleration factors of 2, 8, 16, and 32, respectively. A reference data set reconstruction with receive beamforming and an acceleration n = 1 are shown in Fig. 9(a). This data set proved especially amenable to accelerated imaging, and reasonable-quality images could be obtained at very high acceleration rates. Even receive beamforming reconstructions could generate reasonable accelerated images, as can be seen in Fig. 9(f). The good performance of receive beamforming may be attributable in part to a fairly long multicycle transmitted waveform.
Fig. 9.
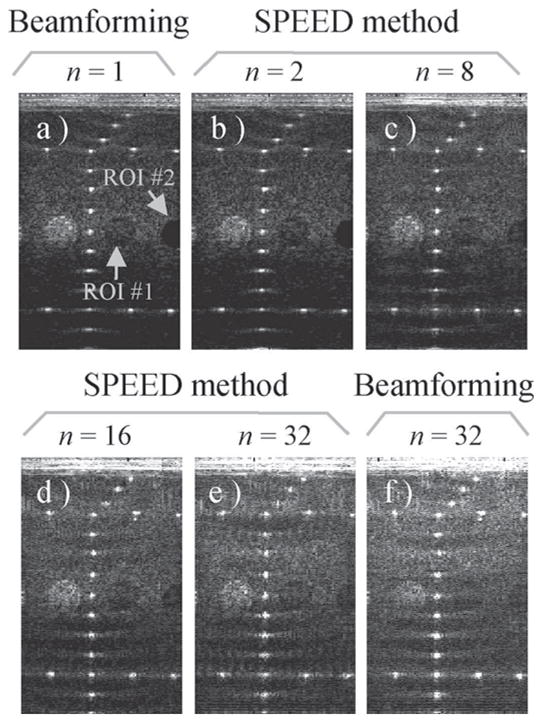
(a) An experimental RF data set was obtained, courtesy of Verasonics, Inc. This data set proved especially amenable to accelerated reconstructions, even with a receive beamforming algorithm. Very high acceleration factors were obtained, and images for n = 2, 8, 16, and 32 are shown here, to be compared with the reference n = 1 case. Although receive beamforming also generated images of reasonable quality, images reconstructed with our proposed algorithm proved superior, as shown in Fig. 10. ROI = region of interest.
The mean value over 2 ROIs, corresponding to the 2 hypoechoic circular objects indicated in Fig. 9(a), was plotted in Fig. 10. For each ROI, curves are shown both for results obtained with a receive beamforming reconstruction (dotted line) and the present SPEED method (solid line). Increased values for the hypoechoic regions translated into losses in contrast, as the echogenicity of surrounding materials remained for the most part unchanged. As can be seen from Fig. 10, contrast was gradually degraded as acceleration was increased and was significantly worse with a receive beamforming reconstruction than with our proposed approach.
Fig. 10.
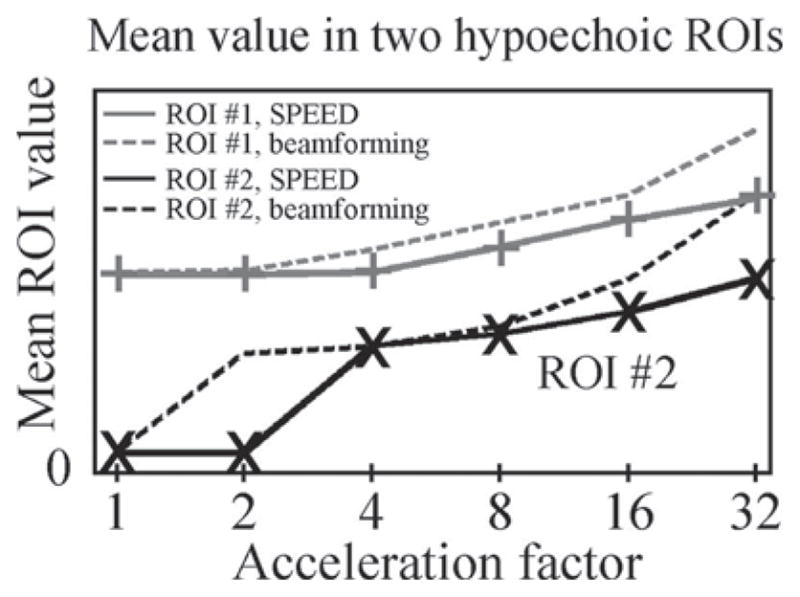
The mean value of 2 hypoechoic regions, both indicated in Fig. 9(a), was measured. Acceleration factors of 1, 2, 4, 8, 16, and 32 were tested, both for the proposed SPEED method (solid lines) and for a receive beamforming reconstruction (dotted lines). As can be seen in Fig. 9, the material surrounding these hypoechoic regions has a fairly constant echogenicity for all considered cases. Accordingly, increased signal values for these hypoechoic regions fairly directly translate into losses in contrast. As could be expected, increasing acceleration tended to have a negative impact on contrast. Furthermore, replacing our algorithm by a receive beamforming reconstruction significant degraded contrast. Overall, reconstructions using our algorithm and low acceleration settings featured the best contrast. ROI = region of interest.
Compared with receive beamforming, the proposed approach did allow improvements in image quality, as seen from Fig. 10. It can also allow the use of transmitted waveforms less ideal for accelerated beamforming reconstructions, such as shorter pulses with improved axial resolution and/or more asymmetric pulses with increased immunity to aberration-induced signal losses.
3) Computation Size
As a representative example, an n = 8 reconstruction with the geometry used in Fig. 9 involved E matrices featuring 212 992 rows and 10 648 columns. This corresponds to a (Nt × Ne) by (n × Nax) matrix, with Nt = 1664 points, Ne = 128 elements, n = 8, and Nax = 1331 (6.4 samples per wavelength). Because E is very sparse (Fig. 3), less than 3.8 GB of RAM was required for the reconstruction. Eqs. (2) and (3) were solved either with a least squares (LSQR) numerical method or by direct inversion. Although processing times were much shorter with LSQR, a direct inversion is preferred, because once obtained, the inverse of E can be used to reconstruct all data sets acquired with a given transducer and a given set of imaging parameters. One inverted matrix is required for each one of the (Nl/n) shots that form an image; the initial inversions could be performed ahead of time, conveniently stored to disk, and loaded when needed to reconstruct real-time data. After an initial effort to perform the inversions, reconstruction could be performed just as fast as a regular (digital) receive beamforming reconstruction. In contrast, an LSQR solution appears much faster initially, but proves quite impractical in the context of real-time imaging, because it would need to be repeated on each time frame individually.
IV. Discussion
A. Summary
The present method accelerates the acquisition of focused ultrasound images by probing the object along several beams at once. Spatial and temporal strategies, exploiting the multi-detector nature of an ultrasound probe along with temporal modulations from frame to frame, are used to separate signals belonging to different beams. Results obtained with acceleration factors up to 32-fold have been shown. A regular receive beamforming reconstruction also features abilities to discriminate signals from different beams. We found the performance of receive beamforming for accelerated imaging to vary significantly among imaging situations, and especially among different transmitted waveforms. In some situations, it performed almost as well as our proposed reconstruction algorithm, e.g., Fig. 9(f). In other cases, it was more clearly outperformed by our algorithm, e.g., Figs. 7(e) and 8(c). But in all cases studied here, the proposed approach did perform noticeably better than receive beamforming.
B. SNR Considerations
The proposed approach has the ability to improve SNR in most practical and envisioned applications. To explain this desirable feature, one must first review the issue of power limitations in ultrasound imaging. In a 510(k) pre-market notification produced in 1985 by the U.S. Food and Drug Administration (FDA), application-specific intensity limits were set [37]–[39]. In the 1990s, these limits were relaxed, and the output display standard (ODS) was introduced, providing real-time values for the thermal index (TI) and mechanical index (MI) [37], [40], [41]. Based on these values, clinicians could take informed decisions regarding risk. Absolute limits were set on MI (1.9 in nonophthalmic applications) and on the spatial peak, temporal average intensity, ISPTA (720 mW/cm2) [37].
From Fig. 5, it can be seen that the n simultaneous beams do not overlap near the focus, but they do overlap near the surface. For highly focused arrays and/or short focal lengths, peak pressure may occur near the focus. Because the various beams do not overlap near the focus, having n simultaneous beams should not affect peak pressure, and MI should remain essentially unchanged. Otherwise, the peak pressure may occur near the surface before the wave-packets get significantly attenuated. By introducing small delays between the various beams, it is fairly straightforward to avoid having more than 2 beams overlapping at any given location; e.g., see Fig. 5(g). Having a mixture of inverted and noninverted beams, both for odd and even time frames, should also help ensure that no more than 2 beams constructively overlap at any given location.
In a case where peak pressure occurs near the focus point, the MI, power, and SNR may potentially remain unchanged, while scan time gets reduced by n. Accordingly, the SNR-per-unit-of-time gets increased by (assuming no noise amplification during the matrix inversions). Such gain can be understood from the fact that globally, over the entire object, n times more ultrasound power is emitted, even though the peak power at any given location is not raised. In a scenario where the peak pressure occurs near the surface, one might either increase MI if the limit of 1.9 has not yet been reached, and/or reduce pressure amplitude by as much as a factor of 2. Assuming the change does not significantly affect the noise level, there would be a 2-fold loss in SNR on the amplitude signal collected at the transducer. The SNR-per-unit-of-time would thus change by a factor of ( ), which translates into an actual increase for cases where n > 4. For displays where intensity rather than amplitude are shown, all SNR values quoted above should be squared. The ability to increase the SNR per unit of time, rather than merely maintain it, is in sharp contrast with parallel MRI.
C. Nonlinear Effects
The proposed temporal strategy removes artifacts left over by the spatial strategy and does so through pulse reversal. Nonlinear effects may reduce the efficacy of this artifact-suppression scheme, leading to higher artifact levels. Furthermore, the superposition of several beams may alter the contrast of tissues featuring significant nonlinear behavior as compared with a regular one-beam-at-a-time acquisition. Because power levels are relatively low in imaging as compared with ablation, nonlinear effects are expected to be subtle; nevertheless, they represent a limitation of the approach whose actual severity remains to be assessed. Regarding the linearity of the transducer output, it may not be challenged to any greater degree than during regular, single-beam transmit events. Because no more than 2 beams overlap anywhere in the object all the way to the transducer itself at any given time, with the pressure per beam decreased by 2 (as explained above), the transducer should never exceed its regular (single-beam) maximum value, even when the number of beams n is much greater than 2. In other words, because different beams have different delay values for different elements, and because different beams may not be sent at precisely the same instant, individual elements may be actuated for longer durations during our multibeam transmit as compared with a single-beam transmit. But maximum output pressure would not exceed values from a single-beam transmit case, for any element.
D. Potential Applications
For example, the SPEED method might be used to increase spatial resolution, allowing the number of lines per image Nl to be increased while keeping frame rates unaffected. Alternately, the approach could enable multifocus imaging. Lateral resolution tends to be superior near the focus and to degrade away from it. The proposed approach may allow the acquisition of n images of different focal lengths to be interleaved, allowing a composite image with improved resolution to be obtained. Yet another potential application involves enabling 3-D coverage, without sacrificing frame rates. With an acceleration of n, the acquisition of n different planes could be combined, using a 2-D phased-array transducer. In a 3-D setting, interesting new questions arise, such as how to best combine individual beams into groups of n. One might expect acceleration factors higher than those obtained in 2-D imaging to be reached [42], because 2 acceleration directions can be exploited rather than a single one.
E. Sharpening Images
Another application, beyond the scope of the present work, presents itself when considering correlation maps such as in Fig. 11. Each spatial location (r, θ) gets encoded through a unique function in the measured RF signal, in a space of dimensions Ne by Nt. Using the geometry from Fig. 7, and the emitted waveform shown in Fig. 7(d), a correlation map of size Nbeams by Nbeams was generated for the encoding functions corresponding to all of the beams at a given value of r (Fig. 11). The advantage of the present approach over receive beamforming comes from the ability to handle the off-diagonal terms. In Fig. 11, the diagonal terms were zeroed to show only off-diagonal terms, and it can be seen that the brightest values tend to be found near the diagonal. These terms correspond to cross correlation between closely related locations and lead to blurring. The present approach could in principle be used to help resolve these correlations, leading to sharper images.
Fig. 11.
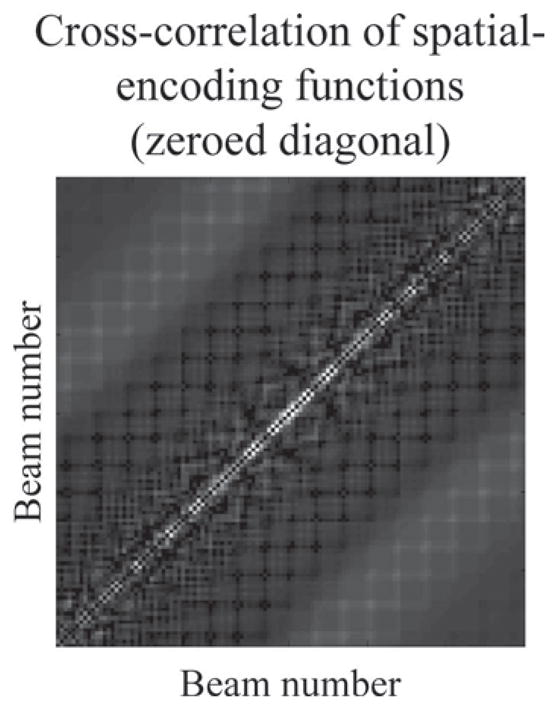
The nondiagonal elements in a cross-correlation matrix between different spatial-encoding functions tend to have their highest values close to the diagonal. These high values cause some of the signal from a given beam to be falsely attributed to neighboring beams instead, leading to blurring. As an alternative application, the proposed algorithm could conceivably be used to help resolve, at least partly, these cross-terms.
F. Increasing Acceleration, Comparison with Parallel MRI
Early developments in parallel MRI allowed acceleration factors around 2 [21], [22]. Adding a temporal scheme, like here, can roughly double the reasonably achievable acceleration [31]–[33]. If experience with related methods in MRI is any indication, the maximum acceleration factor offered by the proposed approach can presumably be increased through optimizations of the probe geometry and of the reconstruction algorithms through the use of a second acceleration direction as in 3-D imaging and possibly through further increases in the number of probe elements, especially in 2-D transducer arrays.
V. Conclusion
Ultrasound imaging speed can be increased by many-fold, and results with acceleration factors up to 32 were shown. By making diagnostic ultrasound imaging faster, we aim to provide extra time within the acquisition process where new and/or complementary information can be gathered. This extra information can be about spatial resolution, e.g., by increasing the number of lines in an image. It can be about spatial coverage, by allowing more time for ultrasound fields to reach deeper into the body or by sending beams in extra directions to gain 3-D knowledge of the object. Or it can be of a different nature, interleaving and merging scans made with different frequencies, power, focal length, focal width, and so on. By making focused ultrasound imaging faster, we hope to enrich the information content that can be acquired and displayed on ultrasound scanners.
Acknowledgments
The authors sincerely thank Dr. R. Daigle and Dr. L. Pflugrath at Verasonics, Inc., for graciously providing a data set from their system. Thanks are directed also to Dr. C. Farny and Dr. W. S. Hoge for useful discussions. The content of this work is the sole responsibility of its authors.
References
- 1.Shattuck DP, Weinshenker MD, Smith SW, von Ramm OT. Explososcan: A parallel processing technique for high speed ultrasound imaging with linear phased arrays. J Acoust Soc Am. 1984 Apr;75:1273–1282. doi: 10.1121/1.390734. [DOI] [PubMed] [Google Scholar]
- 2.Üstüner KF. High information rate volumetric ultrasound imaging—Acuson SC2000 volume imaging ultrasound system. [Online]. Available: www.medical.siemens.com/siemens/en_US/gg_us_FBAs/files/misc_downloads/Whitepaper_Ustuner.pdf.
- 3.Anderson F. Device for imaging three dimensions using simultaneous multiple beam formation. 4817434. U.S. Patent. 1989 Apr 4;
- 4.Cole CR, Gee A, Liu T. Method and apparatus for transmit beamformer. 6363033. U.S. Patent. 2002 Mar 26;
- 5.Miller CX. Method and apparatus for forming multiple beams. 7227813. U.S. Patent. 2007 Jun 5;
- 6.Üstüner KF, Cai AH, Bradley CE. Transmit multibeam for compounding ultrasound data. 0241454. U.S. Patent. 2006 Oct 26;
- 7.Bredthauer GR, von Ramm OT. Array design for ultrasound imaging with simultaneous beams. presented at the IEEE Int. Symp. Biomedical Imaging; Washington, D.C. 2002. [Google Scholar]
- 8.Shen J, Ebbini ES. A new coded-excitation ultrasound imaging system—Part I: Basic principles. IEEE Trans Ultrason Ferroelectr Freq Control. 1996 Jan;43:131–140. [Google Scholar]
- 9.Deffieux T, Gennisson JL, Tanter M, Fink M. Assessment of the mechanical properties of the musculoskeletal system using 2-D and 3-D very high frame rate ultrasound. IEEE Trans Ultrason Ferroelectr Freq Control. 2008 Oct;55:2177–2190. doi: 10.1109/TUFFC.917. [DOI] [PubMed] [Google Scholar]
- 10.Montaldo G, Tanter M, Bercoff J, Benech N, Fink M. Coherent plane-wave compounding for very high frame rate ultrasonography and transient elastography. IEEE Trans Ultrason Ferroelectr Freq Control. 2009 Mar;56:489–506. doi: 10.1109/TUFFC.2009.1067. [DOI] [PubMed] [Google Scholar]
- 11.Kino GS, Corl D, Bennett S, Peterson K. Real time synthetic aperture imaging system. presented at the Ultrasonics Symp; New York, NY. 1980. [Google Scholar]
- 12.Jensen JA, Nikolov SI, Gammelmark KL, Pedersen MH. Synthetic aperture ultrasound imaging. Ultrasonics. 2006 Dec;44(suppl 1):e5–e15. doi: 10.1016/j.ultras.2006.07.017. [DOI] [PubMed] [Google Scholar]
- 13.Karaman M, Li PC, O’Donnell M. Synthetic aperture imaging for small scale systems. IEEE Trans Ultrason Ferroelectr Freq Control. 1995 May;42:429–442. [Google Scholar]
- 14.Misaridis TX, Jensen JA. Space-time encoding for high frame rate ultrasound imaging. Ultrasonics. 2002 May;40:593–597. doi: 10.1016/s0041-624x(02)00179-8. [DOI] [PubMed] [Google Scholar]
- 15.Jaffe JS, Cassereau PM. Multibeam imaging using spatially variant insonification. J Acoust Soc Am. 1988;83:1458–1464. [Google Scholar]
- 16.Gran F, Jensen JA. Frequency division transmission imaging and synthetic aperture reconstruction. IEEE Trans Ultrason Ferroelectr Freq Control. 2006 May;53:900–911. doi: 10.1109/tuffc.2006.1632681. [DOI] [PubMed] [Google Scholar]
- 17.Gran F, Jensen JA. Directional velocity estimation using a spatio-temporal encoding technique based on frequency division for synthetic transmit aperture ultrasound. IEEE Trans Ultrason Ferroelectr Freq Control. 2006 Jul;53:1289–1299. doi: 10.1109/tuffc.2006.1665077. [DOI] [PubMed] [Google Scholar]
- 18.Song TK, Jeong YK. Ultrasound imaging system and method based on simultaneous multiple transmit-focusing using weighted orthogonal chirp signals. 7066886. U.S. Patent. 2006 Jun 27;
- 19.Kiymik MK, Güler I, Hasekioglu O, Karaman M. Ultrasound imaging based on multiple beamforming with coded excitation. Signal Processing. 1997;58:107–113. [Google Scholar]
- 20.Gran F, Jensen JA. Spatial encoding using a code division technique for fast ultrasound imaging. IEEE Trans Ultrason Ferroelectr Freq Control. 2008 Jan;55:12–23. doi: 10.1109/TUFFC.2008.613. [DOI] [PubMed] [Google Scholar]
- 21.Sodickson DK, Manning WJ. Simultaneous acquisition of spatial harmonics (SMASH): Fast imaging with radiofrequency coil arrays. Magn Reson Med. 1997 Oct;38:591–603. doi: 10.1002/mrm.1910380414. [DOI] [PubMed] [Google Scholar]
- 22.Pruessmann KP, Weiger M, Scheidegger MB, Boesiger P. SENSE: Sensitivity encoding for fast MRI. Magn Reson Med. 1999 Nov;42:952–962. [PubMed] [Google Scholar]
- 23.Paulraj AJ, Kailath T. Increasing capacity in wireless broadcast systems using distributed transmission/directional reception (DTDR) 5345599. U.S. Patent. 1994 Sep 6;
- 24.Madore B, Glover GH, Pelc NJ. Unaliasing by Fourier-encoding the overlaps using the temporal dimension (UNFOLD), applied to cardiac imaging and fMRI. Magn Reson Med. 1999 Nov;42:813–828. doi: 10.1002/(sici)1522-2594(199911)42:5<813::aid-mrm1>3.0.co;2-s. [DOI] [PubMed] [Google Scholar]
- 25.Hoge WS, Brooks DH, Madore B, Kyriakos WE. A tour of accelerated parallel MR imaging from a linear systems perspective. Concepts in Magn Reson. 2005;27A:17–37. [Google Scholar]
- 26.King KF, Angelos L. SENSE image quality improvement using matrix regularization. presented at ISMRM; Glasgow, Scotland. 2001. [Google Scholar]
- 27.Lin FH, Kwong KK, Belliveau JW, Wald LL. Parallel imaging reconstruction using automatic regularization. Magn Reson Med. 2004 Mar;51:559–567. doi: 10.1002/mrm.10718. [DOI] [PubMed] [Google Scholar]
- 28.Hoge WS, Kilmer ME, Haker SJ, Brooks DH, Kyriakos WE. Fast regularized reconstruction of non-uniformly sub-sampled parallel MRI data. presented at IEEE Int. Symp. Biomedical Imaging; Arlington, VA. 2006. [Google Scholar]
- 29.Tsao J. On the UNFOLD method. Magn Reson Med. 2002 Jan;47:202–207. doi: 10.1002/mrm.10024. [DOI] [PubMed] [Google Scholar]
- 30.Madore B, Hoge WS, Kwong R. Extension of the UNFOLD method to include free-breathing. Magn Reson Med. 2006 Feb;55:352–362. doi: 10.1002/mrm.20763. [DOI] [PubMed] [Google Scholar]
- 31.Madore B. Using UNFOLD to remove artifacts in parallel imaging and in partial-Fourier imaging. Magn Reson Med. 2002 Sep;48:493–501. doi: 10.1002/mrm.10229. [DOI] [PubMed] [Google Scholar]
- 32.Madore B. UNFOLD-SENSE: A parallel MRI method with self- calibration and artifact suppression. Magn Reson Med. 2004 Aug;52:310–320. doi: 10.1002/mrm.20133. [DOI] [PubMed] [Google Scholar]
- 33.Kellman P, Epstein FH, McVeigh ER. Adaptive sensitivity encoding incorporating temporal filtering (TSENSE) Magn Reson Med. 2001 May;45:846–852. doi: 10.1002/mrm.1113. [DOI] [PubMed] [Google Scholar]
- 34.Walker WF, Trahey GE. The application of k-space in pulse echo ultrasound. IEEE Trans Ultrason Ferroelectr Freq Control. 1998 May;45:541–558. doi: 10.1109/58.677599. [DOI] [PubMed] [Google Scholar]
- 35.Mast TD, Souriau LP, Liu DL, Tabei M, Nachman AI, Waag RC. A k-space method for large-scale models of wave propagation in tissue. IEEE Trans Ultrason Ferroelectr Freq Control. 2001 Mar;48:341–354. doi: 10.1109/58.911717. [DOI] [PubMed] [Google Scholar]
- 36.Clement GT, Hynynen K. Field characterization of therapeutic ultrasound phased arrays through forward and backward planar projection. J Acoust Soc Am. 2000 Jul;108:441–446. doi: 10.1121/1.429477. [DOI] [PubMed] [Google Scholar]
- 37.Duck FA. Medical and non-medical protection standards for ultrasound and infrasound. Prog Biophys Mol Biol. 2007 Jan-Apr;93:176–191. doi: 10.1016/j.pbiomolbio.2006.07.008. [DOI] [PubMed] [Google Scholar]
- 38.O’Brien WD, Jr, Abbott JG, Stratmeyer ME, Harris GR, Schafer ME, Siddiqi TA, Merritt CR, Duck FA, Bendick PJ. Acoustic output upper limits proposition: should upper limits be retained? J Ultrasound Med. 2002 Dec;21:1335–1341. doi: 10.7863/jum.2002.21.12.1335. [DOI] [PubMed] [Google Scholar]
- 39.O’Brien WD, Jr, Miller D. Diagnostic ultrasound should be performed without upper intensity limits. Med Phys. 2001 Jan;28:1–3. doi: 10.1118/1.1335500. [DOI] [PubMed] [Google Scholar]
- 40.National Council on Radiation Protection and Measurements. Diagnostic ultrasound safety. A summary of the technical report ‘Exposure criteria for medical diagnostic ultrasound: II. Criteria based on all known mechanisms’. [Online]. Available: http://www.ncrponline.org/Publications/Reports/Misc_PDFs/Ultrasound%20Summary-NCRP.pdf.
- 41.Abbott JG. Rationale and derivation of MI and TI-a review. Ultrasound Med Biol. 1999 Mar;25:431–441. doi: 10.1016/s0301-5629(98)00172-0. [DOI] [PubMed] [Google Scholar]
- 42.Weiger M, Pruessmann KP, Boesiger P. 2D SENSE for faster 3D MRI. MAGMA. 2002 Mar;14:10–19. doi: 10.1007/BF02668182. [DOI] [PubMed] [Google Scholar]


