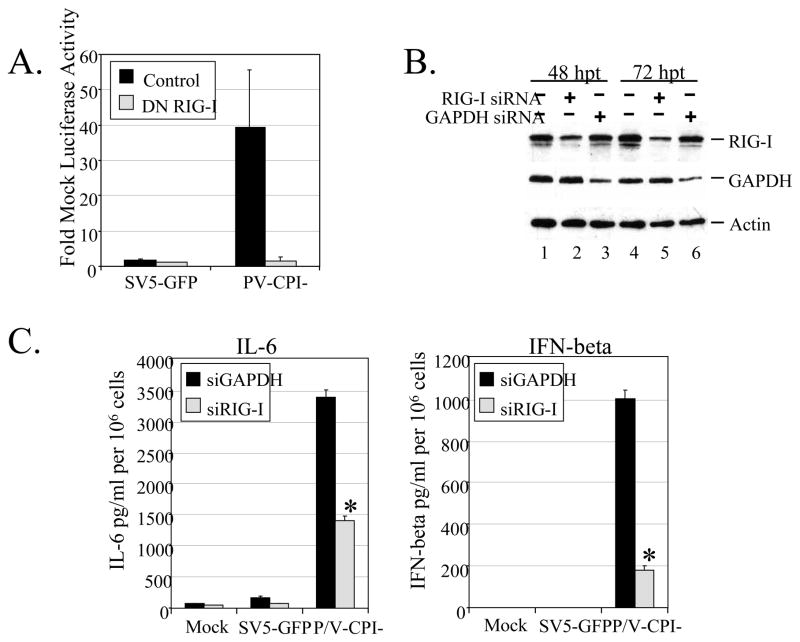
Figure 1. RIG-I contributes to cytokine induction by P/V-CPI-.
A) Reporter Gene Assay. A549 cells were co-transfected for 16 h with a plasmid expressing luciferase under control of the IFN-beta promoter and a either a RIG-I DN plasmid or its empty vector (control), and pSV-beta-galactosidase for normalization. Sixteen hrs pt, cells were infected at an moi of 10 with the indicated viruses. At 24 h pi lysates were harvested and analyzed for levels of luciferase activity. Results are expressed as fold over mock and error bars indicate standard deviation of triplicate samples. B) siRNA knockdown of RIG-I. A549 cells were left untreated (lanes 1 and 4) or transfected with 100 uM of siRNA targeting RIG-I (lanes 2 and 5) or GAPDH (lanes 3 and 6) as a control. At 48 and 72 h pt, levels of RIG-I, GAPDH, and actin were assayed by Western blotting. C) Cytokine secretion. A549 cells were transfected with siRNA targeting GAPDH or RIG-I and at 48 h pt cells were infected at an moi of 10 with SV5-GFP or P/V-CPI-. At 24 h pi (72 h pt), levels of IL-6 (left panel) or IFN-beta (right panel) were measured by ELISA. Results are expressed as mean values from triplicate samples with error bars representing standard deviation and values are normalized to 106 cells. *, p value less than 0.008 compared to corresponding samples from GAPDH siRNA treated control cells.

