Abstract
The hepatotoxin okadaic acid (OA) was incubated with nine human recombinant cytochrome P450s (1A1, 1A2, 2C8, 2C9, 2C19, 2D6, 2E1, 3A4 and 3A5). Both CYP3A4 and CYP3A5 converted OA to a mixture of the same four metabolites, but incubation with CYP3A4 resulted in higher levels of conversion. Michaelis-Menten parameters, Km (73.4 μM) and Vmax (7.23 nmol of metabolites nmol-1 min-1) for CYP3A4 were calculated by analyzing double-reciprocal plots. LC-MSn analysis and chemical interconversion indicate that metabolites 2 and 3 are the 11S-hydroxy and 11R-hydroxy okadaic acid respectively, while metabolite 4 is 11-oxo okadaic acid. LC-MSn analysis of metabolite 1 shows a molecular ion which corresponds to an addition of 16 amu to OA, also suggesting hydroxylation, but the specific site has not been identified. The same four metabolites were produced upon incubation of okadaic acid with pooled human liver microsomes. This transformation could be completely inhibited with ketokonazole, and inhibitor of the CYP3A family of enzymes. The metabolites were determined to be only slightly less potent inhibitors of serine threonine protein phosphatase 2A (PP2A) when compared to OA. As PP2A is the principle molecular target for OA, these oxidative transformations may not effectively detoxify OA.
Keywords: okadaic acid, diarrheic shellfish poisoning (DSP), cytochrome P450, metabolism, human liver microsome, protein phosphatase inhibitors
1. Introduction
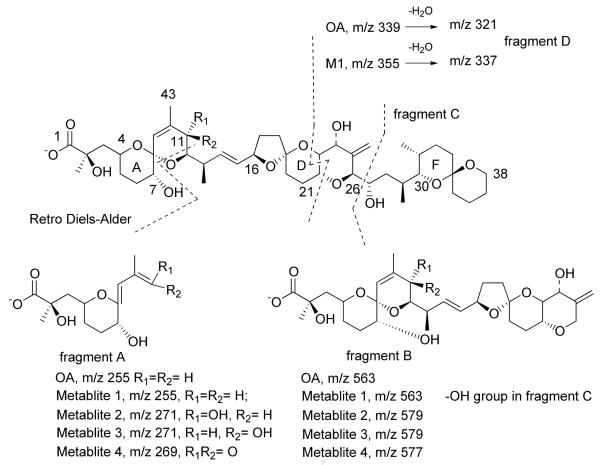
Okadaic acid (OA, Fig. 1) and the related dinophysistoxins (DTX-1 and DTX-2) are produced by several dinoflagellates (marine phytoplankton) belonging to the genera Prorocentrum and Dinophysis. Consumption of OA-contaminated shellfish results in a syndrome known as diarrheic shellfish poisoning (DSP) which is characterized by severe gastrointestinal symptoms. DSP has been associated with the consumption of mussels, scallops or clams tainted with OA and its derivatives. DSP has worldwide distribution, however it appears to be most prevalent in Japan and Northern Europe (Luckas, et al., 2005; Yasumoto and Murata, 1993). The effects of long-term and chronic exposure to OA may be of greater concern, as it has been demonstrated to be a potent tumor promoter that differs from the phorbol ester class (Fujiki and Suganuma, 1993; Haystead, et al., 1989).
Figure 1.
Structure of OA and metabolites and proposed fragmentation pathways.
OA and DTX’s are inhibitors of protein phosphatases PP1 and PP2A (Dounay and Forsyth, 2002). Inhibition of PP1/2A results in the hyperphosphorylation of many proteins in the cell and loss of regulation of cellular processes. OA can act both as a tumor promoter and inducer of apoptosis (Gehringer, 2004). A growing body of evidence suggests that OA exhibits genotoxic effects. Fessard demonstrated the formation of OA-DNA adducts in fibroblasts and keratinocytes (Fessard, et al., 1996). Tohda reported a positive Ames test in mammalian cells with OA (Tohda, et al., 1993). A statistically significant increase in micronucleous formation was observed in the haematocytes of the mussel Perna perna, upon exposure to OA (Carvalho Pinto-Silva, et al., 2003). Utilizing the cytokinesis-block micronucleous assay and fluorescence in situ hybridization (FISH), LeHegarat reported that OA had an aneugenic (chromosome loss) effect on CHO-K1 cells, but only after metabolic activation with a rat liver postmitochondrial S9 fraction (Le Hegarat, et al., 2003, 2004). This effect could be abolished by heat inactivation of the S9 fraction. The authors suggested that OA is metabolically activated to one or more genotoxic products.
A few studies on the distribution of OA in vertebrates have been reported. Two independent studies report the systemic distribution of tritiated OA to all organs examined after oral administration to mice. This included the heart, stomach, kidney, liver, skin, large and small intestines and bile (Matias, et al., 1996, 1999; Ito, et al., 2002). Highest concentrations within the first 24 hours were observed in the stomach, large and small intestines and bile. However, OA appeared to have the longest residence time in the liver, with detectable levels present up to two weeks after administration.
No studies on the metabolism of OA in vertebrates have been reported. However, Pfohl-Leszkowicz reported an induction of EROD activity 24 h and 48 h after injection of OA into the fish Dicentrarchus labrax (Pfohl-Leszkowicz, et al., 1998) which would be indicative of upregulation of the CYP1A family of enzymes. The metabolism of OA in shellfish has been described. Three OA metabolites, which were oxidized in the alcohol portion of the ester, were isolated from the diatom Thalassiosira weissflogii, and partially characterized (Windust, et al., 2000) although the specific site of oxidation was not identified. In bi-valves, OA, DTX-2 and DTX-1 are converted to complex mixtures of fatty acid esters, by acylation of the 7-hydroxyl group, collectively known as DTX-3 (Marr, et al., 1992; Vale and Sampayo, 1999; 2002; Torgersen, et al., 2008).
In this study, the effect of nine human cytochrome P450s (1A1, 1A2, 2C8, 2C9, 2C19, 2D6, 2E1, 3A4 and 3A5) on OA was examined. These enzymes were chosen because taken together, they represent on average 70% of the cytochrome P450s present in human liver and are the major enzymes involved in xenobiotic metabolism (Lewis, 2001). Among these nine cytochrome P450s, we observed that CYP3A4 and CYP3A5 converted OA into four oxidized metabolites.
2. Materials and methods
2.1 Chemicals and Biochemicals
Okadaic acid was isolated from cultures of P. hoffmanianum according to published methods (Hu, et al., 1992), prepared as the ammonium salt and compared by LC-MS to okadaic acid (> 99.7% purity) which was purchased from Calbiochem (San Diego, CA). Human recombinant cytochrome P450s were purchased from Codexis (Pasadena, CA). Pooled human liver microsomes were purchased from BD Biosciences (Woburn, MA). Protein phosphatase Type 2A was purchased from Upstate Biotechnology Inc. (Temecula, CA). HPLC-grade acetonitrile was purchased from Fisher Chemicals (Fair Lawn, NJ). All other chemicals were purchased from Sigma-Aldrich (St. Louis, MO).
2.2 Confirmation of Enzyme Activity
All enzymes were determined to be active by incubating with positive controls according to previously described protocols; ethoxyresorufin deethylation for CYP 1A1 and 1A2 (Leclercq, et al., 1996); paclitaxel hydroxylation for CYP 2C8 (Cresteil, et al., 2002); harmin demethylation for CYP 2C9, 2D6 (Yu, et al., 2003); omeprazole hydroxylation for CYP 2C19 (Yamazaki, et al., 1997); chlorzoxazone hydroxylation for CYP 2E1 (Peter, et al., 1990); testosterone hydroxylation for CYP 3A4 and 3A5 (Krauser, et al., 2004).
2.3 Incubation of OA with P450s
Incubations were performed at 37 °C on a temperature-controlled shaker. The standard incubation (final volume 0.5 mL) contained 500 pmol of P450 enzyme, 50 μM of OA ammonium salt and reaction mix which contained an NADPH regeneration system provided by the manufacturer (Codexis, Pasadena, CA). The reaction mix/OA mixtures were vortexed and preincubated for 5 min at 37 °C prior to addition of enzyme. The reactions were monitored at 0, 30, 60 min. The reactions were quenched with an equal volume of cold methanol. The vial was vortexed and stored at - 20 °C for 20 min. The solution was centrifuged to remove precipitated protein and diluted to about 2.5 μM (OA concentration) with methanol. Proteins were precipitated a second time at - 20 °C for 20 min and centrifuged again. The samples were analyzed by LC-MS.
2.4 CYP3A4 Enzyme kinetics
From preliminary experiments it was established that the formation of metabolites from OA was linear for up to 15 min. Kinetic experiments were performed in 0.5 mL volume with OA ammonium salt concentrations ranging from 10-100 μM, 300 pmol of 3A4 enzyme and reaction mix. Reactions were monitored at 5, 7.5 and 10 min. The reactions were analyzed by LC-MS after workup described above.
2.5 Incubation of OA with pooled human liver microsomes
The standard incubation mixture (final volume of 0.5 mL) contained human liver microsomes (5.0 mg protein mL-1), 0.1 M potassium phosphate buffer (pH = 7.4), an NADPH regenerating system consisting of 1.3 mM NADP+, 3.3 mM glucose 6-phosphate and 0.4 U mL-1 glucose 6-phosphate dehydrogenase, 3.3 mM MgCl2 and 5 μM OA ammonium salt. Incubation was carried out at 37 °C for 30 min and terminated by adding an equal volume of cold methanol. The vial was vortexed and stored at - 20 °C for 20 min. The solution was centrifuged to remove precipitated protein. The sample was assayed by LC-MS.
2.6 LC-MSn Analyses
HPLC analysis was carried out on a Finnigan Surveyor series HPLC system (Thermo Fisher Scientific Inc., Waltham, MA). A 5 μm C18, 250 mm × 4.6 mm Discovery column (Supelco, Bellefonte, PA) was used to separate metabolites. The chromatographic conditions were as follows: flow rate of 0.5 mL/min; solvent A, CH3CN; solvent B, 2 mM NH4OAc buffer containing 0.05% formic acid; 0 - 25 min, 40% to 85% A (v/v); 25 - 30 min, 85% to 90% A (v/v); 30 - 35 min, hold at 90% A (v/v). MS analysis was performed on a Finnigan LCQ Deca XP MAX mass ion-trap spectrometer (Thermo Fisher Scientific Inc., Waltham, MA). Full-scan mass spectra were acquired in negative electrospray ionization (ESI) mode with collision energy of 35 eV, over the mass range m/z 500-1000. The sheath gas flow rate was 40 (arbitrary units) and the auxiliary gas was set at 10 (arbitrary units). The spray voltage was set at 3.5 kV and the capillary voltage was set at -45 V. The capillary temperature was set at 200 °C. A setting of 35% normalized collision energy was applied to ions of all MSn experiments. Four metabolites were further purified by HPLC. The column effluent was split post column (1:4) with the smaller portion directed to the MS interface and the remainder of the effluent was collected. Fractions were dried in vacuuo and reanalyzed by LC-MS as described above. For enzyme kinetics experiments, total area normalization method was utilized to determine the relative contributions of OA and its metabolites. For protein phosphatase inhibition experiments with isolated metabolites, concentrations of metabolites were determined against a single point calibration curve generated by injecting 10 μL of a 6.2 μM solution (50 ng) of OA. The instrument’s limit of detection (LOD, defined as S/N = 3) was 0.1 ng for OA.
2.7 Reduction of Metabolite 4
Ten μL of sodium borohydride (NaBH4) in DMF (1 μg μL-1) was added to a stirred mixture of metabolite 4 (~ 10 μg), cerium chloride heptahydrate (~ 1 mg) and methanol (1 mL). The mixture was stirred at room temperature for 30 min. Methanol was evaporated under a stream of N2 and the residue was redissolved in 0.5 mL of CH2Cl2/MeOH (85:15, v/v). Residual salts were removed by rapid chromatography technique on a PrepSep Silica gel cartridge (Fisher Scientific, Fair Lawn, NJ). Elution was performed using 15 mL CH2Cl2/MeOH (85:15, v/v). Eluant was collected and evaporated to dryness under a stream of N2 and the residue was reconstituted in 200 μL MeOH for LC-MS analysis.
2.8 Oxidation of Metabolite 2
To a solution of 20 μg of metabolite 2 in 200 μL of CH2Cl2 was added 20 μL of a suspension of activated MnO2 in CH2Cl2 (4 mg MnO2 per 1 mL CH2Cl2). The reaction mixture was stirred at room temperature for 30 min. MnO2 was removed by 0.45 μ filter. The filtrate was evaporated under a stream of N2 and redissolved in 200 μL of methanol for LC-MS analysis.
2.9 Protein Phosphatase 2A Inhibition Assay
The protein phosphatase inhibition assay was carried out in 96-well plates based on a method previously described (Simon and Vernoux, 1994; Tubaro, et al., 1996). Samples were allowed to incubate for 1 h at room temperature and read using a Bio-Tek Instruments Synergy 2 plate reader (Winooski, VT) scanning at 405 nm. A standard curve was prepared with pure OA, prepared exactly as the samples. Inhibitor concentrations giving 50% inhibition against the reference value was determined from dose-response curves of activity versus the log of concentration. IC50 concentrations were calculated using the program Prism (v3, GraphPad Software).
3. Results and Discussion
3.1 Metabolism of okadaic acid by cytochrome P450s
Okadaic acid (OA) was incubated with nine recombinant human P450 enzymes (CYP1A1, 1A2, 2C8, 2C9, 2C19, 2D6, 2E1, 3A4 and 3A5). The reactions were monitored by LC-MS and the results indicated that CYP3A4 and CYP 3A5 metabolize OA, with CYP 3A4 resulting in higher turnover. The total ion current chromatogram obtained from the negative ion LC-MS analysis of the reaction mixture after incubation of OA with CYP 3A4 for 30 min is shown in Fig. 2B. Four new peaks eluting before OA (tR 23.75 min) in the LC-MS profile of the reaction mixture were observed, including two major peaks (metabolite 1, tR 13.15 min; metabolite 2, tR 17.92 min) and two minor peaks (metabolite 3, tR 19.23 min; metabolite 4, tR 20.65 min). These four metabolites were absent from the incubation mixture when quenched at 0 min (Fig. 2a) and increased with incubation time. Likewise, incubation of OA with CYP3A5 produced four peaks at the same retention times and having identical molecular ions as those of metabolites 1-4, suggesting that they are identical to metabolites produced by CYP3A4. However, the overall conversion of OA was less in the CYP 3A5 reaction. After 6 hrs of incubation, the overall yield of all four metabolites was only 6.1% for the CYP 3A5 reaction while it was 31.3% for the CYP3A4 reaction. Within the limits of detection (0.1 ng OA) none of the seven other P450s metabolized OA when incubated under the same conditions, suggesting that those enzymes play no significant role in the metabolism of OA.
Figure 2.
Total ion chromatogram (TIC) of metabolic products of OA incubated with CYP3A4. (a) 0 h (b) 30 min. (c) Total ion chromatogram (TIC) of metabolic products of OA incubated with HLM. The mass range was from m/z 800 - 850.
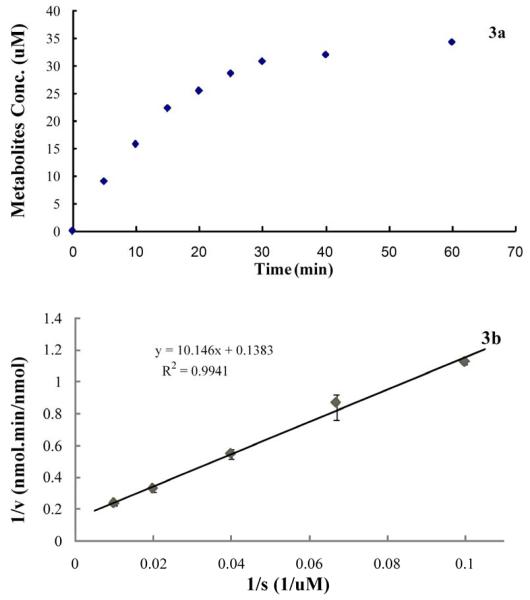
Preliminary experiments indicated that OA metabolism by CYP3A4 was linear up to 15 min (Fig. 3a). The Michaelis-Menten parameters, Km (73.4 μM) and Vmax (7.23 nmol of metabolites nmol-1 min-1) for the oxidation of OA by CYP3A4 were calculated by analyzing double-reciprocal plots (Fig. 3b) for incubations of OA with at concentrations ranging from 10 μM to 100 μM.
Figure 3.
(a) Metabolic profile of 50 μM OA incubated with 500 pmol CYP3A4 in 0.5 ml final volume. (b) Double-reciprocal plot (1/V vs 1/S)
Okadaic acid (OA) was also incubated with pooled human liver microsomes (final protein concentration of 5 mg mL-1). LC-MS analysis revealed that four metabolites, identical to those formed in CYP3A4 incubations, were produced (Fig. 2c), suggesting that OA can be metabolized by human liver. Within the limits of detection, this transformation was completely inhibited by the presence of 10 μM ketoconazole (Dilmaghanian, et al., 2004), a known CYP3A inhibitor. This result further suggested than in human liver, CYP3A is principally responsible for OA metabolism.
3.2 Characterization of metabolites
In the negative ESI full-scan mass spectrum, metabolites 1-3 produced the same molecular ion peaks [M-H]- at m/z 819, while metabolite 4 yielded a [M-H]- ion of m/z 817. A difference of 16 in the m/z ratios for the molecular ion peaks of metabolites 1-3 when compared to OA (m/z 803) is suggestive of a hydroxylation or epoxidation of the okadaic acid molecule.
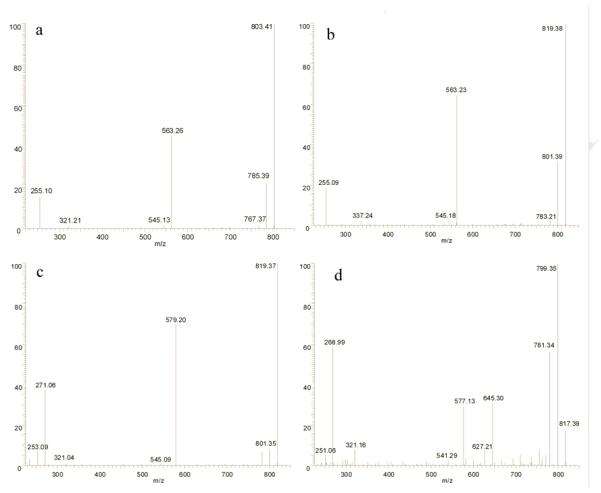
MSn experiments were further employed to identify the structures of these metabolites. Some important fragments of OA and metabolites 1-4 are listed in Tables 1 and 2. In the MS2 spectrum from deprotonated OA (m/z 803), two important intense negative ions at m/z 563 and 255 are typically observed (Fig. 4a). The former originates from the cleavage between C26 and C27, the latter results from RDA (retro Diels-Alder) cleavage in ring B (Fig. 1) (Torgersen, et al., 2008; Paz, et al., 2007; Gerssen, et al., 2008). From metabolites 1-3, negative parent ions [M-H]- at m/z 819 were selected to perform MS2 measurements. Metabolite 1 displays major fragments m/z 563 and 255 (Fig. 4b) identical to OA in the MS2 spectrum. On the other hand, a minor peak at m/z 321 in the MS2 spectra of OA, possibly resulting from cleavage through rings D and E (Fig. 1), is replaced by m/z 337 in the MS2 spectrum of metabolite 1. Noteworthy is the observation of a fragment of m/z 335 from DTX-1, an analog of OA which has a methyl group at C35 (Torgersen, et al., 2008). These observations support the conclusion that hydroxylation occurred in fragment C of metabolite 1.
Table 1. Some important m/z values for fragment ions of deprotonated OA and metabolites 1-4 in negative ESI mode.
| OA | 1 | 2 | 3 | 4 | |
|---|---|---|---|---|---|
| [M-H]- | 803 | 819 | 819 | 819 | 817 |
| - H2O | 785 | 801 | 801 | 801 | 799 |
| - H2O | 767 | 783 | 783 | 783 | 781 |
| Frag B | 563 | 563 | 579 | 579 | 577 |
| - H2O | 545 | 545 | |||
| Frag A | 255 | 255 | 271 | 271 | 269 |
| - H2O | 253 | 253 | 251 | ||
| Frag D | 321 | 337 | 321 | 321 | 321 |
Table 2. Some important m/z values for MS3 fragment ions from fragment A of OA and metabolites 1-4 in negative ESI mode.
| OA | 1 | 2 | 3 | 4 | ||
|---|---|---|---|---|---|---|
| Frag A | 255 | 255 | 271 | 271 | 269 | 241 (- CO) |
| - H2O | 237 | 237 | 253 | 253 | 251 | 223 |
| - H2O | 219 | 219 | 235 | 235 | 233 | 205 |
| - CO2 | 175 | 175 | 191 | 191 | 189 |
Figure 4.
Typical negative ESI MS/MS spectra of OA (a), metabolite 1 (b), 3 (c) and 4 (d).
In the MS2 spectra of m/z 819 from metabolites 2 and 3 (Fig. 4c), m/z 563 and 255 are replaced by m/z 579 and 271, suggesting that a hydroxylation occurred in fragment A of metabolites 2 and 3. The MS2 spectrum of m/z 817 from minor metabolite 4 is shown in Fig. 4d. Two major ions at m/z 577 and 269 were observed representing a difference of two protons when compared to fragment A from metabolites 2 and 3. This suggested the oxidation to a carbonyl in Fragment A of metabolite 4.
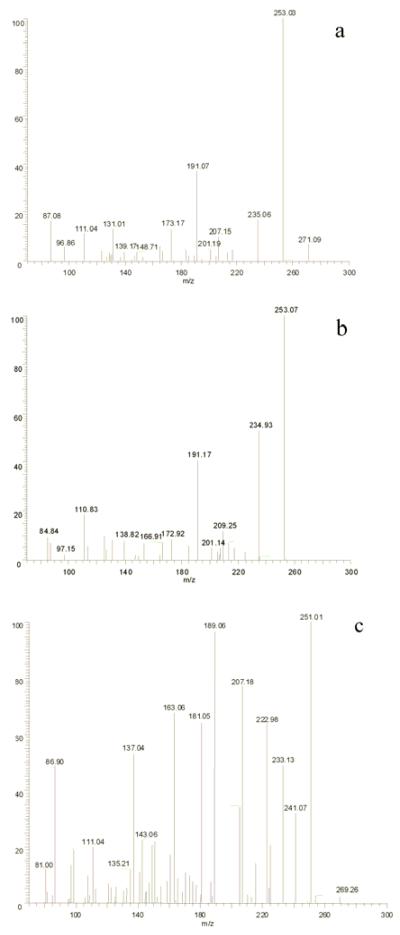
The relationship between metabolites 2 and 4 was established by chemical interconversions. Metabolite 2 was converted quantitatively to metabolite 4 by treatment with activated MnO2 (Fatiadi, 1976). Furthermore, Luche reduction (Gemal and Luche, 1981) of metabolite 4 provided metabolite 2 exclusively. These chemical transformations established unequivocally that metabolite 2 is an allylic alcohol, metabolite 4 is an α,β-unsaturated carbonyl and that metabolites 2 and 4 resulted from oxidation of OA at the same carbon. Inspection of OA identifies two allylic positions in fragment A: C-11 and C-43. The MS3 spectrum of fragment A (m/z 269) from metabolite 4 (Fig. 5c and Table 2) yielded a fragment of m/z 241 (-28 amu) which was not present in OA or any of the other metabolites. This represents a loss of CO, indicating that metabolite 4 must have a keto group at C11.
Figure 5.
MS3 spectra of fragment A from metabolite 2 (a), 3 (b) and 4 (c) in negative ESI mode.
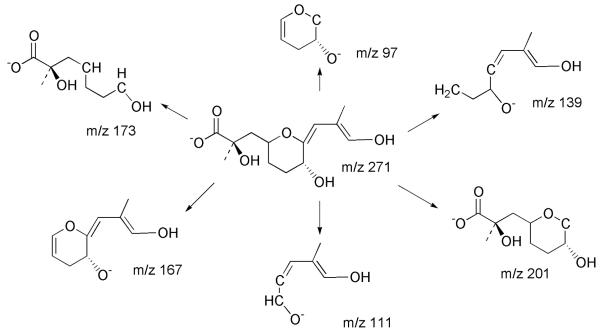
The presence of fragment ions at m/z 201, 173, 167, 139, 111, 97 in the MS3 spectra (from m/z 271) of metabolites 2 and 3 (Fig. 5a, 5b), and their identical fragmentation patterns (Fig. 6) indicate that these two metabolites must be stereoisomers. The fact that Luche reduction of metabolite 4 failed to produce metabolite 3 may be result of the conformational bias of the B ring. In solution, the B-ring of OA adopts a chair conformation with the alkyl groups equatorial (Matsumori, et al., 1995). The preferred axial attack of NaBH4 on the C-11 ketone will yield the equatorial alcohol. Therefore, the configuration of the hydroxyl group at C-11 in metabolite 2 is assigned 11S. While metabolite 2 was oxidized completely to 4 by activated MnO2, metabolite 3 was not oxidized under the same conditions. A stereochemical effect has been observed previously in the MnO2 oxidation of 2-eno-pyranosides (Fraser-Reid, et al., 1971). Equatorial alcohols were readily oxidized whereas axial alcohols were resistant to oxidation. An axial orientation of the 11-hydroxyl group of metabolite 3 would require that metabolite 3 has the 11R configuration.
Figure 6.
Proposed MS3 fragmentation pathways of m/z 271 from metabolites 2 and 3 in negative ESI mode.
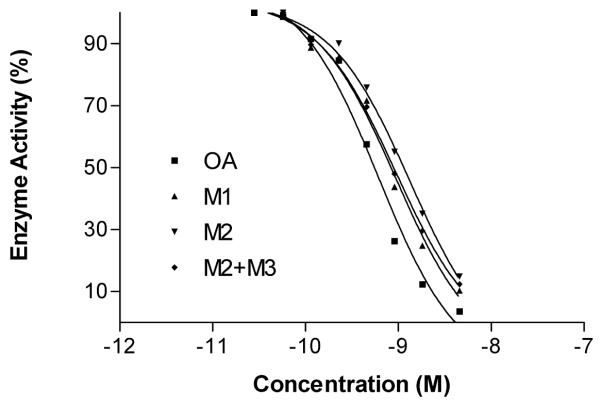
Two major metabolites 1 and 2 were analyzed for protein phosphatase inhibition. We were unable to isolate pure metabolite 3, however a mixture of 2 and 3 (54%: 46%) was also analyzed for protein phosphatase inhibition. The dose response curves for OA and it metabolites are shown in Fig. 7. As can be seen, OA strongly inhibited PP2A, with an IC50 of 0.61 nM. The calculated IC50 values for metabolites were only slightly higher than that of OA; 0.94 nM for metabolite 1; 1.34 nM for metabolite 2; 0.95 nM for a mixture of 2 and 3, respectively. The crystal structure of PP2A bound to OA, shows that the F and G-rings of OA are located in a hydrophobic binding pocket (Xing, et al., 2006). The site of oxidation for metabolite 1 is probably not deep in this pocket, as the IC50 for metabolite 1 is similar to that of OA. Metabolites 2 and 3 have the hydroxyl group oriented toward and away from the enzyme, respectively and the relative IC50s are consistent with this observation.
Figure 7.
The dose-response inhibitory activity of OA and its metabolites on PP2A .
In conclusion, four human metabolites of OA have been prepared by incubation with CYP3A4 or CYP3A5. The metabolites were also formed upon incubation with pooled human liver microsomes. The cytochrome P450s that we examined are responsible for the majority of xenobiotic metabolism in human liver. However, it is important to note that other cytochrome P450s not tested could also be involved in the metabolism of OA. Because the small quantities of metabolites obtained preclude NMR studies, these metabolites have been tentatively characterized by a combination of MSn experiments and chemical transformations. The inhibition of PP2A by three of the four metabolites is only slightly lower than OA, suggesting that these transformations do not significantly detoxify OA. However, given that the LD50 for OA with various liver cell lines ranges from 10-100 nM (depending on cell line) (Souid-Mensi, et al., 2008), it seems unlikely that these metabolites play a significant role in the toxicity of OA. Currently these reactions are being scaled up and metabolites will be evaluated for their toxicity. This work represents the preliminary steps toward a more thorough understanding of the metabolic fate, disposition and toxicity of OA and its metabolites.
Acknowledgments
This work was supported by the National Institute of Environmental Health Sciences (NIEHS) Grant S11 ES11181, the NSF-NIEHS Oceans and Human Health Center Program (National Science Foundation grant 0432368 and NIEHS grant P50 ES12736-01).
Footnotes
Publisher's Disclaimer: This is a PDF file of an unedited manuscript that has been accepted for publication. As a service to our customers we are providing this early version of the manuscript. The manuscript will undergo copyediting, typesetting, and review of the resulting proof before it is published in its final citable form. Please note that during the production process errors may be discovered which could affect the content, and all legal disclaimers that apply to the journal pertain.
Conflict of interest
The authors declare that there are no conflicts of interest.
References
- Carvalho Pinto-Silva CR, Ferreira JF, Costa RHR, Belli Filho P, Creppy EE, Matias WG. Micronucleus induction in mussels exposed to okadaic acid. Toxicon. 2003;41(1):93–97. doi: 10.1016/s0041-0101(02)00214-3. [DOI] [PubMed] [Google Scholar]
- Cresteil T, Monsarrat B, Dubois J, Sonnier M, Alvinerie P, Gueritte F. Regioselective metabolism of taxoids by human CYP 3A4 and 2C8: structure-activity relationship. Drug Metab. Dispos. 2002;30(4):438–445. doi: 10.1124/dmd.30.4.438. [DOI] [PubMed] [Google Scholar]
- Dilmaghanian S, Gerber JG, Filler SG, Sanchez A, Gal J. Enantioselectivity of inhibition of cytochrome p450 3A4 (CYP3A4) by ketoconazole: testosterone and methadone as substrates. Chirality. 2004;16(2):79–85. doi: 10.1002/chir.10294. [DOI] [PubMed] [Google Scholar]
- Dounay AB, Forsyth CJ. Okadaic acid: the archetypal serine/threonine protein phosphatase inhibitor. Curr. Med. Chem. 2002;9(22):1939–1980. doi: 10.2174/0929867023368791. [DOI] [PubMed] [Google Scholar]
- Fatiadi AJ. Active manganese dioxide oxidation in organic chemistry - part I. Synthesis. 1976;1976(2):65–104. [Google Scholar]
- Fessard V, Grosse Y, Pfohl-Leszkowicz A, Puiseux-Dao S. Okadaic acid treatment induces DNA adduct formation in BHK21 C13 fibroblasts and HESV keratinocytes. Mutat. Res. 1996;361(23):133–141. doi: 10.1016/s0165-1161(96)90248-4. [DOI] [PubMed] [Google Scholar]
- Fraser-Reid B, Carthy BJ, Holder NL, Yunker M. An apparent stereochemical effect in MnO2 oxidation of some allylic alcohols. Can. J. Chem. 1971;49(18):3038–3045. [Google Scholar]
- Fujiki H, Suganuma M. Tumor promotion by inhibitors of protein phosphatases 1 and 2A: the okadaic acid class of compounds. Adv. Cancer Res. 1993;61(1):143–194. doi: 10.1016/s0065-230x(08)60958-6. [DOI] [PubMed] [Google Scholar]
- Gehringer MM. Microcystin-LR and okadaic acid-induced cellular effects: a dualistic response. FEBS Lett. 2004;557(13):1–8. doi: 10.1016/s0014-5793(03)01447-9. [DOI] [PubMed] [Google Scholar]
- Gemal AL, Luche JL. Lanthanoids in organic synthesis. 6. The reduction of α-enones by sodium borohydride in the presence of lanthanoid chlorides: synthetic and mechanistic aspects. J. Am. Chem. Soc. 1981;103(18):5454–5459. [Google Scholar]
- Gerssen A, Mulder P, Rhijn HV, Boer JD. Mass spectrometric analysis of the marine lipophilicbiotoxins pectenotoxin-2 and okadaic acid by four different types of mass spectrometers. J. Mass. Spectrom. 2008;43(8):1140–1147. doi: 10.1002/jms.1407. [DOI] [PubMed] [Google Scholar]
- Haystead TAJ, Sim ATR, Carling D, Honnor RC, Tsukitani C, Cohen P, Hardie G. Effects of the tumour promoter okadaic acid on intracellular protein phosphorylation and metabolism. Nature. 1989;337(1):78–81. doi: 10.1038/337078a0. [DOI] [PubMed] [Google Scholar]
- Hu T, Marr J, Defreitas ASW, Quilliam MA, Walter JA, Wright JLC. New diol esters isolated from cultures of the dinoflagellates Prorocentrum lima and Prorocentrum concavum. J. Nat. Prod. 1992;55(11):1631–1637. [Google Scholar]
- Ito E, Yasumoto T, Takai A, Imanishi S, Harada K. Investigation of the distribution and excretion of okadaic acid in mice using immunostaining method. Toxicon. 2002;40(2):159–165. doi: 10.1016/s0041-0101(01)00207-0. [DOI] [PubMed] [Google Scholar]
- Krauser JA, Voehler M, Tseng LH, Schefer AB, Godejohann M, Guengerich FP. Testosterone 1β-hydroxylation by human cytochrome P450 3A4. Eur. J. Biochem. 2004;271(19):3962–3969. doi: 10.1111/j.1432-1033.2004.04339.x. [DOI] [PubMed] [Google Scholar]
- Le Hegarat L, Fessard V, Poul JM, Dragacci S, Sanders P. Marine toxin okadaic acid induces aneuploidy in CHO-K1 cells in presence of rat liver postmitochondrial fraction, revealed by cytokinesis-block micronucleus assay coupled to FISH. Environ. Toxicol. 2004;19(2):123–128. doi: 10.1002/tox.20004. [DOI] [PubMed] [Google Scholar]
- Le Hegarat L, Puech L, Fessard V, Poul JM, Dragacci S. Aneugenic potential of okadaic acid revealed by the micronucleus assay combined with the FISH technique in CHO-K1 cells. Mutagenesis. 2003;18(3):293–298. doi: 10.1093/mutage/18.3.293. [DOI] [PubMed] [Google Scholar]
- Lewis DFV. Guide to cytochromes P450 structure and function. CRC Press; Boca Raton, FL: 2001. [Google Scholar]
- Leclercq I, Desager JP, Vandeplas C, Horsmans Y. Fast determination of low-level cytochrome P-450 1A1 activity by high-performance liquid chromatography with fluorescence or visible absorbance detection. J. Chromatogr. B. 1996;681(2):227–232. doi: 10.1016/0378-4347(95)00543-9. [DOI] [PubMed] [Google Scholar]
- Luckas B, Dahlmann J, Erler K, Gerdts G, Wasmund N, Hummert C, Hansen PD. Overview of key phytoplankton toxin and their recent occurrence in the North and Baltic Seas. Environ. Toxicol. 2005;20(1):1–17. doi: 10.1002/tox.20072. [DOI] [PubMed] [Google Scholar]
- Marr JC, Hu T, Pleasance S, Quilliam MA, Wright JLC. Detection of new 7-O-acyl derivatives of diarrhetic shellfish poisoning toxins by liquid chromatography-mass spectrometry. Toxicon. 1992;30(12):1621–1630. doi: 10.1016/0041-0101(92)90034-3. [DOI] [PubMed] [Google Scholar]
- Matias WG, Creppy EE. Evidence for enterohepatic circulation of okadaic acid in mice. Toxic Subst. Mech. 1996;15(4):405–414. [Google Scholar]
- Matias WG, Traore A, Creppy EE. Variations in the distribution of okadaic acid in organs and biological fluids of mice related to diarrhoeic syndrome. Hum. Exp. Toxicol. 1999;18(5):345–350. doi: 10.1191/096032799678840156. [DOI] [PubMed] [Google Scholar]
- Matsumori N, Murata M, Tachibana K. Conformational analysis of natural products using long-range carbon-proton coupling constants: three dimensional structure of okadaic acid in solution. Tetrahedron. 1995;51(45):12229–12238. [Google Scholar]
- Paz B, Daranas AH, Cruz PG, Franco JM, Napolitano JG, Norte M, Fernandez JJ. Identification and characterization of DTX-5c and 7-hydroxymethyl-2-methylene-octa-4,7-dienyl okadaate from Prorocentrum belizeanum cultures by LC-MS. Toxicon. 2007;50(4):470–478. doi: 10.1016/j.toxicon.2007.04.011. [DOI] [PubMed] [Google Scholar]
- Peter R, Bocker R, Beaune PH, Iwasaki M, Guengerich FP, Yang CS. Hydroxylation of chlorzoxazone as a specific probes for human liver cytochrome P-450IIE1. Chem. Res. Toxicol. 1990;3(6):566–573. doi: 10.1021/tx00018a012. [DOI] [PubMed] [Google Scholar]
- Pfohl-Leszkowicz A, Fessard F, Puiseux-Dao S. Implication of okadaic acid on DNA adduct formation and EROD activity; Mycotoxins and Phycotoxins - Developments in chemistry, Toxicology and Food Safety, Proceedings of the 9th international IUPAC Symposium on Mycotoxin and Phycotoxin; Rome, Italy. 27-31 May 1996; 1998. pp. 569–576. Alaken, Fort Collins, CO, USA. [Google Scholar]
- Simon JF, Vernoux JP. Highly sensitive assay of okadaic acid using protein phosphatase and paranitrophenyl phosphate. Natural Toxins. 1994;2(5):293–301. doi: 10.1002/nt.2620020508. [DOI] [PubMed] [Google Scholar]
- Souid-Mensi G, Moukha S, Mobio TA, Maaroufi K, Creppy EE. The cytotoxicity and genotoxicity of okadaic acid are cell-line dependent. Toxicon. 2008;51(8):1338–1344. doi: 10.1016/j.toxicon.2008.03.002. [DOI] [PubMed] [Google Scholar]
- Tohda H, Nagao M, Sugimura T, Oikawa A. Okadaic acid, a protein phosphatase inhibitor, induces sister-chromatid exchanges depending on the presence of bromodeoxyuridine. Mutat. Res. 1993;289(2):275–280. doi: 10.1016/0027-5107(93)90078-t. [DOI] [PubMed] [Google Scholar]
- Torgersen T, Wilkins AL, Rundberget T, Miles CO. Characterization of fatty acid esters of okadacid acid and related toxins in blue mussels (Mytilus edulis) from Norway. Rapid Commun. Mass Spectrom. 2008;22(8):1127–1136. doi: 10.1002/rcm.3490. [DOI] [PubMed] [Google Scholar]
- Tubaro A, Florio C, Luxich E, Sosa S, Loggia RD, Yasumoto T. A protein phosphatase 2A inhibition assay for a fast and sensitive assessment of okadaic acid contamination in mussels. Toxicon. 1996;34(7):743–752. doi: 10.1016/0041-0101(96)00027-x. [DOI] [PubMed] [Google Scholar]
- Vale P, Sampayo MMM. Esters of okadaic acid and dinophysis toxin-2 in Portuguese bivalves related to human poisonings. Toxicon. 1999;37(8):1109–1121. doi: 10.1016/s0041-0101(98)00247-5. [DOI] [PubMed] [Google Scholar]
- Vale P, Sampayo MMM. Esterification of DSP toxins by Portuguese bivalves from the northwest coat determined by LC-MS - a widespread phenomenon. Toxicon. 2002;40(1):33–42. doi: 10.1016/s0041-0101(01)00183-0. [DOI] [PubMed] [Google Scholar]
- Windust AJ, Hu T, Wright JLC, Quilliam MA, McLachlan JL. Oxidative metabolism by Thalassiosira weissflogii (Bacillariophyceae) of a diol-ester of okadaic acid, the diarrhetic shellfish poisoning. J. Phycol. 2000;36(2):342–350. [Google Scholar]
- Xing Y, Xu Y, Chen Y, Jeffrey PD, Chao Y, Lin Z, Li Z, Strack S, Stock JB, Shi Y. Structure of protein Phosphatase 2A core enzyme bound to tumor-inducing toxins. Cell. 2006;12(2):341–353. doi: 10.1016/j.cell.2006.09.025. [DOI] [PubMed] [Google Scholar]
- Yamazaki H, Inoue K, Shaw PM, Checovich WJ, Guengrich FP, Shimada T. Different contributions or cytochrome P450 2C19 and 3A4 in the oxidation of omeprazole by human liver microsomes: effects of contents of these two forms in individual human samples. J. Pharmacol. Exp. Ther. 1997;283(2):434–442. [PubMed] [Google Scholar]
- Yasumoto T, Murata M. Marine Toxins. Chem. Rev. 1993;93(5):1897–1909. [Google Scholar]
- Yu AM, Idle JR, Krausz KW, Kupfer A, Gonzalez FJ. Contribution of individual cytochrome P450 isozymes to the O-demethylation of the psychotropic β-carboline alkaloids harmaline and harmin. J. Pharmacol. Exp. Ther. 2003;305(1):315–322. doi: 10.1124/jpet.102.047050. [DOI] [PubMed] [Google Scholar]


