Abstract
We conducted 31P NMR kinetic studies and 1H-diffusion measurements on myosin-catalyzed hydrolysis of adenosine triphosphate (ATP) under varied conditions. The data elucidate well the overall hydrolysis rate and various factors that significantly impact the reaction. We found that the enzymatic hydrolysis of ATP to adenosine diphosphate (ADP) was followed by ADP hydrolysis, and different nucleotides such as ADP and guanosine triphosphate (GTP) acted as competitors of ATP. Increasing ATP or Mg2+ concentration resulted in decreased hydrolysis rate, and such effect can be related to the decrease of ATP diffusion constants. Below 50°C, the hydrolysis was accelerated by increasing temperature following the Arrhenius’ law, but the hydrolysis rate was significantly lowered at higher temperature (~60°C), due to the thermal-denaturation of myosin. The optimal pH range was around pH 6–8. These results are important for characterization of myosin-catalyzed ATP hydrolysis, and the method is also applicable to other enzymatic nucleotide reactions.
Keywords: ATP, myosin, hydrolysis, 31P NMR, 1H-diffusion
Introduction
Myosin is a major structural component of muscle fibers. It serves as an enzyme catalyst for hydrolysis of adenosine triphosphate (ATP), from which energy is transduced into adjoining movements of myosin and actin filaments to generate muscle contraction. X-ray crystallography shows that the binding site of nucleotide is located at the globular head of myosin, called subfragment-1; during ATP hydrolysis, myosin experiences a conformational change corresponding to two distinct structures, i.e. “open state” and “closed state”, in the binding pocket [1–5].
It has been established that mechanism of myosin catalyzed ATP hydrolysis consists of seven steps [6]. A simplified version describing the major steps can be written as:
| (1) |
where M is myosin; M* and M** stand for different conformations of myosin in ATP or ADP bound state; Pi is inorganic phosphate. In general, the first two steps above (i.e. ATP binding to myosin and subsequent hydrolysis) are considered as fast equilibriums, while conformational change between M**·ADP·Pi and M*·ADP·Pi is the slow, rate-limiting step. For different myosin super-family members, however, the rate-limiting step can be varied [7].
A variety of techniques have been applied to kinetic studies of myosin catalyzed ATP hydrolysis. For instance, conformational transition of nucleotide-bound myosin, as well as reaction rate, can be investigated by monitoring changes of intrinsic protein tryptophan fluorescence, or by analyzing the H+ release and oxygen exchange between γ-phosphate and water during the hydrolysis [6, 8–14]. Molecular simulations in conjunction with X-ray analyses and quantum calculations are powerful for revealing the process [15–19]. The hydrolysis rate and mechanism may strongly depend on structures of ATP or myosin such as different nucleotide derivatives and myosin isomers or mutants [8, 20–24], the reaction is also dependent on various factors including temperature, pH, ionic strengths, inhibition agents and solvents, etc. [14, 25–28]. However, a lot of details remain unclear and need to be further explored.
In this publication, we present a 31P NMR characterization of myosin catalyzed ATP hydrolysis. In contrast to other methods that mainly focus on the kinetics in each individual step, this 31P NMR method provides a clear assessment for the overall reaction rate and outcome. We acquired various 31P kinetic spectra in order to derive the apparent hydrolysis rate constants and to elucidate several important factors that impact the enzymatic hydrolysis, including ATP concentration, temperature, pH and Mg2+ concentration. In addition, some 1H NMR pulsed-field-gradient (PFG) diffusion measurements were performed, from which ATP diffusion constants were derived and correlated with ATP hydrolysis rates under varied ATP or Mg2+ concentrations.
Experimental
All chemicals including ATP and calcium-activated myosin from chicken muscle (dissolved in aqueous glycerol solution) were purchased from Sigma-Aldrich; these analytical grade chemicals were used without further purification. NMR samples were prepared in D2O solution for purpose of field-lock, with fixed quantity of myosin (0.79 mg protein in 0.1 ml glycerol solution) but varied nucleotide concentrations (typically 5 –20 mM) or Mg2+ (0–50 mM). Sample pH was adjusted using NaOH and HCl.
NMR experiments were conducted using JEOL ECX-300 spectrometer and a 5 mm broadband auto-tune probe. 31P kinetic spectra were obtained with a π/2 pulse of 10.75 μs, 128 scans and 3 s repetition delay at certain preset timings (acquiring one spectral slice per hour for maximum 18 hours in total). The kinetic spectra were analyzed by integrating β-peak and graphing Sβ or ln Sβ vs. time. 1H-PFG diffusions of ATP were measured by the standard STE pulse sequence, with π/2 pulse of 11.7 μs, diffusion time (Δ) of 100 ms, gradient-pulse duration (δ) of 5 ms, gradient-pulse strength (G) of 0.003 to 0.283 Tesla/m (incremented in 10 steps), 16 scans and 10 s repetition delay. The major peaks in 1H diffusion spectra were integrated; by linear fitting of ln S vs. G2, ATP diffusion constants were deduced as D = slope/[−γ2δ2 (Δ− δ/3)], where γ is the magnetogyric ratio of proton. We found that it was necessary to use peak integrals instead of heights for sufficiently accurate data fitting (with correlation coefficients R >0.99) in both kinetic and diffusion analyses.
Results and discussion
A. 31P spectral features
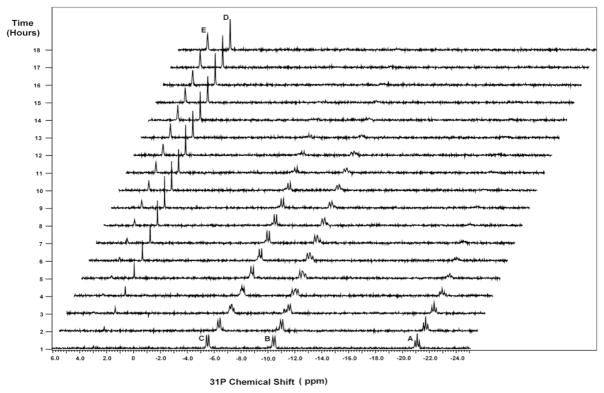
Fig. 1 shows a representative kinetic spectrum of myosin catalyzed ATP, obtained with 5 mM ATP at pH 7.0, 21 °C and specified timings. Across the spectral slices, there are totally 5 distinct peak positions, assigned as A (β-ATP), B (α-ATP and α-ADP), C (γ-ATP and β-ADP), D (Pi) and E (AMP), respectively. Notice that ADP, Pi and AMP are the intermediate or final products of the reaction. These spectral signals arise from the phosphate species in myosin-unbound state. As expected, peaks of myosin-bound phosphates are not observable here, because low quantity of myosin was used, and moreover, myosin-bound phosphates would have extremely low sensitivity due to peak broadening [29, 30].
Figure 1.
A representative 31P kinetic spectrum of myosin catalyzed ATP, obtained with 5 mM ATP at pH 7.0 and 21°C. The vertical axis shows timings for spectral acquisition. The peaks are assigned as: A (β-ATP); B (α-ATP and α-ADP); C (γ-ATP and β-ADP); D (Pi); E (AMP). The ATP hydrolysis can be characterized by decline of β-ATP. Subsequent ADP hydrolysis is also observable from the spectrum.
The 31P kinetic spectrum gives us a clear picture of the entire process. The β-peak (A) of ATP is well resolved; therefore ATP hydrolysis can be unambiguously analyzed from decline ofβ-ATP over the time. In this example, peak A is almost vanished after ~6 hours, indicating that ATP is fully consumed at this time. Although the resulting ADP has its α- and β-peak partially overlapping with α-, γ-ATP (peaks B and C), we can still discern their peak intensity changes. In particular, it is found from these spectral slices that myosin can subsequently catalyze ADP hydrolysis as well, thus peak B and peak C continue to diminish until they become almost null after 13 hours. Throughout the entire process, declines of ATP and ADP peaks are also accompanied by steady increases of free Pi (D) and AMP (E) peaks, which continue to grow even after ATP and ADP peaks (A, B and C) are all vanished. This suggests that releases of Pi and AMP from myosin are somewhat retarded as compared to ATP and ADP hydrolysis.
B. Competitive nucleotide hydrolysis
It is well known that in vivo the cyclic association-dissociation process of muscle proteins myosin and actin, driven by ATP hydrolysis, does not involve ADP hydrolysis; instead the product ADP is released from myosin following binding of actin to myosin [31]. Therefore, subsequent ADP hydrolysis found in our investigation was initially unexpected to us. To confirm that it is the true outcome, we extended the investigation by using three nucleotides (ATP, ADP and GTP) for further kinetic measurements.
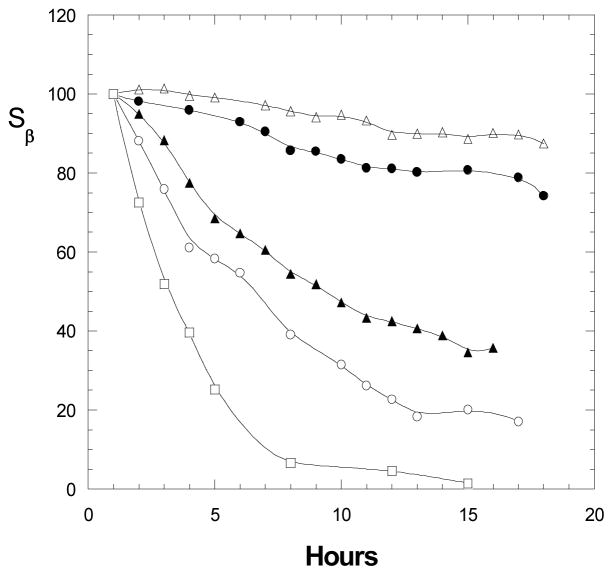
Fig. 2 compares data obtained from myosin-catalyzed hydrolysis of ATP, ADP and GTP under same sample conditions. From declines of β-peak over time, it can be concluded that (i) myosin has different capacities to catalyze hydrolysis of all three nucleotides, with hydrolysis rates: ADP > ATP > GTP; (ii) presence of ADP or GTP in ATP sample would reduce ATP hydrolysis rate, probably due to an enzyme-binding competition between two nucleotide substrates (ATP-ADP or ATP-GTP), and the competitiveness is ADP > GTP. We anticipate that myosin catalyzed ADP or GTP hydrolysis may also follow a similar mechanism as the ATP hydrolysis, shown in Eq. 1.
Figure 2.
Myosin catalyzed hydrolysis of nucleotides (ATP, ADP, GTP), described by declined β-peak over time. The 31P spectra were measured using nucleotide samples (5 mM each) in presence of 0.79 mg myosin at pH 7.0 and 25°C. (□): ADP; (○): ATP; (△): GTP; (●): ATP in presence of ADP; (▲): ATP in presence of GTP.
C. Effect of ATP concentration
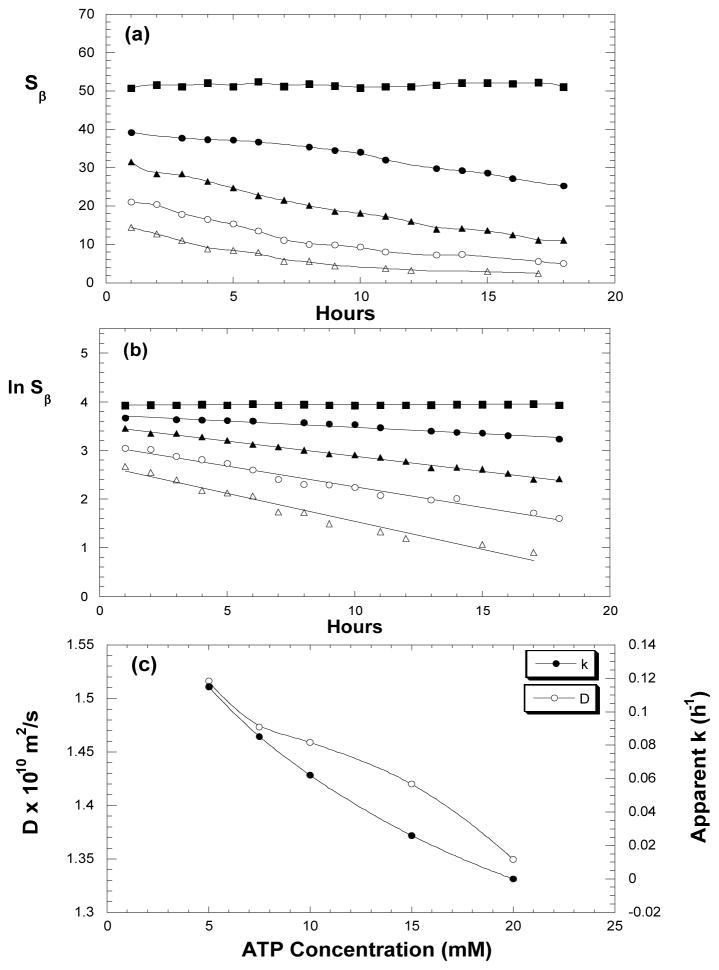
The 31P kinetic spectra acquired under varied ATP concentrations show clear effect of nucleotide concentration on the hydrolysis. Figs. 3a and 3b describe respectively how β-peak (Sβ) and its natural logarithm (ln Sβ) decline over time under initial ATP concentrations of 5, 7.5, 10, 15 or 20 mM. The linear relationships in Fig. 3b suggest that the overall hydrolysis rate is of pseudo first order. This result also implies that the forward reaction in rate limiting step of Eq. 1 (i.e. M**·ADP·Pi ⇌ M* ·ADP·Pi ) must be predominant and its reverse reaction is relatively insignificant.
Figure 3.
Effect of sample concentrations on myosin catalyzed ATP hydrolysis. (a) Declines of β-peak over time with initial ATP concentrations of 5 mM (△), 7.5 mM (○), 10 mM (▲), 15 mM (●), and 20 mM (■). (b) Linear relationships of natural logarithms of β-signals vs. time. From the slopes, the apparent rate constants (k) are obtained. (c) Diffusion constants (○) of ATP and apparent rate constants (●) of myosin catalyzed ATP hydrolysis.
From straight-lines in Fig. 3b, the apparent rate constants (k= − slope) can be obtained as 0.115, 0.085, 0.062, 0.026 h−1 for samples with initial concentration [ATP]0 = 5, 7.5, 10, 15 mM respectively, while the sample with 20 mM ATP has no appreciable hydrolysis within the experimental time. It is evident here that an increase in initial ATP concentration is unfavorable to the hydrolysis. In contrast, for dilute ATP solutions (< 400 μM), an increase of ATP concentration was found to accelerate the binding rate of ATP on myosin [32].
To understand why a higher initial ATP concentration leads to slower hydrolysis in our case, we separately measured self-diffusions of ATP (without myosin) under varied ATP concentrations. Fig. 3c compares the diffusion constants (D) of ATP in 5, 7.5, 10, 15, or 20 mM solutions.
It has been known that molecular self-diffusion is inversely related to the apparent molecular mass and viscosity [33]. So the results in Fig. 3c are well anticipated. Increases of ATP concentration give rise to lowered diffusion constants, apparently due to enhanced sample viscosity at higher concentration, and an increased tendency to form ATP dimer (~10 % dimer can be formed in a 20 mM nucleotide solution, according to Sigel et al. [36]) More importantly, the variations of diffusion constants are in consistence with the trend regarding the apparent rate constants (k), as shown in Fig. 3c. The correlation suggests that the slower enzymatic hydrolysis at higher ATP concentration in our case must be mainly due to increased sample viscosity and reduced molecular mobility, as well as increased ATP dimer, which affect the reactant binding to myosin and the product release, retarding the overall hydrolysis rate.
D. Other factors impacting the reaction
(i) Temperature
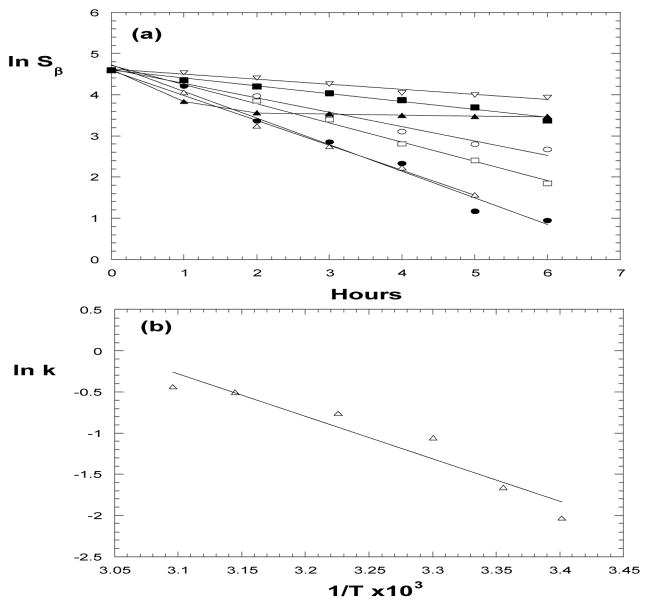
It was reported that increase of temperature dramatically favored the product (ADP and Pi) release in an ATP hydrolysis catalyzed by a monomeric conformer (called 10S) of smooth muscle myosin [14]. Temperature change was also found to induce a conformational/phase transition of ATP-bound myosin subfragment-1 around 12°C [34]. To explore how temperature may impact ATP hydrolysis in our sample conditions, we conducted 31P kinetic measurements at 21°C (room temperature), 37°C (physiologically relevant) and some other temperature up to 60°C; the data are shown in Fig. 4a. At temperature ≤ 50°C, the natural logarithms of β-peak (ln Sβ) vs. time are all linear, and the apparent rate constants (k= −slope) can be evaluated as 0.124 (21°C), 0.190 (25°C), 0.348 (30°C), 0.467 (37°C), 0.605 (45°C), 0.646 (50°C), respectively. Clearly, the hydrolysis is accelerated due to temperature elevation in this range. At 60°C, however, the reaction slows down within the first 2 hours. We believe that a myosin thermal-denaturation occurs around this temperature. We also repeated the measurement after cooling the denatured sample to room temperature, and noticed that the lost ATPase capacity was not recovered. This suggests that the thermal-denaturation of myosin around 60 °C is irreversible.
Figure 4.
(a) Temperature dependence of myosin catalyzed ATP hydrolysis. (a) ln Sβ vs. time at 21°C (▽), 25°C (■), 30°C (○), 37°C (□), 45°C (△), 50°C (●), 60°C (▲). From slopes of straight lines, the apparent rate constants (k) are obtained. (b) The Arrhenius plot of natural logarithms of k vs. 1/T, from which the apparent activation energy is evaluated.
Fig. 4b shows the Arrhenius plot of ln k vs. 1/T for the data set in 21–50 °C range. By linear fitting, the apparent activation energy (Ea = − slope × 8.314) can be calculated as 43 kJ/mol. According to Grigorenko and coworkers, an activation barrier of ~61 kJ/mol was considered in their molecular simulations as the upper limit for the entire process of myosin catalyzed ATP hydrolysis [16]. On the other hand, for another related type of reactions, the protein kinase involved phosphoryl transfer reactions with predominantly dissociative mechanism, where rate-limiting is the product release, an activation energy of 29–46 kJ/mol was proposed by Valiev et al. and was adopted in their quantum-based modeling [35]. Our 31P NMR derived Ea value is within this range, which may imply that the rate-limiting step under our sample condition is the product release.
(ii) pH
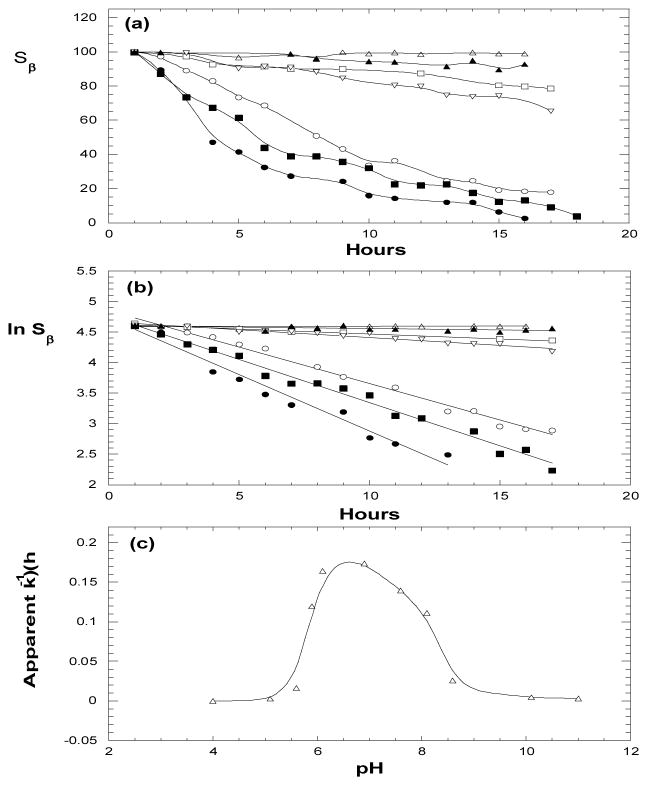
Myosin catalyzed ATP hydrolysis is also pH-dependant. Figs. 5a and 5b show respectively Sβ and ln Sβ vs. time for ATP samples under varied pH. From straight lines in Fig. 5b, the apparent hydrolysis rate constants (k) are obtained, and are plotted as function of pH in Fig. 5c. It is evident that the hydrolysis is favored in pH range 6–8. At pH ≤ 4–5 or pH ≥ 9–10, however, the hydrolysis is almost completely ceased, probably due to a pH-induced myosin denaturation. We also found that the lost ATPase capacity could not be recovered even after the denatured samples were returned to neutral pH, suggesting that the pH-induced myosin denaturation is irreversible as well.
Figure 5.
Effect of sample pH on myosin catalyzed ATP hydrolysis. (a) β-peak vs. time at pH 4.0 (△), 5.6 (□), 5.9 (○), 6.9 (●), 7.6 (■), 8.6 (▽) and 10.1 (▲). (b) ln Sβ) vs. time, from which the apparent rate constants k are obtained. (c) The apparent rate constants under varied pH.
It has been recognized that several amino acid residues in ATPase pocket play a key role in myosin catalyzed ATP hydrolysis, which includes interaction of Lys185 with β- and γ-phosphate; coordination of Thr186 and Ser237 with cation; Arg238 and Glu459 serving as the gate of ATPase pocket; while a water molecule nucleophilically attacks the γ-phosphate [16, 18, 19]. Notice that Lys, Thr and Arg can be deprotonated at elevated pH (with pKa values in pH range 10–12) while Glu can be protonated at lowered pH (with pKa = 4.4). We believe that the protonation/deprotonation of these key amino acids at low or high pH may significantly change conformations of myosin and its interactions with ATP and water, thus inhibiting the ATPase activity.
(iii) Mg2+ concentration
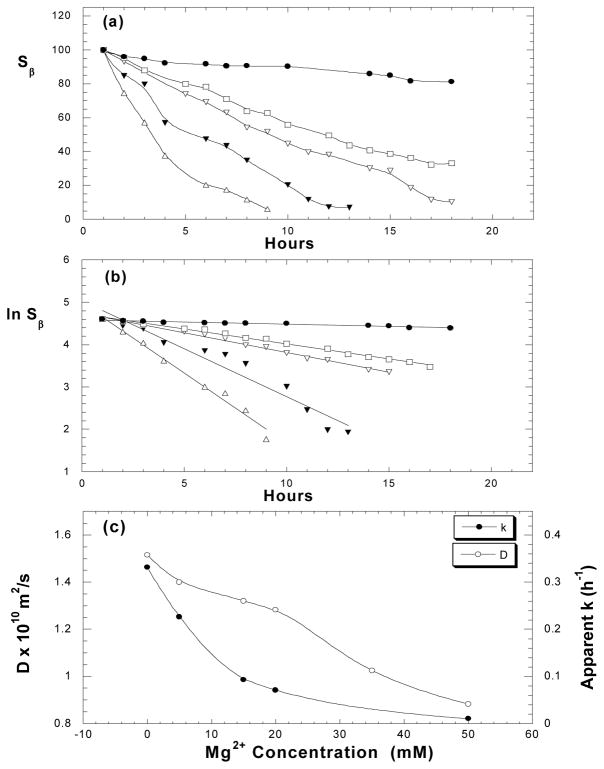
The 1:1 binding of Mg2+ to ATP plays an important role in regulation of myosin catalyzed ATP hydrolysis in vivo, primarily due to unique location of bound Mg2+ in the ATPase pocket [16, 18, 19]. However, it is unclear how Mg2+ concentration would impact the ATP hydrolysis if excess amount of Mg2+ exists. To explore this issue, we measured kinetic spectra of ATP under varied Mg2+ concentrations; the results are shown in Fig. 6. From Sβ curves (Fig. 6a) and linear relationships of ln S vs. time (Fig. 6b), it is evident that the enzymatic hydrolysis of ATP is slowed down at increased Mg2+ concentration, leading to decreased apparent rate constants (k= −slope in Fig. 6b). From independent 1H-diffusion measurements of ATP under varied Mg2+ concentrations, it is confirmed that ATP diffusion constant (D) decreases as Mg2+ concentration increases, and this trend is also in consistence with the trend for the apparent rate constants (Fig. 6c).
Figure 6.
Effect of Mg2+ ionic strength on myosin catalyzed ATP hydrolysis. (a) β-peak vs. time measured with 5 mM ATP samples in 0 mM (△), 5 mM (▼;), 15 mM (▽), 20 mM (□), 50 mM (●) of MgCl2 solutions at pH 7.0 and 25°C. (b) ln Sβ vs. time, from which the apparent rate constants k are obtained. (c) Diffusion constants (○) of ATP and apparent rate constants (●) of myosin catalyzed ATP hydrolysis, measured with 5 mM ATP under varied MgCl2 concentrations.
Although Mg2+ coordination to ATP could significantly reduce the repulsion between negatively charged triphosphate chains, Mg2+ ion may actually facilitate ATP association by its intermolecular bridging via different phosphate chains [36]. We believe that slower ATP diffusion under increased Mg2+ concentration indicates an increased tendency of Mg2+-induced ATP association. For instance, the diffusion constants of two Mg-ATP samples, with equal molar Mg2+ and ATP (5mM) or excess amount of Mg2+ (50 mM), are approximately in 1.6:1 ratio, probably due to a significant percentage of ATP dimer in the latter. Increased ATP association is definitely unfavorable to the hydrolysis. It was proposed for cation (M) involved ATP hydrolysis that ATP must be in monomer structure with two cations bound in M(α,β)–M(γ) fashion prior to the hydrolysis, while a tridentate binding of M (α, β, γ) or ATP dimer would inhibit the hydrolysis [36–38]. This may explain why the myosin catalyzed ATP hydrolysis is slowed down when Mg2+ concentration is increased.
In conclusion, our 31P NMR kinetic data, in conjunction with 1H diffusion measurements, well elucidate the overall rate of myosin catalyzed ATP hydrolysis and various factors that significantly impact the reaction. These results are important for advancing the studies on ATP hydrolysis. The method presented here can be applied to other enzymatic nucleotide reactions as well.
Acknowledgments
This research has been supported by Award Number S06GM060314 from the National Institute of Health/National Institute of General Medical Sciences, USA, to Z. Song.
References
- 1.Rayment I, Rypniewski WR, Schmidt-Base K, Smith R, Tomchick DR, Benning MM, Winkelmann DA, Wesenberg G, Holden HM. Science. 1993;261:50–58. doi: 10.1126/science.8316857. [DOI] [PubMed] [Google Scholar]
- 2.Bauer CB, Holden HM, Thoden JB, Smith R, Rayment I. J Biol Chem. 2000;275:38494–38499. doi: 10.1074/jbc.M005585200. [DOI] [PubMed] [Google Scholar]
- 3.Gulick AM, Bauer CB, Thoden JB, Pate E, Yount RG, Rayment I. J Biol Chem. 2000;275:398–408. doi: 10.1074/jbc.275.1.398. [DOI] [PubMed] [Google Scholar]
- 4.Smith CA, Rayment I. Biochemistry. 1996;35:5404–5417. doi: 10.1021/bi952633+. [DOI] [PubMed] [Google Scholar]
- 5.Dominguez R, Freyzon Y, Trybus KM, Cohen C. Cell. 1998;94:559–571. doi: 10.1016/s0092-8674(00)81598-6. [DOI] [PubMed] [Google Scholar]
- 6.Webb MR, Trentham DR. J Biol Chem. 1981;256:10910–10916. [PubMed] [Google Scholar]
- 7.Kambara T, Ikebe M. J Biol Chem. 2006;281:4949–4957. doi: 10.1074/jbc.M509141200. [DOI] [PubMed] [Google Scholar]
- 8.Malnasi-Csizmadia A, Pearson DS, Kovacs M, Woolley RJ, Geeves MA, Bagshaw CR. Biochemistry. 2001;40:12727–12737. doi: 10.1021/bi010963q. [DOI] [PubMed] [Google Scholar]
- 9.Kurzawa SE, Manstein DJ, Geeves MA. Biochemistry. 1997;36:317–323. doi: 10.1021/bi962166b. [DOI] [PubMed] [Google Scholar]
- 10.Millar NC, Geeves MA. Biochem J. 1988;249:735–743. doi: 10.1042/bj2490735. [DOI] [PMC free article] [PubMed] [Google Scholar]
- 11.Tokuraku K, Kurogi R, Toya R, Uyeda TQ. J Mol Biol. 2009;386:149–162. doi: 10.1016/j.jmb.2008.12.008. [DOI] [PubMed] [Google Scholar]
- 12.Mizukura Y, Maruta S. J Biochem. 2002;132:471–482. doi: 10.1093/oxfordjournals.jbchem.a003245. [DOI] [PubMed] [Google Scholar]
- 13.Yasunaga T, Suzuki Y, Ohkura R, Sutoh K, Wakabayashi T. J Struct Biol. 2000;132:6–18. doi: 10.1006/jsbi.2000.4302. [DOI] [PubMed] [Google Scholar]
- 14.Applegate D. J Muscle Res Cell Motil. 1989;10:457–464. doi: 10.1007/BF01771821. [DOI] [PubMed] [Google Scholar]
- 15.Yang Y, Yu H, Cui Q. J Mol Biol. 2008;381:1407–1420. doi: 10.1016/j.jmb.2008.06.071. [DOI] [PMC free article] [PubMed] [Google Scholar]
- 16.Grigorenko BL, Rogov AV, Topol IA, Burt SK, Martinez HM, Nemukhin AV. Proc Natl Acad Sci U S A. 2007;104:7057–7061. doi: 10.1073/pnas.0701727104. [DOI] [PMC free article] [PubMed] [Google Scholar]
- 17.Onishi H, Mochizuki N, Morales MF. Biochemistry. 2004;43:3757–3763. doi: 10.1021/bi040002m. [DOI] [PubMed] [Google Scholar]
- 18.Okimoto N, Yamanaka K, Ueno J, Hata M, Hoshino T, Tsuda M. Biophys J. 2001;81:2786–2794. doi: 10.1016/S0006-3495(01)75921-8. [DOI] [PMC free article] [PubMed] [Google Scholar]
- 19.Minehardt TJ, Marzari N, Cooke R, Pate E, Kollman PA, Car R. Biophys J. 2002;82:660–675. doi: 10.1016/S0006-3495(02)75429-5. [DOI] [PMC free article] [PubMed] [Google Scholar]
- 20.Han YS, Geiger PC, Cody MJ, Macken RL, Sieck GC. J Appl Physiol. 2003;94:2188–2196. doi: 10.1152/japplphysiol.00618.2002. [DOI] [PubMed] [Google Scholar]
- 21.Ito K, Uyeda TQ, Suzuki Y, Sutoh K, Yamamoto K. J Biol Chem. 2003;278:31049–31057. doi: 10.1074/jbc.M304138200. [DOI] [PubMed] [Google Scholar]
- 22.Friedman AL, Geeves MA, Manstein DJ, Spudich JA. Biochemistry. 1998;37:9679–9687. doi: 10.1021/bi973143f. [DOI] [PubMed] [Google Scholar]
- 23.Wray J, Jahn W. FEBS Lett. 2002;518:97–100. doi: 10.1016/s0014-5793(02)02654-6. [DOI] [PubMed] [Google Scholar]
- 24.Chen X, Grammer J, Lawson JD, Cooke R, Pate E, Yount RG. Biochemistry. 2002;41:2609–2620. doi: 10.1021/bi0118411. [DOI] [PubMed] [Google Scholar]
- 25.Danylova VM, Bohuts’ka KI, Shut AM, Pryluts’kyi I. Fiziol Zh. 2005;51:40–45. [PubMed] [Google Scholar]
- 26.Gafurov B, Chen YD, Chalovich JM. Biophys J. 2004;87:1825–1835. doi: 10.1529/biophysj.104.043364. [DOI] [PMC free article] [PubMed] [Google Scholar]
- 27.Maruta S, Henry GD, Sykes BD, Ikebe M. J Biol Chem. 1993;268:7093–7100. [PubMed] [Google Scholar]
- 28.Henry GD, Maruta S, Ikebe M, Sykes BD. Biochemistry. 1993;32:10451–10456. doi: 10.1021/bi00090a022. [DOI] [PubMed] [Google Scholar]
- 29.Tanokura M, Suzuki Y. Mol Cell Biochem. 1999;190:75–78. [PubMed] [Google Scholar]
- 30.Ray BD, Khoroshev MI, Ue K, Morales MF, Nageswara Rao BD. Arch Biochem Biophys. 2002;402:243–248. doi: 10.1016/S0003-9861(02)00077-2. [DOI] [PubMed] [Google Scholar]
- 31.Tymoczko JL, Berg JM, Stryer L. Biochemistry. W.H. Freeman; New York: 2002. [Google Scholar]
- 32.Barman TE, Hillaire D, Travers F. Biochem J. 1983;209:617–626. doi: 10.1042/bj2090617. [DOI] [PMC free article] [PubMed] [Google Scholar]
- 33.Dingley AJ, Mackay JP, Shaw GL, Hambly BD, King GF. J Biomol NMR. 1997;10:1–8. doi: 10.1023/A:1018339526108. [DOI] [PubMed] [Google Scholar]
- 34.Vishnevskaia ZI, Filatova LG, Lobyshev VI. Biofizika. 1983;28:214–216. [PubMed] [Google Scholar]
- 35.Valiev M, Kawai R, Adams JA, Weare JH. J Am Chem Soc. 2003;125:9926–9927. doi: 10.1021/ja029618u. [DOI] [PubMed] [Google Scholar]
- 36.Sigel H, Griesser R. Chem Soc Rev. 2005;34:875–900. doi: 10.1039/b505986k. [DOI] [PubMed] [Google Scholar]
- 37.Pelletier H, Sawaya MR, Kumar A, Wilson SH, Kraut J. Science. 1994;264:1891–1903. [PubMed] [Google Scholar]
- 38.Steitz TA. Nature. 1998;391:231–232. doi: 10.1038/34542. [DOI] [PubMed] [Google Scholar]


