

Abstract
We have characterized a newly generated mouse model of obesity, a mouse strain deficient in all five previously described leptin receptor isoforms. These transgenic mice, named the db 333/db 333 mice, were identified from an ENU mutagenesis screen and carry a point mutation in the seventh exon of the db gene encoding the leptin receptor, resulting in a premature stop codon (Y333Stop) and gene product that lacks STAT signaling domains. db 333/db 333 mice have a morbidly obese phenotype, with body weights diverging from wild type as early as 4 weeks of age (P < 0.05). To determine the contribution of the short isoforms of the leptin receptor in this metabolic phenotype, we performed an extensive metabolic characterization of the db 333/db 333 mouse in relation to the well-characterized db/db mouse lacking only the long form of the leptin receptor. db 333/db 333 mice have similar endocrine and metabolic parameters as previously described in other leptin receptor transgenic mice including db/db mice that lack only the long isoform of the leptin receptor. However, db 333/db 333 mice show a subtle trend toward higher body weight and insulin levels, lower oxygen, carbon dioxide production, respiratory exchange ratio (RER), and temperature than db/db mice suggesting the short isoforms may play an additional role in energy homeostasis.
Keywords: Leptin, Leptin receptor, Ob–Rb, Obesity, db/db, db333/db333, Diabetes, Insulin resistance
Introduction
Leptin signaling is an important mediator of feeding behavior, energy homeostasis, and normal immune and reproductive functions (Halaas et al. 1995; Pelleymounter et al. 1995; Chehab et al. 1996; Schwartz et al. 1996; Loffreda et al. 1998; Lord et al. 1998). Leptin is a 16 kDa cytokine, secreted by adipocytes that is encoded by the ob gene that acts at the hypothalamic level through the leptin receptor (Ob-R) encoded by the db gene. Leptin acts as a feedback signal reflecting the nutritional status of the periphery to suppress feeding and to permit neuroendocrine functions (Ahima et al. 1996, 1997; Heiman et al. 1997; Yu et al. 1997). Conversely, negative energy balance decreases leptin levels, increasing the drive to feed triggering neuroendocrine responses that limit energy expenditure (Ahima et al. 1996; Bates and Myers 2003).
Leptin deficient (ob/ob) and leptin receptor deficient (db/db) mouse models have provided many insights into leptin signaling. Deficiency in leptin signaling causes a disruption in energy balance resulting in obesity from hyperphagia and decreased energy expenditure followed by the spontaneous development of insulin resistance (Ingalls et al. 1950; Zhang et al. 1994; Pelleymounter et al. 1995; Frederich et al. 1995; Chua 1997). A similar phenotype is observed in humans with very rare mutations in the leptin or leptin receptor genes (Montague et al. 1997; Farooqi et al. 2002; Farooqi and O’Rahilly 2006). With the exception of humans with this rare genetic leptin deficiency circulating leptin levels are positively correlated with adiposity (Frederich et al. 1995). Obese individuals have elevated circulating leptin levels, but leptin fails to mediate weight loss, suggesting that most human obesity is a form of leptin resistance.
The leptin receptor (Ob-R) belongs to the cytokine receptor class I superfamily (Tartaglia 1997), and in the mouse the receptor is alternatively spliced into five known isoforms: Ob–Ra, Ob–Rb, Ob–Rc, Ob–Rd, and Ob–Re (Lee et al. 1996). The longest isoform (Ob–Rb) is expressed at a high level in the hypothalamus and at a low level in other tissues including testes, adipose tissues, pancreatic β cells, heart, lung, and lymph nodes (Ghilardi et al. 1996; Lee et al. 1996; Emilsson et al. 1997; Fei et al. 1997; Lollmann et al. 1997; Spanswick et al. 1997). The Ob–Rb form is highly conserved among species and possesses an intracellular cytoplasmic domain of ~300 residues (Chen et al. 1996; Lee et al. 1996; Chua et al. 1997; Tartaglia 1997). Ob–Rb, like other members of the cytokine receptor family mediates tyrosine kinase signaling by means of associated Janus kinase (Jak)/signal transducers and activators of transcription (STAT) pathway. Ob–Ra, Ob–Rc, Ob–Rd, and Ob–Re are considered ‘short isoforms’, since they lack the long cytoplasmic domain. Ob–Ra–d contain identical extracellular leptin-binding and transmembrane domains, as well as the same first 29 intracellular amino acids and diverge in sequence secondary to alternative splicing of 3′ exons (Chua et al. 1996). The short isoform Ob–Ra is ubiquitously expressed (Lollmann et al. 1997) with particularly high expression in the choroid plexus and microvessels in the CNS and has been suggested to play a role in the transport of leptin across the blood brain barrier (Golden et al. 1997; Tartaglia 1997; Wu-Peng et al. 1997). Ob–Re is a secreted isoform (Tartaglia 1997) that forms a complex with circulating leptin suggested to act as a buffering system to regulate leptin availability (Lollmann et al. 1997; Ge et al. 2002). The other functions of the short isoforms of the leptin receptor have yet to be determined.
The db/db mouse has a mutation in the signaling C terminus of the leptin receptor gene that results in a non-functional, truncated long form of Ob–Rb (Hummel et al. 1966; Chen et al. 1996; Lee et al. 1996). Central or peripheral administration of leptin in db/db mice has no effect on food intake or body weight (Halaas et al. 1995). Since db/db mice express all the other short leptin receptor isoforms besides Ob–Rb, yet still develop the obese phenotype, it has been hypothesized that the weight-controlling effects of leptin in mice are mediated by signaling through the long leptin receptor isoform Ob–Rb. Furthermore, leptin activation of STAT3 occurs only in wild type (WT) and ob/ob mice but not in db/db mice (Vaisse et al. 1996). However, a recent study on leptin signaling showed that leptin stimulation of interleukin 1 beta (IL-1β) expression in the brain still occurs in db/db mice (Hosoi et al. 2002). The possibility that leptin has effects in mice lacking the Ob–Rb isoform indicates that the short leptin receptor isoforms could play a yet undetermined role in leptin signaling.
In this present study, we have characterized a transgenic mouse model of obesity that lacks all known isoforms of the leptin receptor on a C57BL/6 background. These db 333/db 333 mice were isolated from an ENU mutagenesis screen and have a T to A transversion in the seventh coding exon of the leptin receptor, causing a premature stop codon: Y333Stop. We performed an extensive endocrine and metabolic characterization of this transgenic mouse model of obesity in relation to the well characterized db/db mouse lacking just the long form of the leptin receptor.
Experimental Procedures
Animals and Surgery
Genetically obese C57BL/6 mice were generated in the laboratory of Dr. Bruce Beutler (The Scripps Research Institute, La Jolla, CA, USA) using ENU mutagenesis (Brown and Peters 1996). Positional cloning was used to determine the location of the point mutation in the leptin receptor gene. Both male db 333/db 333 and male WT littermates were fed ad libitum with mouse breeder diet composed of 11% fat, 17% protein, and 3.5% fiber (S-2335 Mouse Breeder, gross energy kcal 4.39 kcal/g). Leprdb/Leprdb on a C57BL/6 background (stock number 000697) were obtained from Jackson laboratories. Groups of five mice of each genotype were used in all experiments at the age of 6–8 months unless otherwise stated.
Mice were anesthetized with isofluorane (induction 3–5%, maintenance 1.0%) and implanted with transmitter devices (TA10TA-F20; Data Sciences, Arden Hills, MN) into the peritoneal cavity. Transmitter devices contain sensors that measure core body temperature (CBT) and locomotor activity. Mice were allowed to recover for 1 week and then submitted to a second surgery. After anesthesia (induction 3–5%, maintenance 0.9–1.5%), mice were placed into a stereotaxic apparatus. The skull was exposed, and holes were drilled to accommodate stereotaxic placement of a guide cannula (26 Ga, 1.0-cm length) aiming at the lateral ventricle (anterior–posterior from bregma, 0.3 mm; lateral, 1.0 mm; and ventral, 1.7 mm).
Mice with ad libitum access to food and water were monitored using a computer-controlled, open-circuit system (Oxymax System) that is part of an integrated Comprehensive Lab Animal Monitoring System (CLAMS; Columbus Instruments, Columbus, OH). Mice were singly housed in clear respiratory chambers (20 × 10 × 12.5 cm) with a stainless steel-elevated wire floor. Each of these chambers is equipped with a sipper tube delivering water and a food tray connected to a balance. Room air was passed through chambers at a flow rate of ~0.5 l/min. Exhaust air from each chamber was sampled at 20-min intervals for 1 min. Sample air was sequentially passed through O2 and CO2 sensors (Columbus Instruments) for determination of O2 and CO2 content, from which measures of oxygen consumption (VO2) and carbon dioxide production (VCO2) are estimated. Outdoor air reference values are sampled after every 4 measurements. Gas sensors are calibrated prior to the onset of experiments with primary gas standards containing known concentrations of O2, CO2, and N2 (Airgas Puritan Medical, Ontario, CA). Respiratory exchange ratio (RER) was calculated as the ratio of VCO2 to VO2. VO2, and VCO2 are corrected for estimated effective metabolic mass per Kleiber’s power function. Receiver plates (RPC-1; Data Sciences) positioned inside the chambers continuously monitored CBT and locomotor activity by means of a fully automated data acquisition system (Dataquest A.R.T., Data Sciences, Inc.). Mice were acclimated to the respiratory chambers for 4 days before the onset of study. Data are recorded under ambient room temperature clamped at 25°C, beginning from the onset of the dark cycle.
Genotyping
Genotyping of mice was carried out by PCR with 25 ng of genomic DNA isolated from tail clippings in 20 μl reaction mixtures containing 1× PCR buffer-Mg (Invitrogen), 0.2 mM each of a mixture of deoxynucleoside triphosphates (Invitrogen), 1.5 mM MgCl2 (Invitrogen), 1 U of Taq DNA Polymerase (Invitrogen), and 0.5 μM of each primers db 333/db 333-F 5′-GCTGGAAGCCTGTCGTACTCTTCA-3′ and db 333/db 333-R 5′-TACACTGCGTCATAGGTAAACTTCCCTC-3′. After an initial denaturation at 94°C for 3 min, 35 cycles of PCR at 94°C for 45 s, 55°C for 30 s, and 72°C for 1 min were performed, followed by a final extension at 72°C for 10 min. The PCR products were purified using a QIAquick PCR purification kit (Qiagen) and sequenced to identify homozygous mutant db 333/db 333 mice.
Analysis of Fat Depots and Organ Weights
Mice were anesthetized with 5% isoflurane and subsequently killed. Wet fat pads (omental, mesenteric, subcutaneous, and brown adipose tissue) and the liver were weighed immediately.
Measurement of Food Intake in Response to Leptin
Mice were given leptin (Peprotech, Rocky Hill, NJ) injections (4 μg/μl, intracerebroventricular, icv) at 3:00 pm, prior to the onset of the dark cycle at 6:00 pm. An internal cannula (33 Ga, 1.1 cm length) connected to plastic tubing and a microsyringe (10 μl) was used for direct delivery into the lateral ventricle. A volume of 1.0 μl (leptin or heat inactivated leptin, 98°C for 30 min) was injected in a period of 5 min to allow for diffusion. Food intake was measured by weighing the amount of food eaten and normalized to initial body weight using the Kleiber’s function of 0.75.
Measurement of Endocrine Parameters
Mice were anesthetized with 5% isoflurane and blood samples were collected via retro-orbital bleeds with EDTA coated capillary tubes (Drummond, Broomall, PA, USA) into EDTA coated vials (Microvette, Germany). Samples were spun down at 1,000×g for 10 min and plasma was stored at −80°C until analysis. Circulating levels of insulin, leptin, and IL-6 were determined using the mouse serum adipokine kit (Millipore, St. Charles, MO). Circulating levels of interleukin-1 receptor antagonist (IL-1Ra) were determined using the Immunoassay (R&D systems, Minneapolis, MN). All endocrine measurements were performed on plasma samples from mice at 6 months of age.
Insulin Tolerance Test
The glucose reducing effect of insulin injection was assessed in non-fasted mice. Baseline glucose levels are measured by withdrawing ~0.6 μl of blood from the tail from unanesthetized mice before a load of human insulin was administered (1 unit/kg, i.p.; Sigma–Aldrich, St. Louis, MO). Further samples were collected 15, 30, 60, 90, and 120 min after the insulin challenge. Blood glucose levels (in mg per deciliter) were determined by a glucometer (Glucometer, Rite Aid).
Glucose Tolerance Test
Mice were fasted for 16 h overnight and injected intraperitoneally (i.p) with glucose (d-glucose, anhydrous; Sigma–Aldrich, St. Louis, MO) (1.5 mg/g body weight) in sterile water. Blood samples were taken before the glucose administration and then at 15, 30, 60, 90, and 120 min after injection. Blood glucose levels were determined by a glucometer (Glucometer, Rite Aid).
Data Analysis
The significance of the difference in values between db 333/db 333, db/db and WT mice was evaluated using a one way ANOVA followed by Tukey’s honestly significant difference (HSD) test. For comparison of just db 333/db 333 and WT mice a two-tailed independent T test was applied. The statistical significance was at the P < 0.05 level. Data are expressed as means ± SE.
Results
db333/db333 Mice Lack All Leptin Receptor Isoforms Due to a Premature Stop Codon
db333/db33 mice were identified from an ENU mutagenesis screen and a positional cloning strategy was used to determine the location of the point mutation in the leptin receptor gene (Fig. 1a). The specific mutation is a T to A transversion in the seventh coding exon, causing a premature stop codon: Y333Stop (TAT → TAA). This premature stop codon causes biosynthesis of a truncated leptin receptor. Since the stop codon is upstream of the leptin receptor isoform splice sites, the mice lack earlier described long and short isoforms of the leptin receptor, see Fig. 1b.
Fig. 1.

a The db333/db333 mutation. DNA sequence chromatograms from homozygous mutant db333/db333 mice (TAA/TAA), heterozygous db333/db333 mice (TAA/TAT), and C57Bl/6 WT mice (TAT/TAT). db333/db333 mice have a point mutation in the leptin receptor gene causing a premature stop codon. The db333/db333 mouse has a T to A transversion (TAT → TAA) in the seventh coding exon of the leptin receptor gene, resulting in a premature stop codon at Tyr333. b Schematic presentation of leptin receptor mutations in mouse models of obesity with leptin signaling deficiencies. The predicted protein length is shown with the numbers at the end of each receptor representing the amino acid residue at the carboxy terminus. The STAT-3 binding site is located at amino acid 1138 and has an important role in the regulation of energy balance through the JAK/STAT signaling pathway
db333/db333 Mice are Obese and Hyperphagic and Exhibit Altered Endocrine and Inflammatory Parameters Associated with Obesity
db333/db333 mice develop an extreme obese phenotype on normal chow (Fig. 2a). At 6 months of age db333/db333 mice have significantly higher body weights compared with WT littermates (db333/db333 65.0 ± 5.9 g, WT 36.25 ± 1.70 g, P < 0.05; Fig. 2b). db333/db333 mice have significantly increased quantities of omental, mesenteric and subcutaneous fat, brown adipose tissue (BAT), and higher liver mass than WT littermates (Fig. 2c). db333/db333 mice are hyperphagic and consume significantly more food than WT littermates throughout the 24 h monitoring period (Fig. 2d), with the most significant increase in food intake in db333/db333 mice in the dark cycle (db333/db333 3.95 ± 0.12 g, WT 2.24 ± 0.05 g, P < 0.05; Fig. 2e). db333/db333 mice had significantly elevated circulating levels of leptin, insulin, and IL-1Ra compared with WT littermates at 6 months of age (Table 1). db333/db333 mice also display significantly elevated insulin levels and show a trend toward higher IL-1Ra levels when compared with db/db mice. Levels of the pro-inflammatory cytokine interleukin 6 (IL-6) was also elevated in db333/db333 and db/db mice relative to levels in WT, lean littermates.
Fig. 2.
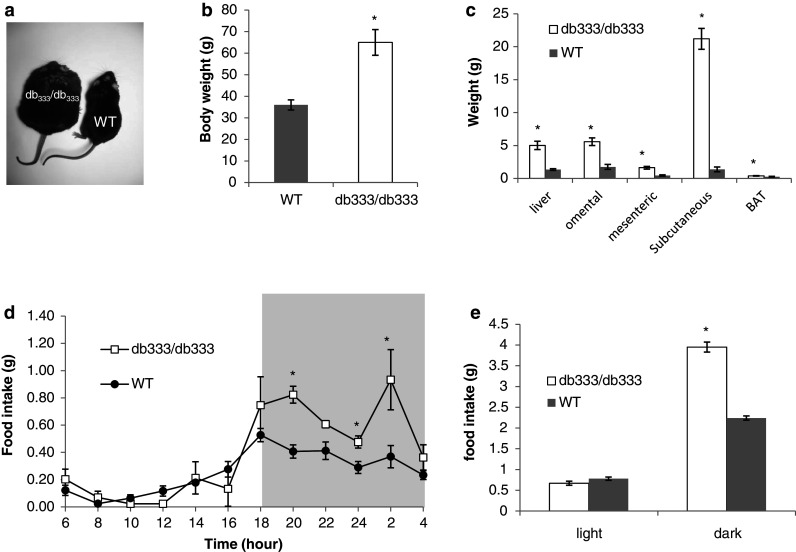
Phenotypic characterization of the db 333/db 333 mice. a Photograph of db 333/db 333 and WT littermate. b Body weights of db 333/db 333 and WT mice at 6 months of age. c db 333/db 333 mice have significantly increased omental, mesenteric and subcutaneous fat, and increased liver and brown adipose tissue (BAT) weight compared with WT littermates. d Food intake in db 333/db 333 and WT mice during a 24 h monitoring period. e db 333/db 333 mice are hyperphagic and consume significantly more food than WT littermates in the dark cycle (db 333/db 333 3.95 ± 0.05 g, WT 0.78 ± 0.05 g). Significant (P < 0.05) differences between group means were determined by a two-tailed independent T test and denoted by asterisk. Data are presented as means ± SE
Table 1.
db333/db333 mice had significantly elevated circulating levels of leptin, insulin, and interleukin-1 receptor antagonist (IL-1Ra) at 6 months of age when compared with WT lean littermates
| db333/db333 | WT | db/db | |
|---|---|---|---|
| Insulin (pg/ml) | 6,589 ± 341*† | 1,159 ± 400 | 3,686 ± 654* |
| Leptin (pg/ml) | 35,318 ± 2,239* | 5,874 ± 707 | 36,248 ± 5,639* |
| IL-1Ra (pg/ml) | 3,523 ± 118* | 891 ± 324 | 2,501 ± 375 |
| IL-6 (pg/ml) | 61 ± 24 | 41 ± 09 | 47 ± 18 |
db333/db333 also display significantly elevated circulating insulin levels and show a trend toward higher IL-1Ra levels when compared with db/db mice. Levels of the pro-inflammatory cytokine interleukin 6 (IL-6) was also elevated in db333/db333 and db/db mice relative to levels in WT, lean littermates
* Significant (P < 0.05) differences between db 333/db 333 and WT group means
†Differences between db/db and db333/db333 mice
db333/db333 Mice Display a Trend of Consistently Higher Body Weights than db/db Mice
Both db 333/db 333 and db/db mice have significantly greater body weights than WT littermates from as early as 4 weeks of age and throughout this monitoring period of 24 weeks (db 333/db 333 65.0 ± 5.9 g; db/db 60.25 ± 1.38 g, WT 36.25 ± 1.70 g at 24 weeks; Fig. 3). db 333/db 333 mice display consistently higher body weights than db/db mice from 8 to 24 weeks of age, but this trend only reached statistical significance at one time point (12 weeks).
Fig. 3.

Growth curve of male db 333/db 333, db/db and WT mice. Both db 333/db 333 and db/db mice have significantly greater body weights than WT littermates from as early as 4 weeks of age and throughout this 24 weeks monitoring period. db 333/db 333 mice display consistently higher body weights than db/db mice from 8 to 24 weeks of age, but this trend only reached statistical significance at one time point (“†” P < 0.05 at 12 weeks). At 24 weeks of age db 333/db 333, mice display a higher body weight than db/db mice, but this trend is not statistically significant at this time point. At 24 weeks of age db 333/db 333 and db/db, mice have significantly greater body weights than WT littermates (db 333/db 333 65.0 ± 5.9 g; db/db 60.25 ± 1.38 g, WT 36.25 ± 1.70 g, P < 0.05). Data represent the mean of 5 male mice per genotype weighed monthly from 4 to 24 weeks of age. Significant (P < 0.05) differences between db 333/db 333 and WT group means are denoted by asterisk, differences between db/db and db 333/db 333 mice are denoted by “†”. All significant differences were determined by one way ANOVA and post hoc Tukey test. Data are presented as means ± SE
db333/db333 and db/db Mice Show Decreased Insulin Sensitivity and Impaired Glucose Tolerance Relative to Lean Mice
Intraperitoneal administration of insulin (1 unit per kg of body weight) revealed that both db 333/db 333 and db/db mice have an impaired glucose disposal ability relative to the hypoglycemic response to insulin observed in the WT littermates (Fig. 4a). The ability of insulin to acutely stimulate glucose mobilization was significantly blunted at 30 min in db 333/db 333 and db/db mice relative to WT littermates. Both db 333/db 333 and db/db mice exhibit impaired glucose disposal when challenged with glucose (1.5 mg of glucose per gram of body weight; Fig. 4b). Significant differences in glucose disposal between db 333/db 333 mice and WT littermates were observed at 15 and 60 min after glucose injection.
Fig. 4.
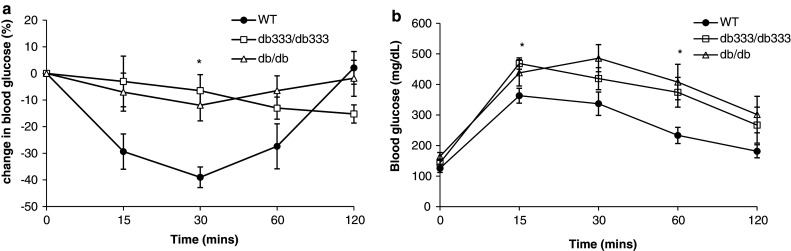
a Insulin sensitivity test in db333/db333, db/db, and WT mice. Intraperitoneal insulin administration (1 unit per kg of body weight) revealed that both db333/db333 and db/db mice have an impaired glucose disposal ability relative to the hypoglycemic response to insulin observed in the WT littermates. Data are presented as percentage change in blood glucose from baseline before and after insulin injection for up to 120 min. b Intraperitoneal glucose tolerance test in db333/db333, db/db, and WT mice. After glucose challenge db333/db333 and db/db mice display impaired glucose disposal compared with WT mice. Data are plotted as mean blood glucose ± SE for n = 5 animals of each genotype before and after intraperitoneal glucose injection for up to 120 min. Significant (P < 0.05) differences between db333 and WT group means are denoted by asterisk and were determined by one way ANOVA and post hoc Tukey test
db333/db333 Mice Have a Lower Core Body Temperature and Decreased Locomotor Activity Relative to WT Littermates
db333/db333 and db/db mice display a significantly lower CBT, as determined by radiotelemetry, relative to lean mice (Fig. 5a). Average CBT over both the 12 h light or dark cycle in db333/db333 and db/db mice is significantly lower when compared with lean mice (Fig. 5b). db333/db333 and db/db mice display decreased locomotor activity relative to WT mice, although there is a modest difference in activity between db333/db333 and db/db mice toward the end of the dark cycle (Fig. 5c). During the dark cycle db/db and db333/db333 mice show significantly reduced activity relative to WT littermates (P < 0.05) Fig. 5d.
Fig. 5.
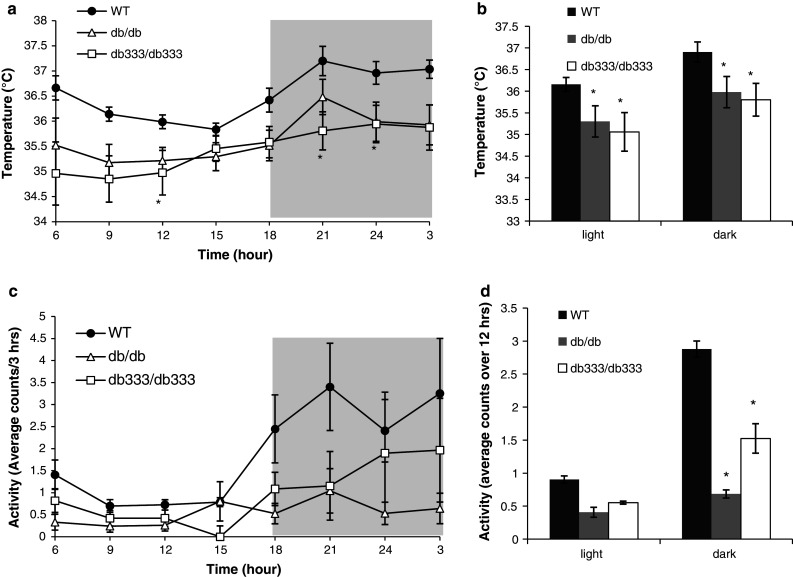
Core body temperature and spontaneous locomotor activity in db 333/db 333, db/db, and WT mice during a 24 h monitoring period. a db 333/db 333 and db/db mice display a significantly lower CBT relative to WT mice. b Average CBT over the 12 h light or dark cycle in db 333/db 333 and db/db mice is significantly lower when compared with WT littermates. c Average spontaneous physical activity of db 333/db 333, db/db, and WT mice during a 24 h monitoring period. db 333/db 333 and db/db mice display decreased locomotor activity relative to WT mice. d Average activity for db 333/db 333, db/db, and WT mice during the light and dark cycle. Both db 333/db 333 and db/db mice display lower average activity than WT mice. Data are plotted as mean ± SE for n = 4 animals of each genotype. Significant (P < 0.05) differences between group means are denoted by asterisk and were determined by one way ANOVA and post hoc Tukey test
Functional Loss of the Leptin Receptor in db333/db333 Mice
The functional loss of leptin signaling in db 333/db 333 and db/db mice was determined by comparison with leptin induced reduction in food intake in WT littermates. Injection of leptin (icv 4 μg/μl) caused a significant reduction in food intake in WT mice while no significant appetite suppression was observed in db 333/db 333 or db/db mice (Fig. 6).
Fig. 6.

Effects of icv leptin administration on food intake in db 333/db 333, db/db, and WT mice. Injection of leptin (icv 4 μg/μl) caused a significant reduction in food intake in WT mice (P = 0.0038) while no significant appetite suppression was observed in db 333/db 333 or db/db mice. Data are plotted as mean ± SE for n = 4 animals of each genotype. Significant differences between group means are denoted by asterisk and were determined by one way ANOVA and post hoc Tukey test
db333/db333 and db/db Mice Showed Significantly Lower Oxygen Consumption, Carbon Dioxide Production, and RER Compared with Lean Mice
Measurements of O2 production (VO2) and CO2 production (VCO2) were acquired from each metabolic chamber every 20 min and sent to a computer that collects and processes the data continuously over a 24 h monitoring period. Both db/db and db 333/db 333 mice displayed significantly lower VO2 (Fig. 7a) and VCO2 (Fig. 7b) at all time points throughout both the light and dark cycle relative to lean mice (P < 0.05). RER (VCO2/VO2) in both db 333/db 333 and db/db showed a trend of lower RER relative to WT mice that is most pronounced in the dark cycle indicating a trend to the use of lipids as energy substrates in these obese mutants. db 333/db 333 mice also show a consistently lower RER relative to db/db although this trend was not deemed statistically significant (Fig. 7c).
Fig. 7.
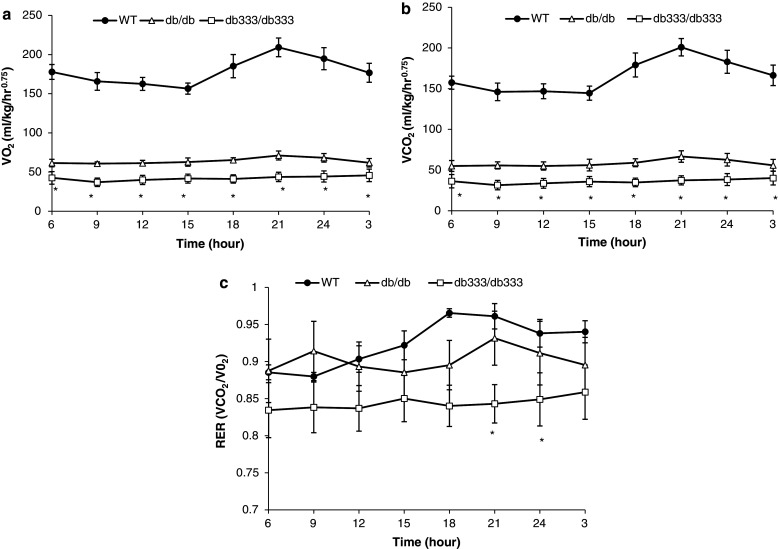
Metabolic comparison of db 333/db 333, db/db, and WT mice during a 24 h monitoring period. a Oxygen consumption in db 333/db 333, db/db, and WT mice monitored for 24 h. Both db/db and db 333/db 333 mice displayed similar oxygen consumption at all time points, and these obese mutants showed significantly lower oxygen consumption than WT mice throughout both the light and dark cycle. b CO2 production in db 333/db 333, db/db, and WT mice monitored for 24 h. Both db/db and db 333/db 333 mice displayed similar levels of CO2 production at all time points, and these obese mutants showed significantly lower CO2 production than WT mice throughout both the light and dark cycle. c RER (VCO2/VO2) in db 333/db 333, db/db, and WT mice over a 24 h period. Both db 333/db 333 and db/db show a trend of lower RER relative to WT mice that is most pronounced in the dark cycle. db 333/db 333 mice show a consistently lower RER relative to db/db and WT mice. Data are plotted as mean ± SE for n = 4 animals of each genotype. Significant (P < 0.05) differences between group means are denoted by asterisk and were determined by one way ANOVA and post hoc Tukey test
Discussion
We have characterized a newly generated mouse model of obesity, the db 333/db 333 mice, deficient in all known leptin receptor isoforms in mice. db 333/db 333 mice have a point mutation in the seventh exon of the db gene encoding the leptin receptor resulting in a premature stop codon (Y333Stop) upstream of all the known splice sites. db 333/db 333 mice have a morbidly obese phenotype, with body weights diverging from WT as early as 4 weeks of age. The obese phenotype of the db 333/db 333 mice is caused not only by hyperphagia but also by disrupted neuroendocrine regulation of energy expenditure. db 333/db 333 mice had significantly elevated circulating levels of leptin, insulin, and interleukin-1 receptor antagonist as also observed in human diabetics and mouse models of obesity (Ludvik et al. 1997; Luheshi et al. 1999; Meier et al. 2002; Juge-Aubry et al. 2003; Somm et al. 2005, 2006).
This study describes an extensive in vivo metabolic comparison of the db 333/db 333 mice lacking all forms of the leptin receptor with the db/db mice lacking just the Ob–Rb long isoform of the receptor (Chen et al. 1996). The functional loss of leptin signaling in db 333/db 333 and db/db mice was confirmed by icv administration of leptin that resulted in significant reduction in food intake in WT mice while, as expected, no significant appetite suppression was observed in db 333/db 333 or db/db mice. Both db 333/db 333 and db/db mice are obese, hyperphagic, and insulin resistant. The metabolic comparison of these obese leptin receptor deficient mice with lean mice showed that db 333/db 333 and db/db mice consume significantly less O2 and produce significantly less CO2 in comparison with lean controls as observed in other obese mutants (Pelleymounter et al. 1995; Overton et al. 2001). Neither db 333/db 333 nor db/db mice display the classical circadian rhythm of lower oxygen demand and CO2 production in the light cycle and markedly higher O2 demand and CO2 production in the dark cycle as seen in lean controls. The reduced RER in both db 333/db 333 and db/db mice indicates the use of lipids as energy substrates in these mice as opposed to carbohydrates in WT mice as suggested by an RER closer to 1. The activity levels observed in db 333/db 333 and db/db mice are dramatically reduced compared with WT animals. db 333/db 333 and db/db mice also maintain a consistently lower CBT of ~35°C consistent with previous findings in these Ob–Rb deficient mice (Trayhurn and James 1978; Harris et al. 2001). However, a modest increase in activity was observed in db 333/db 333 mice relative to db/db mice toward the end of the dark cycle in comparison with db/db mice. This trend of increase in activity has previously been described in the s/s mutant mouse that has a Tyr to Ser mutation at position 1138 of the db gene that specifically disrupts the activation of the transcription factor STAT3 (Bates et al. 2004). In both the db 333/db 333 and s/s mutant mice, neither the CBT, VO2 consumption nor CO2 production was different from that observed in db/db mice at this time point, suggesting this modest increase in activity in the dark phase does not significantly alter overall energy expenditure.
Ob–Rb is believed to function through a Jak/STAT signal transduction pathway (Ghilardi et al. 1996) to promote fat oxidation (Hwa et al. 1996), satiety (Satoh et al. 1998), and the homeostasis of lipids (Unger et al. 1999). Leptin signaling in hypothalamic neurons results in a decrease in feeding and an increase in energy expenditure in order to maintain energy homeostasis (Campfield et al. 1995; Halaas et al. 1995; Levin et al. 1996). In states of negative energy balance such as starvation, a decrease in leptin levels causes an increase in food intake and a decrease in energy expenditure (Elmquist et al. 1998; Friedman and Halaas 1998). Therefore, lack of the leptin signaling in these mice results in early onset obesity secondary to the increase in feeding and decreased energy utilization.
db333/db333 mice have altered endocrine and metabolic parameters consistent with previously described leptin receptor deficient mouse models of obesity including db/db mice that lack only the Ob–Rb isoform (Chen et al. 1996; Myers 2004) and several other mutants described that lack all known isoforms of the leptin receptor (Aubert et al. 1985; Lee et al. 1997; Li et al. 1998). For example the db3J/db3J mouse has a frameshift mutation at amino acid 625 (Leiter et al. 1980; Lee et al. 1997; Luo et al. 2006) and the dbPas/dbPas mouse has a duplication of exons 4 and 5 of Ob-R that introduces a premature stop codon at residue 281 (Li et al. 1998). Both mutations result in a truncated receptor without a transmembrane domain and result in complete ablation of all known leptin receptor splice variants (Fig. 1b).
The db 333/db 333 mice display very similar obese phenotypes to the other leptin receptor deficient mouse models of obesity. The C57BL/6 db 3J/db 3J mice gain weight in an identical manner to db 333/db 333 mice, for example, at 12 weeks of age C57BL/6 db 3J/db 3J mice weigh 56 ± 7.4 g (Luo et al. 2006) and db 333/db 333 mice weigh 55.5 ± 2.3 g. The db Pas/db Pas mice have a similar weight gain profile as the db 333/db 333 mice; at 24 weeks of age, db Pas/db Pas weigh 67.3 ± 1.71 g compared with db 333/db 333 that weigh 68.6 ± 5.96 g (Aubert et al. 1985).
The db 333/db 333 and db/db mice display very similar metabolic phenotypes in this study. Therefore, this study further confirms the finding that the long cytoplasmic domain of the leptin receptor is the main isoform by which leptin exerts its effects on energy homeostasis (Ghilardi et al. 1996). However, there is trend toward higher body weight, higher insulin and IL1-Ra levels; lower CO2, VO2, RER, and temperature in db 333/db 333 mice when compared with db/db mice that raises the question whether the short forms of the receptor play an additional role in energy homeostasis. Transgenic replacement of the long form of the leptin receptor (Ob–Rb) that is restricted to neurons in db 3J/db 3J animals has been shown to partially rescue the obesity/diabetes phenotype while fully correcting the impaired thermoregulatory thermogenesis phenotype (Kowalski et al. 2001). This partial attenuation of the obesity/diabetes phenotype (including body weight, circulating leptin, glucose, and insulin) without a full restoration of WT levels may be reflective of a role of the shorter isoforms in energy homeostasis.
In summary, we have characterized a novel transgenic mouse model of obesity, the db 333/db 333 mice, with a mutation that ablates expression of all leptin receptor variants. This db 333/db 333 mouse may prove useful in future studies on the roles of the long form and the short form of leptin receptors respectively.
Acknowledgments
These studies were supported by funds from The Harold L. Dorris Neurological Institute endowment and from grants from the Skaggs Institute of Chemical Biology.
References
- Ahima RS, Prabakaran D et al (1996) Role of leptin in the neuroendocrine response to fasting. Nature 382(6588):250–252 [DOI] [PubMed] [Google Scholar]
- Ahima RS, Dushay J et al (1997) Leptin accelerates the onset of puberty in normal female mice. J Clin Invest 99(3):391–395 [DOI] [PMC free article] [PubMed] [Google Scholar]
- Aubert R, Herzog J et al (1985) Description of a new model of genetic obesity: the dbPas mouse. J Nutr 115(3):327–333 [DOI] [PubMed] [Google Scholar]
- Bates SH, Myers MG Jr (2003) The role of leptin receptor signaling in feeding and neuroendocrine function. Trends Endocrinol Metab 14(10):447–452 [DOI] [PubMed] [Google Scholar]
- Bates SH, Dundon TA et al (2004) LRb-STAT3 signaling is required for the neuroendocrine regulation of energy expenditure by leptin. Diabetes 53(12):3067–3073 [DOI] [PubMed] [Google Scholar]
- Brown SD, Peters J (1996) Combining mutagenesis and genomics in the mouse—closing the phenotype gap. Trends Genet 12(11):433–435 [DOI] [PubMed] [Google Scholar]
- Campfield LA, Smith FJ et al (1995) Recombinant mouse OB protein: evidence for a peripheral signal linking adiposity and central neural networks. Science 269(5223):546–549 [DOI] [PubMed] [Google Scholar]
- Chehab FF, Lim ME et al (1996) Correction of the sterility defect in homozygous obese female mice by treatment with the human recombinant leptin. Nat Genet 12(3):318–320 [DOI] [PubMed] [Google Scholar]
- Chen H, Charlat O et al (1996) Evidence that the diabetes gene encodes the leptin receptor: identification of a mutation in the leptin receptor gene in db/db mice. Cell 84(3):491–495 [DOI] [PubMed] [Google Scholar]
- Chua SC Jr (1997) Monogenic models of obesity. Behav Genet 27(4):277–284 [DOI] [PubMed] [Google Scholar]
- Chua SC Jr, Chung WK et al (1996) Phenotypes of mouse diabetes and rat fatty due to mutations in the OB (leptin) receptor. Science 271(5251):994–996 [DOI] [PubMed] [Google Scholar]
- Chua SC Jr, Koutras IK et al (1997) Fine structure of the murine leptin receptor gene: splice site suppression is required to form two alternatively spliced transcripts. Genomics 45(2):264–270 [DOI] [PubMed] [Google Scholar]
- Elmquist JK, Maratos-Flier E et al (1998) Unraveling the central nervous system pathways underlying responses to leptin. Nat Neurosci 1(6):445–450 [DOI] [PubMed] [Google Scholar]
- Emilsson V, Liu YL et al (1997) Expression of the functional leptin receptor mRNA in pancreatic islets and direct inhibitory action of leptin on insulin secretion. Diabetes 46(2):313–316 [DOI] [PubMed] [Google Scholar]
- Farooqi S, O’Rahilly S (2006) Genetics of obesity in humans. Endocr Rev 27(7):710–718 [DOI] [PubMed] [Google Scholar]
- Farooqi IS, Matarese G et al (2002) Beneficial effects of leptin on obesity, T cell hyporesponsiveness, and neuroendocrine/metabolic dysfunction of human congenital leptin deficiency. J Clin Invest 110(8):1093–1103 [DOI] [PMC free article] [PubMed] [Google Scholar]
- Fei H, Okano HJ et al (1997) Anatomic localization of alternatively spliced leptin receptors (Ob-R) in mouse brain and other tissues. Proc Natl Acad Sci USA 94(13):7001–7005 [DOI] [PMC free article] [PubMed] [Google Scholar]
- Frederich RC, Hamann A et al (1995) Leptin levels reflect body lipid content in mice: evidence for diet-induced resistance to leptin action. Nat Med 1(12):1311–1314 [DOI] [PubMed] [Google Scholar]
- Friedman JM, Halaas JL (1998) Leptin and the regulation of body weight in mammals. Nature 395(6704):763–770 [DOI] [PubMed] [Google Scholar]
- Ge H, Huang L et al (2002) Generation of soluble leptin receptor by ectodomain shedding of membrane-spanning receptors in vitro and in vivo. J Biol Chem 277(48):45898–45903 [DOI] [PubMed] [Google Scholar]
- Ghilardi N, Ziegler S et al (1996) Defective STAT signaling by the leptin receptor in diabetic mice. Proc Natl Acad Sci USA 93(13):6231–6235 [DOI] [PMC free article] [PubMed] [Google Scholar]
- Golden PL, Maccagnan TJ et al (1997) Human blood-brain barrier leptin receptor. Binding and endocytosis in isolated human brain microvessels. J Clin Invest 99(1):14–18 [DOI] [PMC free article] [PubMed] [Google Scholar]
- Halaas JL, Gajiwala KS et al (1995) Weight-reducing effects of the plasma protein encoded by the obese gene. Science 269(5223):543–546 [DOI] [PubMed] [Google Scholar]
- Harris RB, Mitchell TD et al (2001) Metabolic responses to leptin in obese db/db mice are strain dependent. Am J Physiol Regul Integr Comp Physiol 281(1):R115–R132 [DOI] [PubMed] [Google Scholar]
- Heiman ML, Ahima RS et al (1997) Leptin inhibition of the hypothalamic-pituitary-adrenal axis in response to stress. Endocrinology 138(9):3859–3863 [DOI] [PubMed] [Google Scholar]
- Hosoi T, Okuma Y et al (2002) Leptin regulates interleukin-1beta expression in the brain via the STAT3-independent mechanisms. Brain Res 949(1–2):139–146 [DOI] [PubMed] [Google Scholar]
- Hummel KP, Dickie MM et al (1966) Diabetes, a new mutation in the mouse. Science 153(740):1127–1128 [DOI] [PubMed] [Google Scholar]
- Hwa JJ, Ghibaudi L et al (1996) Intracerebroventricular injection of leptin increases thermogenesis and mobilizes fat metabolism in ob/ob mice. Horm Metab Res 28(12):659–663 [DOI] [PubMed] [Google Scholar]
- Ingalls AM, Dickie MM et al (1950) Obese, a new mutation in the house mouse. J Hered 41(12):317–318 [DOI] [PubMed] [Google Scholar]
- Juge-Aubry CE, Somm E et al (2003) Adipose tissue is a major source of interleukin-1 receptor antagonist: upregulation in obesity and inflammation. Diabetes 52(5):1104–1110 [DOI] [PubMed] [Google Scholar]
- Kowalski TJ, Liu SM et al (2001) Transgenic complementation of leptin-receptor deficiency. I. Rescue of the obesity/diabetes phenotype of LEPR-null mice expressing a LEPR-B transgene. Diabetes 50(2):425–435 [DOI] [PubMed] [Google Scholar]
- Lee GH, Proenca R et al (1996) Abnormal splicing of the leptin receptor in diabetic mice. Nature 379(6566):632–635 [DOI] [PubMed] [Google Scholar]
- Lee G, Li C et al (1997) Leptin receptor mutations in 129 db3 J/db3 J mice and NIH facp/facp rats. Mamm Genome 8(6):445–447 [PubMed] [Google Scholar]
- Leiter EH, Coleman DL et al (1980) A new mutation (db3 J) at the diabetes locus in strain 129/J mice. I. Physiological and histological characterization. Diabetologia 19(1):58–65 [DOI] [PubMed] [Google Scholar]
- Levin N, Nelson C et al (1996) Decreased food intake does not completely account for adiposity reduction after ob protein infusion. Proc Natl Acad Sci USA 93(4):1726–1730 [DOI] [PMC free article] [PubMed] [Google Scholar]
- Li C, Ioffe E et al (1998) Absence of soluble leptin receptor in plasma from dbPas/dbPas and other db/db mice. J Biol Chem 273(16):10078–10082 [DOI] [PubMed] [Google Scholar]
- Loffreda S, Yang SQ et al (1998) Leptin regulates proinflammatory immune responses. FASEB J 12(1):57–65 [PubMed] [Google Scholar]
- Lollmann B, Gruninger S et al (1997) Detection and quantification of the leptin receptor splice variants Ob-Ra, b, and, e in different mouse tissues. Biochem Biophys Res Commun 238(2):648–652 [DOI] [PubMed] [Google Scholar]
- Lord GM, Matarese G et al (1998) Leptin modulates the T-cell immune response and reverses starvation-induced immunosuppression. Nature 394(6696):897–901 [DOI] [PubMed] [Google Scholar]
- Ludvik B, Kautzky-Willer A et al (1997) Amylin: history and overview. Diabet Med 14(Suppl 2):S9–S13 [DOI] [PubMed] [Google Scholar]
- Luheshi GN, Gardner JD et al (1999) Leptin actions on food intake and body temperature are mediated by IL-1. Proc Natl Acad Sci USA 96(12):7047–7052 [DOI] [PMC free article] [PubMed] [Google Scholar]
- Luo N, Liu SM et al (2006) Allelic variation on chromosome 5 controls beta-cell mass expansion during hyperglycemia in leptin receptor-deficient diabetes mice. Endocrinology 147(5):2287–2295 [DOI] [PubMed] [Google Scholar]
- Meier CA, Bobbioni E et al (2002) IL-1 receptor antagonist serum levels are increased in human obesity: a possible link to the resistance to leptin? J Clin Endocrinol Metab 87(3):1184–1188 [DOI] [PubMed] [Google Scholar]
- Montague CT, Farooqi IS et al (1997) Congenital leptin deficiency is associated with severe early-onset obesity in humans. Nature 387(6636):903–908 [DOI] [PubMed] [Google Scholar]
- Myers MG Jr (2004) Leptin receptor signaling and the regulation of mammalian physiology. Recent Prog Horm Res 59:287–304 [DOI] [PubMed] [Google Scholar]
- Overton JM, Williams TD et al (2001) Cardiovascular and metabolic responses to fasting and thermoneutrality are conserved in obese Zucker rats. Am J Physiol Regul Integr Comp Physiol 280(4):R1007–R1015 [DOI] [PubMed] [Google Scholar]
- Pelleymounter MA, Cullen MJ et al (1995) Effects of the obese gene product on body weight regulation in ob/ob mice. Science 269(5223):540–543 [DOI] [PubMed] [Google Scholar]
- Satoh N, Ogawa Y et al (1998) Satiety effect and sympathetic activation of leptin are mediated by hypothalamic melanocortin system. Neurosci Lett 249(2–3):107–110 [DOI] [PubMed] [Google Scholar]
- Schwartz MW, Baskin DG et al (1996) Specificity of leptin action on elevated blood glucose levels and hypothalamic neuropeptide Y gene expression in ob/ob mice. Diabetes 45(4):531–535 [DOI] [PubMed] [Google Scholar]
- Somm E, Henrichot E et al (2005) Decreased fat mass in interleukin-1 receptor antagonist-deficient mice: impact on adipogenesis, food intake, and energy expenditure. Diabetes 54(12):3503–3509 [DOI] [PubMed] [Google Scholar]
- Somm E, Cettour-Rose P et al (2006) Interleukin-1 receptor antagonist is upregulated during diet-induced obesity and regulates insulin sensitivity in rodents. Diabetologia 49(2):387–393 [DOI] [PubMed] [Google Scholar]
- Spanswick D, Smith MA et al (1997) Leptin inhibits hypothalamic neurons by activation of ATP-sensitive potassium channels. Nature 390(6659):521–525 [DOI] [PubMed] [Google Scholar]
- Tartaglia LA (1997) The leptin receptor. J Biol Chem 272(10):6093–6096 [DOI] [PubMed] [Google Scholar]
- Trayhurn P, James WP (1978) Thermoregulation and non-shivering thermogenesis in the genetically obese (ob/ob) mouse. Pflugers Arch 373(2):189–193 [DOI] [PubMed] [Google Scholar]
- Unger RH, Zhou YT et al (1999) Regulation of fatty acid homeostasis in cells: novel role of leptin. Proc Natl Acad Sci USA 96(5):2327–2332 [DOI] [PMC free article] [PubMed] [Google Scholar]
- Vaisse C, Halaas JL et al (1996) Leptin activation of Stat3 in the hypothalamus of wild-type and ob/ob mice but not db/db mice. Nat Genet 14(1):95–97 [DOI] [PubMed] [Google Scholar]
- Wu-Peng XS, Chua SC Jr et al (1997) Phenotype of the obese Koletsky (f) rat due to Tyr763Stop mutation in the extracellular domain of the leptin receptor (Lepr): evidence for deficient plasma-to-CSF transport of leptin in both the Zucker and Koletsky obese rat. Diabetes 46(3):513–518 [DOI] [PubMed] [Google Scholar]
- Yu WH, Kimura M et al (1997) Role of leptin in hypothalamic-pituitary function. Proc Natl Acad Sci USA 94(3):1023–1028 [DOI] [PMC free article] [PubMed] [Google Scholar]
- Zhang Y, Proenca R et al (1994) Positional cloning of the mouse obese gene and its human homologue. Nature 372(6505):425–432 [DOI] [PubMed] [Google Scholar]