

Abstract
One of the fundamental goals in understanding schizophrenia is linking the observable symptoms to the underlying unobservable pathophysiology. Given recent advances in medical imaging, researchers are increasingly investigating brain-behavior relationships to better understand the neural substrates of negative, positive, and disorganization symptoms in schizophrenia. This review focused on 25 task-related functional magnetic resonance imaging studies and found meaningful small to moderate associations between specific symptom dimensions and regional brain activity. Negative symptoms were related to the functioning of the ventrolateral prefrontal cortex and ventral striatum. Positive symptoms, particularly persecutory ideation, were related to functioning of the medial prefrontal cortex, amygdala, and hippocampus/parahippocampal region. Disorganization symptoms, although less frequently evaluated, were related to functioning of the dorsolateral prefrontal cortex. Surprisingly, no symptom domain had a consistent relationship with the middle or superior temporal regions. While a number of adaptations in experimental design and reporting standards can facilitate this work, current neuroimaging approaches appear to provide a number of consistent links between the manifest symptoms of schizophrenia and brain dysfunction.
Keywords: schizophrenia symptoms, functional magnetic resonance imaging (fMRI), prefrontal cortex, limbic system, temporal lobe
The principal requisite in the knowledge of mental diseases is an accurate definition of the separate disease processes. In solution of this problem one must have, on the one hand knowledge of the physical changes in the cerebral cortex, and on the other of the mental symptoms associated with them. Until this is known we cannot hope to understand the relationship between mental symptoms of disease and morbid physical processes underlying them or indeed the causes of the entire disease process.
--E. Kraepelin, 1907, p 115.
One prominent conceptualization of schizophrenia is as a neurodevelopmental disorder, where genes and environment interact over the course of development to determine abnormalities in neural systems that give rise to the disorder. Early in life pre-schizophrenia individuals demonstrate physical, motor, cognitive, and social impairments. As the brain matures through childhood the illness is further expressed, ultimately manifesting in late adolescence and adulthood as psychotic symptomatology (for review see, Lewis & Levitt, 2002; Rapoport, Addington, Frangou, & Psych, 2005). With the onset of the full syndrome, schizophrenia is diagnosed by the presence of diverse symptoms including distorted perceptions of reality, disorganized behavior, avolition, and flat or inappropriate affect. As expressed by Kraepelin (1907), to fundamentally understand schizophrenia one must relate the observable symptoms of the disorder to the unobservable neural pathophysiology. With refinements in neuroimaging technology, researchers are increasingly able to investigate brain-behavior relationships that reflect the neural basis of psychiatric symptoms. This review will focus on how blood-oxygenation level dependent response (BOLD) as measured by functional magnetic resonance imaging (fMRI) has added to our knowledge of the associations between neural substrates and symptom dimensions in schizophrenia. Symptom dimensions may reveal patterns of association with brain functioning which are not apparent when patient data are averaged into a single group and symptom heterogeneity obscures differences with a comparison group. Our goals were to determine whether consistencies emerged across studies, identify common problems that might be addressed in future studies, and highlight promising avenues for future work.
In addition to the tremendous progress made in imaging technology, considerable progress has been made in understanding the phenomenology of schizophrenia. Current diagnostic classification and identified symptom dimensions of the disorder build on a number of theoretical and empirical approaches that have been used in the past to reduce the heterogeneity. One prominent strategy developed by Kraepelin, Bleuler, and others was to group together patients with similar symptoms, symptom courses, or patterns of symptoms, presuming that patients with shared patterns also shared underlying pathology. Our current diagnostic criteria and subtypes of schizophrenia in the Diagnostic and Statistical Manual of Mental Disorders and the International Classification of Disease very much reflect the influence of this approach in their attempts to identify common phenomenology across patients. However, these diagnostic subtypes have not been found to be particularly useful in differentiating neural pathology in patients, partly due to the instability of subtypes across the course of the disorder (Buchanan & Carpenter, 1994).
More recently, researchers have attempted to further explore and develop subtypes of schizophrenia, which are more conducive to research. Timothy Crow developed a two-syndrome theory of schizophrenia (revised version, 1985) to reconcile the paradox that some symptoms can remit and are responsive to anti-psychotic medications, whereas other symptoms are associated with poorer long-term outcome and less responsive to anti-psychotic medications. Type I syndrome was characterized by delusions and hallucinations (positive symptoms), a good response to neuroleptics, a lack of intellectual impairment, a lack of involuntary movements, and an increase in D2 dopamine receptors. Type I schizophrenia was seen as a potentially reversible condition. Type II syndrome was characterized by flattening of affect and poverty of speech (negative symptoms), a poor response to neuroleptics, significant intellectual impairment, abnormal involuntary movements, and cell loss in temporal lobe structures. The two syndromes were regarded as relatively independent, but could coexist in the same patient. A second subtyping scheme was developed which emphasized the fundamental nature of negative symptoms to schizophrenia (Carpenter, Heinrichs, & Wagman, 1988). This scheme distinguished between primary and secondary negative symptoms. Primary symptoms were thought to be more persistent and idiopathic, and secondary symptoms were considered a consequence of phenomena such as medication, depressive symptoms, or an absence of social stimulation. For example, social withdrawal would not be considered a direct measure of a negative symptom because it may be due to a range of symptoms interacting with one’s environment. Yet, loss of social drive would be considered a negative symptom, whereas social withdrawal due to paranoia would not. The term ‘deficit syndrome’ was developed to describe the presence of primary negative symptoms. Thus, patients would be categorized as having deficit or nondeficit schizophrenia, depending on the prevalence of primary negative symptoms. Both Crow’s and Carpenter’s subtypes have influenced the measurement and understanding of symptoms that characterize schizophrenia.
A recently favored approach to characterizing the symptoms of schizophrenia has been to use quantitative dimensions to investigate domains of symptomatology on which individuals with schizophrenia vary. Dimensional approaches tend to divide symptoms, rather than patients, into groups. In addition, since clinical presentation in schizophrenia is often complicated with numerous coexisting symptoms, dimensions can be used to describe the level of symptomatology across several domains rather than merely categorizing an individual into a subtype (Andreasen et al., 1994). The first two dimensions of schizophrenia were conceptualized as positive and negative symptoms which in part were derived from Crow’s Type I and II subtyping of schizophrenia. Inventories such as the Scale for Assessment of Positive Symptoms (SAPS; Andreasen, 1983), Scale for Assessment for Negative Symptoms (SANS; Andreasen, 1981), and Positive and Negative Syndromes Scale (PANSS; Kay, Fiszbein, & Opler, 1987) were developed to rate symptoms in these dimensions. Nevertheless, factor analyses in schizophrenia have consistently demonstrated that the symptoms may be better accounted for by three dimensions: negative, positive, and disorganization (Grube, Bilder, & Goldman, 1998). Disorganization can contains symptoms (e.g., formal thought disorder, bizarre behavior, inappropriate affect and attention) that were previously divided into either the positive or negative dimension. However, the number of factors that result from these scales depends on the sample size, sample chronicity, and nature and number of items included in the analyses. Others have argued for as many as 11 or more factors and suggest that the three factors may reflect higher-order factors or derive from a less than complete inclusion of symptoms (Stuart, Pantelis, Klimidis, & Minas, 1999). Researchers have proposed that if the full range of symptoms, including the more transient affective symptoms, are taken into account, a more complex picture emerges (Liddle, 1995). Factor analysis of the PANSS on 100 schizophrenia patients has revealed negative, positive, disorganized, excited, anxious, preoccupied, depressive, and somatization dimensions (Peralta & Cuesta, 1994).
Influential Dimensional Schemes
A few particularly influential factor analytic studies of symptoms exist. Liddle (1987b) used select items from the SAPS and SANS and the Present Status Examination (PSE) to measure symptoms in 40 chronic schizophrenia patients. Factor analysis revealed three factors. The first factor termed psychomotor poverty consisted of poverty of speech, decreased spontaneous movement, and four items related to blunted affect, which were unchanging facial expression, paucity of - expressive gesture, affective nonresponsivity, and lack of vocal inflection. The second factor termed disorganization consisted of inappropriate affect, poverty of speech content, and four items measuring disturbances in thought, comprising of tangentiality, derailment, pressure of speech, and distractibility. The third factor, termed reality distortion, consisted of voices speaking to the patient, delusions of persecution, and delusions of reference. A similar structure was found using the PSE. However, there was modest differentiation between the delusions and hallucinations of Schneider’s first rank symptoms (disintegrative reality distortion) and other symptoms (integrative reality distortion). The two factors were correlated though, suggesting that they may share etiology.
Andreasen and colleagues (1995) completed a factor analysis of the SANS and SAPS on a sample of 243 patients. The first factor was negative symptoms and consisted of avolition, anhedonia, and affective flattening. The second factor was disorganization which consisted of inappropriate affect and positive formal thought disorder. Bizarre behavior loaded onto both the negative and disorganization factors, but more strongly on the disorganization factor. A third factor, psychosis, consisted of delusions and hallucinations. When alogia and attentional impairments were added as global ratings, the global ratings did not clearly load onto either the negative or the disorganization factors, though the global rating for alogia correlated more highly with the negative dimension. The different items making up the attention and alogia global scales loaded onto either the disorganization or the negative dimension. Poverty of speech and increased latency of response loaded onto the negative dimension, whereas poverty of content of speech, blocking, and perseveration loaded onto the disorganization factor. Social inattentiveness loaded more strongly onto the negative dimension and inattentiveness during mental testing loaded more strongly onto the disorganization factor. To further our understanding, Arndt and colleagues (1995) investigated the stability and course of these symptom dimensions in 65 primarily neuroleptic naïve, acutely ill patients. All three dimensions of negative, disorganization, and positive symptoms were found to be prominent at the initial evaluation. Negative symptoms tended to be more stable longitudinally, whereas positive and disorganization symptoms tended to be less pervasive over time. Symptoms within a factor tended to change together, but independently of the symptoms of the other factors.
Factor analyses of symptoms in schizophrenia are quite useful in determining which symptoms are likely to co-occur; however demonstrating that they co-occur does not necessarily prove that they have a common etiological or biological underpinning (Andreasen et al., 1994). Nonetheless, given that dimensions provide a quantitative summary of symptomatology experienced by schizophrenia patients, they provide useful tools for examining associations between symptoms and brain function. Indeed, to more closely tie symptoms to underlying pathophysiology, many investigators have examined associations between symptom dimensions and brain activity. In this review we attempt to determine whether the symptoms of schizophrenia are associated with specific brain regions. Although, schizophrenia is likely due to dysfunction of distributed neural systems, if specific brain regions are affected it is likely that the behavior of the distributed neural system will also be disrupted. In sum, the goal of this monograph was to investigate nodes within neural systems and their association with symptom dimensions; knowledge of how these individual nodes function provides useful information of the working of higher-level systems. Thus, we specifically examined whether fMRI brain activity associated with experimentally-revealed cognitive or emotive processes in schizophrenia related to specific aspects of naturally occurring symptomatology?
Methods
Study Selection
Studies were identified from PubMed (through Dec 2007) using SCHIZOPHRENIA crossed with FUNCTIONAL IMAGING. All studies found were then reviewed to investigate whether relationships between brain regions and symptoms were assessed. Bibliographies of identified studies were also reviewed. Only BOLD fMRI studies were included in this study to reduce methodological heterogeneity.
Researchers have used many approaches to investigate the relationship between symptoms and fMRI brain activity. Symptoms have been measured using a variety of scales, with the SANS, SAPS, PANSS, and the more general Brief Psychiatric Rating Scale (BPRS; Overall & Gorham, 1962; Ventura et al., 1993) being the most common. Different ways of evaluating the clinical phenotype have been used to relate pathology to symptomatology - with some investigators using specific symptoms, others using the positive and negative scales of inventories, and others using the positive, negative, and disorganization dimensions derived from factor analyses.
The functional neuroanatomy this review addresses was restricted to brain activity as measured by fMRI studies. When a population of neurons becomes active, there is thought to be a corresponding increase in metabolic activity resulting in an increase in oxygenated hemoglobin flowing to regions over the next 10–15 seconds (Buxton, Wong, & Frank, 1998; Logothetis, Pauls, Augath, Trinath, & Oeltermann, 2001). fMRI measures this blood oxygenated level response that is thought to be related to the underlying neural activity elicited by increased cognitive demands.
Different approaches have been used to measure cognition as it relates to neurophysiology. Investigators used different cognitive tasks, including tasks of executive functioning, implicit learning, language, memory, or emotion processing to activate brain regions. The brain regions related to symptoms have also been identified through different analytic methods. First, some investigators have related symptoms to task-related brain regions found to be differentiated in schizophrenia patients (with or without an additional psychiatric comparison group) when compared with controls. Other investigators have simply related the brain regions activated by the schizophrenia group alone to symptoms. A third approach is to use the measures of symptoms themselves to identify above-threshold brain activations during task-related activity, using whole brain regression techniques. Finally, investigators have used groups of patients selected to have more prominent symptomatology in specific domains (such as negative or positive symptomatology, or, paranoia or lack of paranoia) to directly compare brain activation patterns between groups. In an attempt to maximize homogeneity of methods across studies and derive meaningful conclusions, we focused on the first of these approaches. Thus, this review investigates brain-behavior relationship in the context of understanding the nature of the impairment contrasted with a healthy community comparison group, and potentially an additional psychiatric control. One benefit of this strategy is that by characterizing normative functioning of a brain region we can better understand the nature of the association with symptomatology (e.g., if we find that hyperactivity in a region is characteristic of patients with schizophrenia compared to controls and it has a positive association with negative symptoms, it provides convergent evidence as to the nature of the association). This was a common approach taken across studies and yielded a number of interesting findings despite being a relatively conservative approach. Restricting the scope of the review also allowed us to consider specific characteristics of each study in summarizing results.
However, one possible consequence of summarizing studies using cognitive tasks to elicit brain activity is that it may distort the pattern compared to if symptoms were directly examined in relation to brain activity. Alternatively, using cognitive tasks to elicit brain activity may increase our ability to detect an interpretable association, as the symptoms of schizophrenia are thought to be associated with cognitive deficits. Consequently, if a region is not functioning as necessary during a cognitive task it may reflect a persistently abnormal brain dysfunction that underlies aspects of psychotic symptomatology. By challenging a neural system or node by increasing cognitive demand, investigators may better reveal the relationship between symptom dimensions and activity in specific brain regions. Because cognitive tasks activate select brain regions, we grouped studies by task domain. Studies utilizing tasks measuring executive function, affective processes, and processing speech were considered. One reason for combining specific tasks into domains was to demonstrate the generalizability of the findings beyond specific task mechanisms to the global construct being measured by the different tasks in a domain. For studies employing executive functioning tasks, we reviewed symptom relationships with dorsolateral and ventrolateral prefrontal cortical activity. For affective functioning tasks, we examined symptom relationships with medial prefrontal, limbic, and ventral striatal functioning. For speech processing tasks, symptom relationships with the temporal lobe were assessed. When activations encompassed two regions of interest (e.g., amygdala/hippocampus, middle/superior temporal lobe) the findings were coded for both of the regions. From all the papers that corresponded to our key word search, twenty-five published or in-press papers were identified that met review criteria. Studies that did not meet criteria are integrated into the discussion as convergent or divergent evidence.
Effect Size Coding
A comprehensive approach to the review was undertaken with both qualitative and quantitative summaries being provided. Prior to the meta-analytic summary, a description of each study within a domain is provided to consider study differences. After the qualitative review, for each brain region and related symptom dimension a weighted mean effect size, a Q heterogeneity statistic, and confidence intervals were computed. These statistics were calculated using publicly available meta-analytic software (Steel, 2008). For the quantitative summaries, findings across hemisphere were combined. This was done to increase the robustness of any potential symptom-function relationship, as differential hemisphere activation may often reflect the cognitive processes recruited by specific task demands (Gur & Chin, 1999). Furthermore, many brain regions demonstrate bilateral functional and structural abnormalities in schizophrenia when samples are sufficiently large (e.g., Glahn et al., 2005; Wright et al., 2000). In studies where multiple task manipulations were provided, we included all associations between task manipulation and symptoms, but weighted the sample only once.
The direction of the symptom effect was coded to be positive if it was consistent with the hypothesized finding based on the deviation from normative function from a comparison analysis with healthy controls. For example if hypofrontality was found to be have a negative association with symptoms, the effect in the tables would be reported as positive as less activity would be hypothesized to be associated with greater symptomatology. Likewise, if increased activity in a region relative to controls was found to have a positive association with symptoms, the effect in the tables would be reported as positive because greater activity compared to controls would be expected to be related to greater symptoms in patients. When patients with different types of symptoms were compared, we would code the effect as positive if the group with the psychopathology of interest deviated from the other psychiatric comparison group and controls. The effect was coded negative if higher symptom levels were associated with more normative BOLD responses (i.e., similar to controls). Where effect sizes were reported as large a value of r=0.50 was assigned, r=0.30 for medium, and r=0.10 for small (Lipsey & Wilson, 2001). We converted p, t, F statistics to r values for studies in which only comparison statistics for differences in brain activity between psychiatric groups were provided.
Results
Table 1 provides demographic information for studies reviewed. Specific symptoms included in the dimensions are provided in the tables.
Table 1.
Demographics for Studies Reviewed
| Study | Patients | Comparison Patients | Controls | Medication | ||||||
|---|---|---|---|---|---|---|---|---|---|---|
| N | Age | M/F | N | Age | M/F | N | Age | M/F | ||
| Executive Functioning Studies | ||||||||||
| Manoach (1999) | 12 | 42.4 (5.2) | 12/0 | 10 | 37.7 (11.0) | 10/0 | Yes | |||
| Manoach (2000) | 9 | 42.4 (7.8) | 7/2 | 9 | 38.7 (10.6) | 7/2 | Yes | |||
| Arce (2006) | 17 | 40.9 (7.5) | 13/4 | 17 | 39.8 (8) | 14/3 | Yes | |||
| Perlstein (2001) | 17 | 36.5(7.5) | 11/6 | 16 | 36.5(6.9) | 10/6 | Yes | |||
| Menon (2001) | 11 | 44.6 (4.6) | 11/0 | 13 | 42.5 (3.9) | 13/0 | Yes | |||
| Snitz (2005) | 23 | 23.0 (5.9) | 16/7 | 24 | 23.4 (4.9) | 13/11 | Never | |||
| MacDonald (2005) | 18 | 27.5 (10.2) | 13/5 | 121 | 26.5 (9.4) | 8/4 | 28 | 25.4 (7.5) | 18/10 | Never |
| MacDonald (2003) | 17 | 34.2 (7.7) | 12/5 | 17 | 33.5 (5.8) | 12/5 | Yes | |||
| Emotion Processing Studies | ||||||||||
| Hempel (2003) | 9 | 26 | 4/5 | 10 | 28 | 6/4 | Yes | |||
| Williams (2004) | 132 | 26.8 (9.1) | 8/5 | 143 | 27.8 (10.4) | 9/5 | 22 | 27.2 (8.1) | 14/8 | Yes |
| Williams (2007) | 132 | 26.9 (9.1) | 8/5 | 143 | 27.8 (10.4) | 9/5 | 13 | 25.1 (8.1) | Yes | |
| Taylor (2007) | 114 | 37.8 (10.9) | 9/2 | 125 | 40.4 (10.2) | 8/4 | 15 | 39.4 (10.1) | 10/5 | Yes |
| Gur (2002) | 14 | 28.8 (8.9) | 10/4 | 14 | 27.4 (7.3) | 10/4 | Yes | |||
| Gur (2007) | 16 | 30.1 (6.5) | 12/4 | 17 | 25.0 (3.9) | 12/5 | Yes | |||
| Russell (2006) | 72 | 42.2 (6.3) | 7/0 | 83 | 46.9 (8.4) | 7/0 | 10 | 35.6 (10.4) | 10/0 | Yes |
| Phillips (1999) | 52 | 43 | 53 | 31 | 5 | 30 | Yes | |||
| Surguladze (2006) | 15 | 43.1 (8.8) | 15/0 | 11 | 36.8 (10.6) | 11/0 | Yes | |||
| Reward and Conditioning Studies | ||||||||||
| Juckel (2006) | 10 | 26.8 (7.8) | 10/0 | 10 | 31.7 (8.4) | 10/0 | No | |||
| Jensen (2008) | 13 | 37.6 (8.5) | 10/3 | 13 | 36.5 (11.8) | 9/4 | Yes | |||
| Juckel (2006) | 106 | 31.5 (11.3) | 8/2 | 107 | 37.6 (11.3) | 6/4 | 10 | 30.6 (8.4) | 8/2 | Yes |
| Speech Processing Studies | ||||||||||
| Koeda (2006) | 14 | 31.6 (7.0) | 12/2 | 14 | 29.1 (7.8) | 10/4 | Yes | |||
| Ngan (2003) | 14 | 35.1 | 12/2 | 29 | 29.3 | 21/8 | Yes | |||
| Surguladze (2001) | 74 | 37 (11.7) | 4/3 | 75 | 34.7 (9.1) | 6/1 | 7 | 35.7 (11.2) | 5/2 | Yes |
| Allen (2007) | 108 | 34.8 (6.9) | 10/0 | 109 | 34.8 (11.4) | 10/0 | 11 | 29.2 (4.3) | 11/0 | Yes |
| Woodruff (1997) | 810 | 36 (10.3) | 8/0 | 711 | 34.6 (6.9) | 7/0 | 8 | 35.3 (6.3) | 8/0 | Yes |
| Woodruff (con’t) | 712 | 33.6 (10.2) | 7/0 | 713 | 33.6 (10.2) | 7/0 | ||||
Note: M=male; F=female; Mean and standard deviation reported where appropriate and available.
Patients with nonschizophrenia psychosis.
Patients with paranoia.
Patients without paranoia.
Patients with positive symptoms.
Patients without positive symptoms.
Patients treated with typical neuroleptics.
Patients treated with atypical neuroleptics.
Patients with auditory hallucinations.
Patients with no history of auditory hallucinations.
Patients trait-positive for auditory hallucinations.
Patients trait-negative for auditory hallucinations.
Patients state-positive for auditory hallucinations. Same patients as in footnote 13.
Patients state-negative for auditory hallucinations. Same patients as in footnote 12.
Dorsolateral Prefrontal Cortical Functioning During Executive Tasks
Executive functioning encompasses a diversity of cognitive processes including attention, working memory, context processing, and inhibition, which have all been associated with the functions or integrity of the frontal lobe (Duncan & Owen, 2000). Schizophrenia patients demonstrate difficulties in all of the domains of executive functioning (Heinrichs & Zakzanis, 1998). Prefrontal cortical and executive functioning are hypothesized to be related to negative symptoms due to their role in creating self-directed behaviors, deficits in which may underlie alogia, anhedonia, and flat affect. Additionally, prefrontal cortical and executive functioning are hypothesized to be related to disorganization symptoms due their role in suppressing inappropriate behavior, deficits in which may underlie inappropriate affect, formal thought disorder, and bizarre behavior (Liddle, 1987a; Liddle et al., 1992). Due to the a priori association between these executive processes and the dorsolateral prefrontal cortex (Hartley & Speer, 2000), many studies of schizophrenia have focused on the relationship between this region and symptom dimensions.
Qualitative Review
Two studies used a two-factor model of positive and negative symptoms and the Sternberg Item Recognition Paradigm to investigate the maintenance and manipulation aspects of working memory (Manoach et al., 2000; Manoach et al., 1999). In the first study, schizophrenia patients demonstrated greater left dorsolateral prefrontal cortex activation (BA 9/46) than controls and greater impairments in performance were associated with less left dorsolateral prefrontal cortex activation (Manoach et al., 1999). Less activation in the left dorsolateral prefrontal cortex had a large association with greater negative symptoms as measured by the PANSS negative scale. Thus, the more abnormally high activity shown by patients compared to controls, the fewer negative symptoms they expressed. Neither positive nor general psychopathology was related to the activation. However, in the second study in which a smaller sample was used, no significant association was found with either negative or positive symptoms, perhaps due to reduced power (Manoach et al., 2000). In addition, this study found that the schizophrenia group had more heterogeneous dorsolateral prefrontal activation. Only 24 percent of the schizophrenia patients’ individual dorsolateral prefrontal clusters overlapped with the group clusters, which may have diluted the relationship between the group dorsolateral prefrontal activation and symptoms.
A third study also used a two-factor model to investigate the relationship between dorsolateral prefrontal activity during response inhibition and symptoms. Arce and colleagues (2006) used a modified Go/NoGo task to measure implicit learning of contextual information predicting response inhibition in schizophrenia patients and controls. During the traditional executive functioning contrast of NoGo minus Go condition, controls demonstrated greater activation in the left middle frontal gyrus (BA 9) compared to patients. This region was not associated with PANSS total, positive, or negative symptom scores.
A number of studies have also investigated the relationship between dorsolateral prefrontal functioning and all three symptom dimensions, positive, negative, and disorganization. Perlstein and colleagues (2001) used a working memory letter n-back task and the PANSS to measure negative, positive, and disorganization symptoms. Schizophrenia patients displayed impaired cognitive performance and decreased right dorsolateral prefrontal cortical activity (BA 46/9) at the heaviest working memory load compared to controls. Furthermore, a significant large association was found between increased disorganization symptoms and decreased right dorsolateral prefrontal cortex, but no association was found with the negative or positive symptoms. A second working memory study also provided support for the association between disorganization symptoms and dorsolateral prefrontal functioning. Menon and colleagues (2001) using an auditory n-back working memory task demonstrated schizophrenia patients had reduced activation in their right dorsolateral prefrontal cortex compared to controls. This decreased activity corresponded with increased ratings on the BPRS conceptual disorganization item. Decreased activation in the right dorsolateral prefrontal cortex also demonstrated a large association with greater unusual thought content and hallucinatory behavior BPRS items. Withdrawal-retardation, hostility-suspiciousness, and anxiety-depression dimensions did not demonstrate a relationship with this region.
Three studies have used the construct of context processing to examine the relationship between the dorsolateral prefrontal cortical activity and positive, negative, and disorganization symptoms. Context processing is the representation and maintenance of context information needed to make appropriate task-relevant responses (Cohen, Barch, Carter, & Servan-Schreiber, 1999). Snitz and colleagues (2005) utilized a novel context processing task, the Preparing to Overcome Prepotency task, in a drug-naïve sample. Confirmatory analysis of the left dorsolateral prefrontal cortex (BA 9) demonstrated that this region was less active in patients compared to controls and demonstrated a moderate correlation with interference following the instruction to overcome a prepotent response. Furthermore, reduced activation in this region had a large association with greater disorganization symptoms, whereas negative symptoms and positive symptoms had small associations.
Further evidence of a relationship between disorganization symptoms and dorsolateral prefrontal activity during context processing comes from MacDonald and colleagues (2005). In this study an expectancy AX task was used to evaluate whether context processing difficulties were specific to drug-naïve schizophrenia patients. The right dorsolateral prefrontal cortex (including BA 9 and 10) was less active in schizophrenia patients compared to nonschizophrenia psychosis and controls subjects. Furthermore, schizophrenia patients with greater disorganization symptoms showed lower activity when provided the context (i.e., cue) to overcome the prepotent response. The relationship between brain activity in this region was significantly greater for the disorganization dimension than for the positive or negative symptoms, as assessed by the Meng’s z test for differences between correlations. A similar effect was observed in the portion of that region which extended into right BA 10. In this region, disorganization symptoms were correlated with the residual brain activity accounted for by having to maintain the need to subsequently overcome the prepotent response, which was greater in schizophrenia patient compared to controls and nonschizophrenia psychosis. Thus the correlation between residual brain activity and disorganization was positive and significantly greater than the correlation of residual brain activity with positive, but not negative symptoms. One other region of the left middle frontal gyrus (BA 10) was found to be reduced in activity in schizophrenia patients compared to controls only during preparatory activity. This activation had only small associations with disorganization, negative, and positive symptoms.
One expectancy AX task in chronic schizophrenia patients did not provide support for an association between any symptom domain and dorsolateral prefrontal functioning, despite schizophrenia patients having less activity in the left dorsolateral prefrontal cortex (BA 9) compared to controls when preparing to overcome a prepotent tendency (MacDonald & Carter, 2003). One possible reason for the different relationship between disorganization symptoms and the left dorsolateral prefrontal cortex could have been the use of a relatively stable, medicated sample. This interpretation is supported by Snitz and colleagues (2005). This study showed that the same dorsolateral prefrontal cortical region that demonstrated a large significant association with disorganization symptoms in a drug-naïve state was found to have no significant association after four weeks of atypical anti-psychotic treatment. Thus medication status may suppress the association between brain activity and symptom expression.
Quantitative Review
Eight studies totaling 136 patients investigated the relationship between dorsolateral prefrontal activity during executive functioning and negative or positive symptoms (see Table 2). Five studies totaling 98 subjects investigated the above relationship with disorganization symptoms. For both the negative and positive symptom dimensions, the effect sizes were found to be negligible. For the disorganization symptom dimension, a medium effect size was found and the confidence interval did not include zero. In schizophrenia patients, the greater the abnormality in dorsolateral prefrontal activity compared to controls, the more severe their disorganization symptoms. Lastly, the heterogeneity statistics suggests that the mean effect sizes were relatively good indicators for all three symptoms domains.
Table 2.
Studies Investigating Dorsolateral Prefrontal Cortical Functioning During Executive Tasks
| Study | Task | Dorsolateral Prefrontal Cortex | |||
|---|---|---|---|---|---|
| Group Diff | Neg | Pos | Dis | ||
| Manoach (1999)1 | Working memory | ↑ L | −0.51 | 0 | - |
| Manoach (2000)2 | Working memory | ↑ L | 0 | 0 | - |
| Arce (2006)3 | Response inhibition | ↓ L | 0 | 0 | - |
| Perlstein (2001)4 | Working memory | ↓ R | 0 | 0 | 0.74 |
| Menon (2001)5 | Working memory | ↓ R | 0 | 0.58 | 0.50 |
| Snitz (2005)6 | Context processing | ↓ L | 0.27 | −0.16 | 0.58 |
| MacDonald (2005)7 | Context processing | ↓ R | 0.20 | 0 | 0.53 |
| ↑ R | 0.37 | 0.11 | 0.60 | ||
| ↓ L | 0.28 | 0.14 | 0.28 | ||
| MacDonald (2003)8 | Context processing | ↓ L | −0.32 | −0.20 | −0.18 |
| Effect Size | −0.002 | 0.006 | 0.43 | ||
| Q – Heterogeneity Statistic (probability value) | 6.73 (0.67) | 4.72 (0.86) | 10.17 (0.12) | ||
| Confidence Interval Lower Bound | −0.19 | −0.18 | 0.25 | ||
| Confidence Interval Upper Bound | 0.18 | 0.19 | 0.61 | ||
Correlation values reported in table (r or rho).
Neg = negative symptom dimension; Pos = positive symptom dimension; Dis = disorganization symptom dimension Group diff = Difference between groups (where there were multiple patient groups this represented patients pooled together or the result of each individual patient group compared to controls);↑= greater activation in patients compared to controls; ↓ = less activation in patients compared to controls; n.s. = non-significant contrast; L = left; R = right
Note: The direction of the effect size represents whether or not the effect is in a consistent direction with the abnormality compared to controls. A positive effect size represents that abnormal brain activity in patients compared to controls is associated with greater symptom severity (e.g., hypo- and hyperactivity compared to controls is associated with greater symptoms or greater symptoms in the patient group with the symptoms of interest), whereas a negative effect size represents the opposite (e.g., abnormal activity compared to controls is associated with fewer symptoms or the patient group with fewer symptoms of interest).
Symptom dimensions were PANSS positive and negative total scores.
Symptom dimensions were PANSS positive and negative total scores.
Symptom dimensions were PANSS positive and negative total scores.
The negative symptom dimension included the blunted affect, emotional withdrawal, passive social avoidance, motor retardation, and lack of spontaneity PANSS items. The positive symptom dimension included the hallucinations, delusions, and unusual thought content PANSS items. The disorganization symptom dimension included the conceptual disorganization, mannerisms and posturing, difficulty abstracting, and poor attention PANSS items.
The negative symptom dimension was calculated from BPRS items. The positive symptom dimension included the unusual thought content and hallucinatory behavior BPRS items. The disorganization dimension included the conceptual disorganization BPRS item.
The negative symptom dimension included the emotional withdrawal, motor retardation, and blunted affect BPRS items and anhedonia/asociality, avolition/apathy, alogia, and affective flattening SANS items. The positive symptom dimension included the grandiosity, suspiciousness, hallucinations, and unusual thought content BPRS items and hallucinations and delusions SAPS items. The disorganization symptom dimension consisted of the conceptual disorganization, mannerisms and posturing, and disorientation BPRS items and attention, positive formal thought disorder, and bizarre behavior SANS and SAPS items.
Same symptom dimension structure as Snitz et al. (2005). See footnote 6.
The negative symptom dimension included the blunted affect, emotional withdrawal, poor rapport, passive-apathetic social withdrawal, difficulty in abstract thinking, lack of spontaneity, stereotyped thinking, motor retardation, disturbance of volition and active social avoidance PANSS items. The positive symptom dimension included the delusions, hallucinatory behavior, suspiciousness and unusual thought content PANSS items. The disorganization dimension included the conceptual disorganization, difficulty in abstract thinking, poor attention and lack of judgment and insight PANSS items.
Summary
The most convincing evidence was provided for the relationship between disorganization symptoms and dorsolateral prefrontal functioning during executive functioning, with all but one study finding a large interpretable association. When a purely quantitative assessment was invoked the disorganization symptom dimension was found to have a moderate association with dorsolateral prefrontal functioning. Neither the negative or positive symptom dimension was found to have a consistent relationship with dorsolateral prefrontal activity.
Ventrolateral Prefrontal Cortical Functioning During Executive Tasks
The ventrolateral prefrontal cortex has also been found to be activated in wide variety of executive functioning tasks (Duncan & Owen, 2000). As most studies have focused a priori on the role of the dorsolateral prefrontal cortex, only a few studies have additionally investigated the role of the ventrolateral prefrontal cortex during executive functioning tasks and its association with symptoms.
Qualitative Review
Two of the studies that assessed dorsolateral prefrontal cortical functioning during executive functioning also assessed the relationship between activity in the ventral prefrontal cortical region and symptoms. In the study discussed above by Menon and colleagues (2001), schizophrenia patients had reduced bilateral frontal operculum activity and this reduced activity was associated with higher negative symptom scores from the BPRS. In contrast, MacDonald and colleagues (2005) found maintenance-related context activity was associated with increased bilateral inferior frontal activity in schizophrenia patients compared to controls and nonschizophrenia psychosis patients. These activations had a moderate association with disorganization symptoms and a small association with negative and positive symptoms. An additional region of the right inferior frontal cortex with lower activity during preparation had a negligible association with all three symptoms domains.
Quantitative Review
Two studies totaling 41 subjects investigated the relationship between ventrolateral prefrontal activity, executive functioning, and symptoms (see Table 3). There was a medium association between abnormal ventrolateral prefrontal activity during executive functioning and greater severity of negative symptoms. The negative dimension was also the only dimension for which the confidence intervals did not include zero. The effect size was negligible for positive symptoms, whereas it was small for the disorganization dimension. Lastly, the heterogeneity statistics suggest that the mean effect sizes were relatively good indicators for all the symptom domains.
Table 3.
Studies Investigating Ventrolateral Prefrontal Cortical Functioning During Executive Tasks
| Study | Task | Ventrolateral Prefrontal Cortex | |||
|---|---|---|---|---|---|
| Group Diff | Neg | Pos | Dis | ||
| Menon (2001) | Working Memory | ↓ L | 0.897 | 0 | 0 |
| ↓ R | 0.66 | 0 | 0 | ||
| MacDonald (2005) | Context processing | ↑ L | 0.24 | 0.17 | 0.32 |
| ↑ R | 0.18 | 0.03 | 0.36 | ||
| ↓ R | 0.01 | 0.06 | −0.09 | ||
| Effect Size | 0.38 | 0.05 | 0.12 | ||
| Q - Heterogeneity Statistic (probability value) | 3.73 (0.44) | 0.06 (0.99) | 0.54 (0.97) | ||
| Confidence Interval Lower Bound | 0.04 | −0.35 | −0.27 | ||
| Confidence Interval Upper Bound | 0.73 | 0.45 | 0.52 | ||
Correlation values reported in table (r or rho).
Neg = negative symptom dimension; Pos = positive symptom dimension; Dis = disorganization symptom dimension Group diff = Difference between groups (where there were multiple patient groups this represented patients pooled together or the result of each individual patient group compared to controls); ↑= greater activation in patients compared to controls; ↓ = less activation in patients compared to controls; n.s. = non-significant contrast; L = left; R = right
Note: The direction of the effect size represents whether or not the effect is in a consistent direction with the abnormality compared to controls. A positive effect size represents that abnormal brain activity in patients compared to controls is associated with greater symptom severity (e.g., hypo- and hyperactivity compared to controls is associated with greater symptoms or greater symptoms in the patient group with the symptoms of interest), whereas a negative effect size represents the opposite (e.g., abnormal activity compared to controls is associated with fewer symptoms or the patient group with fewer symptoms of interest).
Symptom dimension information for these studies is presented in Table 2.
Summary
In two studies, preliminary evidence was found for a medium relationship between negative symptoms and ventrolateral prefrontal cortical functioning during executive functioning. It is important to note that this is based on an assessment of two studies; one of the two studies found large associations and the second found small to moderate associations. Neither the positive or disorganization symptom dimension was found to have a consistent or convincing relationship with ventrolateral prefrontal cortical activity.
Medial Prefrontal Cortical Functioning During Emotion Tasks
Schizophrenia has been conceptualized as a disorder with prominent social dysfunction, including the inability to represent the mental states of others. This inability includes interpreting the beliefs or intentions of others to predict and explain their behavior. The medial prefrontal cortex is thought to be activated during judgments about the self and others as well as during the viewing of emotionally salient material (Adolphs, 2001; Taylor, Welsh, Chen, Velander, & Liberzon, 2007). One hypothesis is that distortions in reality (e.g., in a delusion) may be due to dysfunction of the medial prefrontal cortex and judgments going awry or finding personal relevance inappropriately in social situations (Taylor, Welsh, Chen, Velander, & Liberzon, 2007).
Qualitative Summary
One study investigated the relationship between medial prefrontal cortical activity during emotion recognition tasks and the two-factor positive and negative dimensions. Hempel and colleagues (2003) studied emotion-matching and emotion-labeling tasks in first-episode schizophrenia patients and healthy controls. In the emotion-matching task, schizophrenia patients showed a trend towards increased activation in the bilateral medial frontal gyri compared to controls. In the emotion labeling task, schizophrenia patients had greater activation in the bilateral medial frontal gyri compared to controls. The medial frontal region was not associated with PANSS positive or negative total scores. One reason for this lack of association may be that both positive and negative emotions were analyzed together. Studies that investigate emotions of different valence separately tend to show larger effect sizes for and find a specific role for fear or threat-provoking stimuli.
Given that a number of studies have found the greatest impairments in facial recognition are for threat-related or negative expressions such as fear, much recent interest has focused on paranoia symptoms specifically. Previous research suggests that schizophrenia patients have an increased sensitivity to threat-related material, but may also demonstrate threat avoidance (S. Surguladze et al., 2006). This led Williams and colleagues to predict paranoid patients would have enhanced arousal to fear, but have reduced activity in their medial prefrontal regions, suggesting impaired processing of threat-related material. One such study conducted by Williams and colleagues (2004) compared paranoid and nonparanoid patients and controls while viewing fear or neutral facial expressions during simultaneous fMRI and skin conductance recordings. In schizophrenia patients as a group compared to controls, the medial prefrontal cortex (BA 8/9/32) was found to be lower in activity than controls when viewing facial expressions of fear compared to neutral expressions only if accompanied by high skin conductance levels. Facial expressions of fear versus neutral expressions were found to result in reduced right dorsal medial prefrontal cortex (BA 8) whereas paranoid patients had greater ventral medial prefrontal cortical activity (BA 10) compared to nonparanoid patients. Further analyses were conducted to investigate the pattern of brain activity when fearful expressions were differentiated by skin conductance level. When fearful expressions were not accompanied by high skin conductance levels paranoid patients had less activation in their left lateral prefrontal cortex, extending medially (BA 44) compared to nonparanoid patients. Convergent behavioral evidence demonstrated paranoid schizophrenia patients had more difficulty distinguishing fearful faces and greater skin conductance responses than nonparanoid patients.
These findings were replicated in a second study of the same of paranoid and nonparanoid patients and controls by Williams and colleagues (2007). This study used a similar methodology, but also included angry and disgust emotions. In support of their previous findings, all patients showed reduced activation in their dorsal medial prefrontal cortex, when fearful compared to neutral stimuli were accompanied by high skin conductance levels. Specifically, paranoid patients had less activity in their ventral medial prefrontal activity (BA 8) compared to nonparanoid patients. Reduced medial prefrontal activity (BA 9) with high skin conductance levels was also found for anger pictures in paranoid patients compared to nonparanoid patients, but not controls. There were no differences in the medial prefrontal cortical activation between the paranoid and nonparanoid patients for any of three emotions when they were not accompanied by high skin conductance levels.
Taylor and colleagues (2007) were interested in investigating medial prefrontal functioning using neutral, positive, and aversive pictures selected from the International Affective Picture System (IAPS), rather than facial expressions. This study compared schizophrenia or schizoaffective patients with prominent positive symptoms to patients without prominent positive symptoms and controls. In the negative versus neutral pictures contrast (as well as aversive versus blank images contrast), patients with positive symptoms demonstrated greater activation than patients without positive symptoms and controls in their anterior medial prefrontal cortex (BA 10). A whole brain analysis of positive symptoms and BOLD signal provided confirmatory evidence of the association with the medial prefrontal cortex (BA 10). Negative symptoms and general severity were not associated with the medial prefrontal activity.
Quantitative Summary
Four studies including 86 patients explored the relationship between medial prefrontal activity and positive symptoms or paranoia specifically (see Table 4). These studies demonstrated a medium effect between abnormal medial prefrontal activity and more severe positive symptoms. The confidence interval did not include zero and the heterogeneity statistic suggested the effect size were relatively good indicators of the magnitude. The two studies that investigated negative symptoms suggested that the medial prefrontal cortex is not invoked by negative symptoms during emotional functioning; however negative symptoms were not a focus of the studies.
Table 4.
Studies Investigating Medial Prefrontal Cortical Functioning During Emotion Tasks
| Study | Task | Medial Prefrontal Cortex | ||
|---|---|---|---|---|
| Group Diff | Neg | Pos | ||
| Hempel (2003)1 | Emotion–labeling | ↑ LR | 0 | 0 |
| Williams (2004)2 | Fearful faces | ↓ LR | - | 0.49 |
| −0.49 | ||||
| 0.49 | ||||
| Williams (2007)3 | Negative faces | ↓ R | - | 0.49 |
| n.s. | 0.49 | |||
| Taylor (2007)4 | Negative images vs. neutral images |
↑ | 0 | 0.56 |
| Effect Size – Quantitative | - | 0.36 | ||
| Q - Heterogeneity Statistic (probability value) | - | 7.93 (0.24) | ||
| Confidence Interval Lower Bound | - | 0.16 | ||
| Confidence Interval Upper Bound | - | 0.55 | ||
Correlation values reported in table (r or rho).
Neg = negative symptom dimension; Pos = positive symptom dimension Group diff = Difference between groups (where there were multiple patient groups this represented patients pooled together or the result of each individual patient group compared to controls); ↑= greater activation in patients compared to controls; ↓ = less activation in patients compared to controls; n.s. = non-significant contrast; L = left; R = right
Note: The direction of the effect size represents whether or not the effect is in a consistent direction with the abnormality compared to controls. A positive effect size represents that abnormal brain activity in patients compared to controls is associated with greater symptom severity (e.g., hypo- and hyperactivity compared to controls is associated with greater symptoms or greater symptoms in the patient group with the symptoms of interest), whereas a negative effect size represents the opposite (e.g., abnormal activity compared to controls is associated with fewer symptoms or the patient group with fewer symptoms of interest).
Symptom dimensions were PANSS positive and negative total scores.
The paranoid group was defined by moderate or greater severity ratings on delusions, suspiciousness, grandiosity, and excitement PANSS items. Other than these four items there was no significant difference between groups on any remaining PANSS items. Used best estimation to convert statistics comparing groups with differing symptom presentation/severity to r values reported in table.
The paranoid group was defined as moderate or greater severity on delusions, suspiciousness, grandiosity, and excitement on SAPS items. In addition, this group was defined as having greater passive/apathetic withdrawal and poor interpersonal function from the Social Functioning Scale. Used best estimation to convert statistics comparing groups with differing symptom presentation/severity to r values reported in table.
The positive symptoms group had greater symptoms of unusual thought content, suspiciousness, and hallucinations BPRS items. No patient included in the study had a score greater than mild on the disorganization BPRS item.
Summary
There was a promising medium association between positive symptoms and medial prefrontal functioning during emotion processing tasks. There were no associations with negative symptoms; however evaluating these symptoms was not the goal of most of these studies.
Amygdala and Hippocampal/Parahippocampal Functioning During Emotion Tasks
The amygdala is hypothesized to have a crucial role in identifying emotional significance, producing affective states, and regulating autonomic responses (Phillips, Drevets, Rauch, & Lane, 2003a). Lesions to the amygdala in animals have led to social disinhibition and emotional blunting. The hippocampus long thought to have a role in spatial memory and episodic memory, may also have a role in regulating affective states, such as generating behaviors in threatening or potentially threatening contexts (Phillips, Drevets, Rauch, & Lane, 2003a). The parahippocampal gyrus has a role in context appraisal (Sacchetti, Lorenzini, Baldi, Tassoni, & Bucherelli, 1999) and has close connections to the hippocampus and amygdala. Impairments in the amygdala, hippocampus, and parahippocampal gyrus could lead to abnormal emotion recognition, a reduction in the number of emotional states produced, misinterpretation of neutral or ambiguous situations as threatening, and a reduced ability to regulate affective states. Dysfunction in these regions could lead to flat affect, anhedonia, or persecutory delusions depending on the specific processes impaired (Phillips, Drevets, Rauch, & Lane, 2003b).
Qualitative Summary
Two studies investigated amygdala and hippocampus using facial emotion processing tasks, and a two-factor positive and negative symptom dimension model. Gur and colleagues (2002) investigated emotion recognition of negative versus positive emotions and age recognition (as a control task) in schizophrenia patients and controls. Patients had less activation in their left amygdala and bilateral hippocampi compared to controls during emotion recognition only; however no associations were found between these regions and the SAPS or the SANS total score. Similarly, in the study by Hempel and colleagues (2003) described above, schizophrenia patients also had lower activation in bilateral amygdala-hippocampus compared to controls during the emotion labeling task. None of these regions were associated with PANSS positive or negative total scores.
In a second study by Gur and colleagues (2007) specific emotions (fear, happy, sad, anger, and neutral expressions) were labeled target and non-target by schizophrenia patients and controls. For both anger and fear faces compared to neutral faces in the amygdala, controls showed more activation for correctly identified faces, whereas patients showed greater activation for misidentified faces. A similar pattern was seen for the hippocampus for fear faces compared to neutral faces. Both the amygdala and hippocampus had large associations with flat affect in schizophrenia patients when viewing fear expressions.
Many investigators have studied negative stimuli specifically in patients with paranoid or positive symptoms. In addition, to abnormal medial prefrontal activity, Williams and colleagues (2004) predicted schizophrenia patients and more specifically paranoid patients would have reduced amygdala activity. Schizophrenia patients had reduced left amygdala activity compared to controls during fear faces compared to neutral faces accompanied with high skin conductance levels. In addition, when fearful expressions were accompanied with high skin conductance levels, paranoid patients also had reduced left amygdala activation compared to nonparanoid patients.
These findings were replicated in second study by Williams and colleagues (2007) in the same paranoid and nonparanoid patients and control sample using a similar methodology as described previously. In support of their previous findings, when fearful stimuli were accompanied by high skin conductance levels, schizophrenia patients in general had lower activity in their left amygdala and more specifically paranoid patients had less amygdala activity compared to nonparanoid patients.
Other researchers have suggested a more complicated hypothesis regarding the functioning of amygdala and hippocampus in processing neutral and fear invoking stimuli (S. Surguladze et al., 2006). Rather than solely decreased neural responses of the amygdala (and hippocampus) during fear invoking stimuli, paranoid patients may have an increased response to neutral or positive stimuli. These increased responses to neutral or positive stimuli, may underlie positive symptoms, which are thought to be the manifestation of false significance given to inappropriate or nonthreatening stimuli (Phillips, Drevets, Rauch, & Lane, 2003b). Phillips and colleagues (1999) investigated processing of fear, anger, or mildly happy faces in paranoid and nonparanoid patients and controls. Paranoid schizophrenia patients showed greater activation to neutral faces compared to disgust faces (i.e., deactivation to disgust faces) in their hippocampus compared to nonparanoid patients (as there was no statistical comparison to the control group, this effect is not presented as part of the quantitative review).
In a similar study, Russell and colleagues (2006) investigated the effects of emerging versus dissipating fear images in paranoid and nonparanoid male schizophrenia patients and controls. In the bilateral amygdala/hippocampal border and left dorsolateral amygdala, nonparanoid and paranoid patients had a trend towards a significant difference. Nonparanoid patients and controls demonstrated the expected greater response to emerging versus dissipating fearful expressions. In the right amygdala, nonparanoid patients had a trend towards a greater response to emerging versus dissipating fearful expression. Additionally, the paranoia was correlated with the two amygdala and one amygdala/hippocampal region and greater activation to emerging versus dissipating fear was associated with less paranoia (these correlations are reported in Table 5). The findings in the paranoid group are more difficult to interpret as a neutral baseline condition was not included. Hence the values in the paranoid group could have been driven by either deactivation in response to emerging fear or an increase in activation in response to the dissipating fear condition.
Table 5.
Studies Investigating Amygdala and Hippocampus/Parahippocampal Gyrus Functioning During Emotion Tasks
| Study | Task | Amygdala | Hippocampus & Parahippocampal Gyrus | ||||||
|---|---|---|---|---|---|---|---|---|---|
| Group Diff | Neg | Pos | Dis | Group Diff | Neg | Pos | Dis | ||
| Gur (2002)1 | Emotion-labeling | ↓ L | 0 | 0 | - | ↓ LR | 0 | 0 | - |
| Hempel (2003)2 | Emotion-labeling | ↓ LR | 0 | 0 | - | ↓ LR | 0 | 0 | - |
| Gur (2007)3 | Emotion-labeling | ↓ for correct | 0.94 | 0 | - | ↓ for correct | 0.5* | 0 | - |
| (target/non-target) | identification | identification | |||||||
| ↑ for mis- identification |
↑ for mis- identification |
||||||||
| Williams (2004)4 | Fear & neutral faces | ↓ L | - | 0.49 | - | - | - | - | |
| Williams (2007)5 | Fear & neutral faces | ↓ L | - | 0.49 | - | - | - | - | |
| Russell (2006)6 | Fear faces | ↓ L | - | 0.49 | - | ↓ L | - | 0.49 | - |
| n.s. ↓ L | 0.50 | ||||||||
| n.s. ↓ R | 0.56 | ||||||||
| Surguladze (2006) 7 | Fear & neutral faces | n.s. R | 0 | 0.55 | 0 | ↑ R | 0 | 0.74 | 0 |
| n.s. L | 0 | 0 | 0 | n.s. ↑ R | 0 | 0.52 | 0 | ||
| Taylor (2007)8 | Negative & neutral images |
↑ L | - | 0 | - | - | - | - | - |
| Effect Size – Quantitative | 0.28 | 0.26 | - | 0.15 | 0.24 | - | |||
| Q - Heterogeneity Statistic (probability value) | 26.34 (<0.001) | 8.46 (0.58) | - | 2.63 (0.62) | 5.56(0.35) | - | |||
| Confidence Interval Lower Bound | 0.02 | 0.11 | - | -0.13 | 0.01 | - | |||
| Confidence Interval Upper Bound | 0.54 | 0.42 | - | 0.42 | 0.48 | - | |||
Correlation values reported in table (r or rho).
Neg = negative symptom dimension; Pos = positive symptom dimension; Dis = disorganization symptom dimension Group diff = Difference between groups (where there were multiple patient groups this represented patients pooled together or the result of each individual patient group compared to controls); ↑= greater activation in patients compared to controls; ↓ = less activation in patients compared to controls; n.s. = non-significant contrast; L = left; R = right
Note: The direction of the effect size represents whether or not the effect is in a consistent direction with the abnormality compared to controls. A positive effect size represents that abnormal brain activity in patients compared to controls is associated with greater symptom severity (e.g., hypo- and hyperactivity compared to controls is associated with greater symptoms or greater symptoms in the patient group with the symptoms of interest), whereas a negative effect size represents the opposite (e.g., abnormal activity compared to controls is associated with fewer symptoms or the patient group with fewer symptoms of interest).
Authors reported a large association which was assigned a value of 0.5.
Symptom dimensions used were SAPS positive and SANS negative total scores.
Symptom dimension information for this study is presented in Table 4, footnote 1.
The negative dimension consisted of only the flat affect SANS item.
Symptom dimension information for this study is presented in Table 4, footnote 2. Used best estimation to convert statistics comparing groups with differing symptom presentation/severity to r values reported in table.
Symptom dimension information for this study is presented in Table 4, footnote 3. Used best estimation to convert statistics comparing groups with differing symptom presentation/severity to r values reported in table.
The paranoid group was defined as having moderate or greater severity on two SAPS items assessing delusional thinking that someone was trying to harm or plotting against them (including beliefs that other were talking about them behind their backs). The paranoid group, however, also had greater amount of negative symptoms, passivity, and hallucination symptoms.
The positive symptom dimension consisted of auditory hallucinations directed at the patient, delusions of persecution, and delusions of reference SAPS items. The negative symptom dimension consisted of blunted affect, poverty of speech, and decreased spontaneous movement SANS items. The disorganization symptom dimension consisted of inappropriate affect, poverty of content of speech, and positive formal thought disorder SAPS and SANS items.
Symptom dimension information for this study is presented in Table 4, footnote 4.
The most convincing evidence that paranoid patients may also react more strongly to neutral stimuli comes from a study by Surguladze and colleagues (2006). This study examined the processing of neutral, mildly fearful, and fearful faces in male schizophrenia patients and male controls and their association with positive, negative, and disorganization symptoms. Controls demonstrated increased activity to increasing fearful expression (neutral–mild–intense fear) in the right hippocampus and parahippocampal gyrus. Schizophrenia patients displayed increased activation to decreasing fearful expression (intense fear–mild–neutral) in these regions. Subsequent analyses demonstrated that schizophrenia patients had more activation to neutral faces compared to controls and greater activation to neutral and mildly fearful faces were associated with greater paranoia symptoms. Only the correlation with neutral faces was significant after additionally covarying for depression and IQ. Although differences between groups were not found for the amygdala, exploratory analyses demonstrated that the right amygdala had a positive association with positive symptoms during processing of both neutral and fearful faces. No such associations were found for negative and disorganization symptoms.
Lastly, Taylor and colleagues (2007) as described previously were interested in relating IAPS pictures to amygdala activity in addition to the reported medial prefrontal activity. Healthy controls had greater activity in the left amygdala compared to all schizophrenia patients for the neutral versus blank picture comparison. However, in contrast to the findings in the medial prefrontal cortex, the amygdala did not show differential effects between patients with and without positive symptoms.
Quantitative Summary
Eight studies encompassing 146 subjects investigated the relationship between the amygdala and positive symptoms and four studies encompassing 54 patients investigated the relationship between the amygdala and negative symptoms (see Table 5). Five of those studies encompassing 92 patients investigated the relationship between the hippocampus/parahippocampal gyrus and positive symptoms and four studies encompassing 54 patients investigated the relationship between the hippocampus/parahippocampal gyrus and negative symptoms. Small effects were found for the amygdala and hippocampus/parahippocampal gyrus and positive symptoms. For both the associations, the confidence intervals did not include zero and the heterogeneity statistic suggested that the effect sizes were relatively good indicators. A small effect was also found for the association between the amygdala and negative symptoms. However, the heterogeneity statistic suggested that the effect size was not a good indicator, reflecting that the finding was driven by one study. The association between the hippocampus/parahippocampal gyrus and negative symptoms was found to be negligible in these studies.
Summary
Suggestive evidence existed for a small relationship between the amygdala and hippocampus/parahippocampal gyrus and positive symptoms. The effect was most prominent when patients with paranoid symptoms were considered. Also, one study found a relationship between amygdala and hippocampus/parahippocampus gyrus and flat affect. This resulted in a small overall effect which should be interpreted with caution.
Ventral Striatum During Reward and Conditioning Tasks
The ventral striatum, which contains the nucleus accumbens, is proposed to have a key role in both affective negative and positive symptoms. The ventral striatum may have a role in creating negative symptoms such as flattened affect or anhedonia, as dysfunction of this system is thought to be associated with reduced motivation (Breiter, Aharon, Kahneman, Dale, & Shizgal, 2001; Phillips, Drevets, Rauch, & Lane, 2003b). The ventral striatum is also thought to play a role in creating positive symptoms as this region is hypothesized to have a role in learning associations. Misfiring of dopamine neurons in this region may lead to reinforcement of false associations and relate to the creation of delusions (Kapur, 2003).
Qualitative Summary
Three studies investigated ventral striatum functioning and its relationship with positive and negative symptom dimensions. The first study, by Juckel and colleagues (2006), used a reward prediction task in unmedicated schizophrenia patients and controls during invoked anticipation of gain (i.e. reward), loss (i.e. punishment), or no consequence. The left ventral striatum demonstrated reduced activation during both gain and loss anticipation in patients compared to controls. Furthermore, reduced activation had a large association with more severe PANSS negative, positive, and total scores during gain anticipation. This study provides support for the role of the ventral striatum in creating affective negative and positive symptoms in schizophrenia.
A second study investigated ventral striatum functioning using an aversive Pavlovian conditioning task in medicated schizophrenia patients and controls (Jensen et al., 2008). There were no significant differences in the ventral striatum for conditioned stimuli; however, patients were found to have greater right and left ventral striatal activity compared to controls for neutral stimuli. Small associations were found for the neutral stimuli and negative and positive symptoms in the ventral striatum. During the conditioned stimuli, there was a moderate relationship between negative symptoms and the ventral striatal activity, and a small relationship with positive symptoms. Possible reasons for the attenuated associations in this study could have been the use of a medicated sample, which may affect dopamine functioning in the ventral striatum. The authors, however, only found small association between medication and ventral striatal activity. Regardless, atypical neuroleptics may be ameliorating some of the symptoms of schizophrenia. Indeed, the subjects in the Jensen and colleagues (2007) study had fewer and/or less severe symptoms and this difference was greater for positive than negative symptoms.
Support that atypical medications affect the relationship between symptoms and striatal functioning comes from another study by Juckel and colleagues (2006), who studied schizophrenia patients on atypical versus typical anti-psychotic medication and controls. This study found that controls and schizophrenia patients treated with atypical neuroleptics showed ventral striatal activation to reward anticipation, but patients treated with typical neuroleptics did not and that lower left ventral striatum activity was associated with increased severity of negative symptoms.
Quantitative Summary
Three studies encompassing 33 subjects investigated ventral striatum functioning during reward and conditioning processes and the negative symptom dimension (see Table 6). Two studies encompassing 23 subjects investigated the relationship with the positive symptom dimension. The effect size was medium for the negative symptom dimension, whereas it was small for the positive dimension. Only for the negative dimension did the confidence interval not include zero. In addition, the heterogeneity statistic suggested that the mean effect sizes were relatively good indicators of magnitude.
Table 6.
Studies Investigating Ventral Striatum Functioning During Reward and Conditioning Tasks
| Study | Task | Ventral Striatum | ||
|---|---|---|---|---|
| Group Diff | Neg | Pos | ||
| Juckel (2006) | Reward prediction | ↓ L | 0.66 | 0.61 |
| Jensen (2008) | Pavlovian conditioning | ↑ LR | −0.13 | 0.10 |
| n.s.1 | 0.37 | −0.18 | ||
| Juckel (2006) | Reward prediction | ↓ L 2 | 0.67 | - |
| Effect Size – Quantitative | 0.45 | 0.24 | ||
| Q - Heterogeneity Statistic (probability value) | 2.62 (0.45) | 2.14 (0.34) | ||
| Confidence Interval Lower Bound | 0.16 | −0.17 | ||
| Confidence Interval Upper Bound | 0.74 | 0.66 | ||
Correlation values reported in table (r or rho).
Neg = negative symptom dimension; Pos = positive symptom dimension Group diff = Difference between groups (where there were multiple patient groups this represented patients pooled together or the result of each individual patient group compared to controls); ↑= greater activation in patients compared to controls; ↓ = less activation in patients compared to controls; n.s. = non-significant contrast; L = left; R = right
Note: The direction of the effect size represents whether or not the effect is in a consistent direction with the abnormality compared to controls. A positive effect size represents that abnormal brain activity in patients compared to controls is associated with greater symptom severity (e.g., hypo- and hyperactivity compared to controls is associated with greater symptoms or greater symptoms in the patient group with the symptoms of interest), whereas a negative effect size represents the opposite (e.g., abnormal activity compared to controls is associated with fewer symptoms or the patient group with fewer symptoms of interest).
There was no significant difference between patients and controls for this contrast; however since patients were expected to have less activity in this region – the extracted BOLD response correlations with symptoms were coded to be consistent with this hypothesis.
In patients on typical anti-psychotics only.
Symptom dimensions used for all the studies were PANSS positive and negative total scores.
Summary
A moderate relationship between abnormal ventral striatum functioning and greater negative symptoms was found. In addition, the research suggested that anti-psychotic medications may play a role in ameliorating the relationship between positive symptoms and brain functioning in this region.
Middle and Superior Temporal Lobe Functioning During Speech Processing Tasks
The temporal lobe is involved in fundamental processes such as hearing, receptive language, and information retrieval. The middle and superior temporal lobe are hypothesized to have a role in language and semantic memory processes. Speech and language tasks are thought to tap into processes that lead to disordered thinking and/or auditory hallucinations. Verbal hallucinations are thought to arise when internal speech is misattributed to external sources or alternatively auditory hallucinations may reflect trouble with speech perception in general (Kuperberg & Heckers, 2000). Disordered thinking may be caused by a specific problem in processing semantic meaning (Kuperberg & Heckers, 2000).
Qualitative Summary
One study investigated the relationship between language processing and the two-factor model of positive and negative symptoms. Koeda and colleagues (2006) investigated auditory language processing of sentences, sentences presented in reverse, and non-vocal sounds in schizophrenia patients and controls. Controls showed greater activation than schizophrenia patients in their bilateral superior sulci and middle temporal region. Anterior and posterior superior and middle temporal regions were uncorrelated with positive and negative dimensions computed from the BPRS. This lack of relationship may be due to looking at the two-factor model of symptoms, rather than specific symptoms such as auditory hallucinations or formal thought disorder.
Ngan and colleagues (2003) used an auditory oddball task in schizophrenia patients and controls to investigate the relationship between brain activity and formal thought disorder. In this task, occasional (i.e., oddball) speech and complex non-speech sounds were intermixed with background tones. Patients had greater activation in the right middle and superior temporal gyri compared to controls during speech compared to nonspeech oddball stimuli. Activity in this combined middle/superior temporal region was uncorrelated with formal thought disorder. However, the two temporal-parietal junction regions were found to have a significant relationship with the thought disorder score (r=0.46).
A number of studies have also focused on studying patients with current positive symptoms compared to those without. Surguladze and colleagues (2001) investigated seven patients with positive symptoms and seven without those symptoms (remitted) during an audio-visual speech task. Controls showed greater activation than schizophrenia patients in bilateral superior and middle temporal gyri (BA 42, 22, 21) during a lip reading task. Patients with positive symptoms showed more activation in the bilateral superior temporal cortex (BA 22) and left middle temporal gyrus (BA 21) than did the remitted group during a lip-reading task.
Similarly, Allen and colleagues (2007) investigated misattribution of speech in schizophrenia patients with auditory verbal hallucinations, patients with no history of hallucinations, and healthy controls. Participants listened to words spoken by themselves or by another person. These words were either distorted or not. In the left superior temporal gyrus (BA 22) the non-hallucinating and control group showed greater activation when processing alien speech compared to self-speech, whereas the hallucinating group showed a similar response for both alien and self-speech. In the right superior temporal gyrus, the hallucinatory group showed greater activation for distorted compared to the undistorted self speech, whereas the opposite pattern was found for the non-hallucinatory group and distortion did not affect the activation pattern in this region for the control group. In the left middle temporal gyrus (BA 21) both the control and non-hallucinating group showed greater activation for correct responses than misattributions, whereas there was no difference in the hallucinating group. This pattern was also present when correct identification of self-speech was compared to misattribution of alien speech.
Lastly, Woodruff and colleagues (1997) investigated male schizophrenia patients who had a history of auditory hallucinations (trait positive) but were not actively hallucinating to seven male schizophrenia subjects who had never hallucinated (trait negative) and controls. Furthermore, seven subjects were scanned during a period of severe ongoing hallucinations (state positive) and after those hallucinations (state negative) had diminished. Schizophrenia patients (trait negative and trait positive patients) showed less activity in the left superior temporal gyrus and more activation in the right middle temporal gyrus compared to controls. No notable differences between the trait-positive and trait-negative groups were found. External speech activated to a lesser extent the right middle temporal gyrus and left superior temporal gyrus in the hallucination state-positive group than the state-negative group.
Quantitative Summary
Four studies with 70 schizophrenia patients investigated the relationship between the middle and superior temporal lobe and positive symptoms of schizophrenia. The middle temporal lobe effect size indicated that its relationship with positive symptoms was not in an expected direction (see Table 7). A negative effect size indicated when compared to controls and/or other psychopathology group, the group with positive symptoms was more similar to the control group. The effect size for the superior temporal lobe reflected a negligible association in the expected direction. For both regions, the confidence interval included zero and the heterogeneity statistics suggested the effect sizes were not the best indicators of magnitude.
Table 7.
Studies Investigating Middle and Superior Temporal Lobe Functioning During Speech Processing Tasks
| Study | Task | Middle Temporal Lobe | Superior Temporal Lobe | ||||
|---|---|---|---|---|---|---|---|
| Group Diff |
Pos | Dis | Group Diff | Pos | Dis | ||
| Koeda (2006)1 | Speech/Non-speech | ↓ LR | 0 | - | ↓ LR | 0 | - |
| Ngan (2003)2 | Speech/Non-speech | ↑ R | - | 0 | ↑ R | - | 0 |
| Surguladze (2001) 3 | Nonvisual speech | ↓ LR | −0.85 | - | −0.75 | - | |
| Allen (2007)4 | Speech appraisal | ↓ L | 0.40 | - | ↑ R | 0.40 | - |
| ↓ L | 0.40 | ||||||
| Woodruff (1997)5 | Listening to speech | ↑ R | −0.70 | - | ↓ L | 0.70 | - |
| Effect Size – Quantitative | −0.22 | - | 0.12 | - | |||
| Q - Heterogeneity Statistic (probability value) | 23.48 (<0.001) | - | 20.72 (<0.001) | - | |||
| Confidence Interval Lower Bound | −0.47 | - | −0.14 | - | |||
| Confidence Interval Upper Bound | 0.02 | - | 0.37 | - | |||
Correlation values reported in table (r or rho).
Pos = positive symptom dimension; Dis = disorganization symptom dimension Group diff = Difference between groups (where there were multiple patient groups this represented patients pooled together or the result of each individual patient group compared to controls); ↑= greater activation in patients compared to controls; ↓ = less activation in patients compared to controls; n.s. = non-significant contrast; L = left; R = right
Note: The direction of the effect size represents whether or not the effect is in a consistent direction with the abnormality compared to controls. A positive effect size represents that abnormal brain activity in patients compared to controls is associated with greater symptom severity (e.g., hypo- and hyperactivity compared to controls is associated with greater symptoms or greater symptoms in the patient group with the symptoms of interest), whereas a negative effect size represents the opposite (e.g., abnormal activity compared to controls is associated with fewer symptoms or the patient group with fewer symptoms of interest).
The positive symptom dimension included the conceptual disorganization, mannerisms and posturing, hostility, grandiosity, suspiciousness, hallucinatory behavior, unusual thought content, and excitement BPRS items.
The disorganization dimension included the formal thought disorder score from the Signs and Symptoms of Psychotic Illness Scale.
The psychotic group had mild or more severe unusual thought content or hallucinations on the BPRS items. Used best estimation to convert statistics comparing groups with differing symptom presentation/severity to r values reported in table.
The hallucinating group had a mild or more severe auditory hallucination score on the SAPS. The non-hallucinating group was not experiencing auditory verbal hallucinations currently nor had a history of auditory hallucinations. Used best estimation to convert statistics comparing groups with differing symptom presentation/severity to r values reported in table.
The group difference was derived from controls compared patients trait positive and negative for auditory hallucinations. In addition, patients were scanned over two different time periods. First the group was scanned during a period of severe ongoing auditory hallucinations as measured by the SAPS (state positive) and after those hallucinations (state negative) had diminished. Used best estimation to convert statistics comparing groups with differing symptom presentation/severity to r values reported in table.
Summary
Despite four relevant studies, associations were not convincing for the middle or superior temporal region and positive symptoms measured in this way. There was little consistency in the direction of the abnormality compared to normative functioning for the middle temporal gyrus with symptoms.
Discussion
This review focused on 25 fMRI studies investigating the relationship between brain activity and symptom expression in schizophrenia patients compared to a healthy control group, often with an additional psychiatric comparison group. Our aim was to empirically assess whether the symptom dimensions of schizophrenia were associated with particular forms of brain dysfunction as measured by fMRI. One of the reasons that pathognomic fMRI patterns may not exist for schizophrenia as a diagnosis is that the diverse set of neural abnormalities underlying symptom heterogeneity amongst patients is obscured when data are averaged and compared with a control group. Separable dimensions of schizophrenia symptomatology have been reliably identified through factor analyses and persist over the course of the disorder (Andreasen, Arndt, Alliger, Miller, & Flaum, 1995; Andreasen et al., 1994; Arndt, Andreasen, Flaum, Miller, & Nopoulos, 1995; Liddle, 1987b), thereby suggesting that they may derive from persistent abnormalities in distinct neural substrates. The qualitative and quantitative reviews found reliable small to moderate associations between specific symptoms domains and regional brain activity. Knowledge of how these individual nodes function provides useful information of the working of higher-level systems. Below, we integrate the findings of this review with findings from the broader literature. We offer suggestions for reconciling findings from different methodologies, as well as, future directions.
Dorsolateral Prefrontal Cortex
In this review abnormal dorsolateral prefrontal activity during executive functioning was associated with greater disorganization symptoms (r=0.43; CI95%=0.25–0.61). This association provides support for the hypothesis that dysfunctional dorsolateral prefrontal and executive functioning may be related to disorganization symptoms by a reduced ability to suppress inappropriate behaviors for goal-directed behaviors. Impairments in these processes may underlie inappropriate affect, formal thought disorder, and bizarre behavior (Liddle, 1987a; Liddle et al., 1992). Convergent evidence was provided by Kircher and colleagues (2002), who found that the right middle frontal gyrus (BA 9) was related to formal thought disorder when patients spoke about Rorschach inkblots. In addition, lower dorsolateral prefrontal functional connectivity with other context processing task-related regions was associated with greater disorganization symptoms, but not with negative or positive symptoms (Yoon et al., 2008). Furthermore, additional support was also provided by the structural MRI literature where greater bilateral dorsolateral prefrontal cerebrospinal fluid volume (Molina et al., 2003) and lower left dorsolateral prefrontal volume were associated with more severe disorganization symptoms (Lopez-Garcia, Aizenstein, Snitz, Walter, & Carter, 2006).
Surprisingly, this review did not find an association between dorsolateral prefrontal activity during executive functioning and negative symptoms, which have been reported using a number of different methodologies. A positron emission tomography (PET) study found that patients with predominantly negative symptoms compared to patients with predominantly positive symptoms and controls had lower glucose metabolic rate in broad areas of the prefrontal cortex, including but not specific to the dorsolateral prefrontal cortex (BA 9/46) during a continuous performance task (Potkin et al., 2002). Similarly, drug-naive deficit patients had lower activation in their bilateral dorsolateral prefrontal cortex (BA 9, 46) during an auditory discrimination task compared to nondeficit patients (Lahti et al., 2001). Convincing evidence is provided by Honey and colleagues (2008), who paired ketamine administration with fMRI in a nonpsychiatric sample and found an association between right dorsolateral prefrontal activity and negative symptoms during a continuous performance task. During rest, deficit patients have also been found to have lower blood flow than nondeficit schizophrenia patients in their bilateral dorsolateral prefrontal cortex (Vaiva et al., 2002) and negative symptoms have been associated with less left dorsolateral prefrontal (BA 46/10) blood flow (Liddle et al., 1992). However, not all studies have found an association between dorsolateral prefrontal activity and negative symptoms even during an executive functioning task (Honey et al., 2003). Structurally, there also was an association between greater dorsolateral prefrontal cerebrospinal fluid and a trend for decreased grey matter volume and greater negative symptoms (Molina et al., 2003).
The specific reasons for the attenuated association between dorsolateral prefrontal functioning and negative symptoms in this review are difficult to isolate. One possible explanation could be that two of studies in this review that found an association between dorsolateral prefrontal functioning and symptoms investigated drug-naive subjects, rather than chronic medicated patients. Deficits found later in the illness may have a greater relationship to negative symptoms, which are more treatment resistant. Another possible reason could be that two of the studies in this review that found associations for disorganization rather than negative symptoms found a specific deficit in executive functioning, whereas other studies which have found associations with negative symptoms may be using tasks that measure a more generalized deficit, produced by negative symptoms such as anhedonia or apathy. Lastly, many of the studies in the literature that found associations between dorsolateral prefrontal activity and negative symptoms compared groups with deficit versus nondeficit symptoms or negative versus positive symptoms without controlling for disorganization symptoms. It could very well be patients with greater deficit or negative symptoms also have greater disorganization symptoms.
Ventrolateral Prefrontal Cortex
In this review two studies found abnormal ventrolateral prefrontal cortical activity was associated with greater negative symptoms during executive functioning (r=0.38, CI95%=0.04–0.73). This finding provides support for the theory that the prefrontal cortex and executive functioning are thought to be related to negative symptoms due to their role in creating self-directed behavior. Deficits in these processes may underlie alogia, anhedonia, and flat affect. Convergent evidence is provided in patients demonstrating primarily negative symptoms. Deficit patients showed less task-related activity in their ventrolateral prefrontal cortex (BA 45, 47; Potkin et al., 2002). Furthermore, when ketamine administration was paired with fMRI in a nonpsychiatric sample, an association was found between bilateral inferior frontal activity and negative symptoms during a continuous performance task (Honey et al., 2008). Complimentary evidence is provided by a structural MRI study that demonstrated greater right inferior frontal grey matter volume was associated with fewer total negative symptoms, specifically stereotyped thinking (Yamasue et al., 2004).
Although, this review did not find an association between ventrolateral prefrontal cortex and disorganization symptoms other studies have. Kircher and colleagues (2002) found that that right inferior frontal activity was related to positive formal thought disorder when patients spoke about Rorschach inkblots. Similarly, Han and colleagues (2007) investigated semantic word-priming and found lower left inferior frontal activation was also associated with greater distractive speech. Greater disorganization symptoms have also found be associated with less regional cerebral blood flow at rest in the right ventral prefrontal cortex (BA 45; Liddle et al., 1992). A possible reason for the difference between this review and other studies in the literature could be that few studies met the threshold for inclusion and this review focused solely on executive functioning tasks.
Lastly, studies have individually assessed the symptoms of difficulty in abstract thinking (i.e., concretism) from the PANSS and attentional impairment from the SANS which have not loaded consistently or cleanly onto the negative or the disorganization factor. These items been found to be associated with reduced activation in the left inferior fontal gyrus (BA 44, Ganesan, Green, Hunter, Wilkinson, & Spence, 2005; BA 45, Kircher, Leube, Erb, Grodd, & Rapp, 2007). These items may not load consistently or cleanly onto negative or disorganization factors because both domains may share underlying neural correlates in the prefrontal cortex.
Medial Prefrontal Cortex
In this review abnormal medial prefrontal activity during emotional stimuli processing was associated with greater positive symptoms, particularly paranoia (r=0.36, CI95%=0.16–0.55). This finding supports the theory that distortions in reality (e.g., delusions) may be due to social judgments going awry or finding personal relevance inappropriately in social situations, which have been associated with medial prefrontal cortex (Amodio & Frith, 2006; Taylor, Welsh, Chen, Velander, & Liberzon, 2007). Consistent with this observation, Winterer and colleagues (2006) reported that increased left medial prefrontal residual fMRI noise during a visual reaction task had large significant associations with greater delusional ideation and hallucinations (as well as difficulty abstracting and anxiety). An increase in deactivation of the medial prefrontal cortex was also related to increased positive symptoms (Garrity et al., 2007). Lastly, paranoid patients demonstrated abnormal fMRI connectivity between the medial prefrontal cortex and the dorsolateral prefrontal cortex compared to controls (Zhou et al., 2007).
Amygdala
In this review abnormal amygdala activity during emotional stimuli processing was associated with greater positive symptoms, especially paranoia (r=0.26, CI95%=0.11–0.42). This finding provides support for the theory that impairments in the amygdala could lead to abnormal emotion recognition and misinterpretation of neutral or ambiguous situations as threatening, hence leading to persecutory delusions (Phillips, Drevets, Rauch, & Lane, 2003b). Consistent with the review, positive symptoms have also been related to left amygdala activity across aversive and non-aversive conditions during PET (Taylor, Liberzon, Decker, & Koeppe, 2002). Also positive schizotypy symptoms measured in a normative sample were associated with greater amygdala activation during an emotional Stroop (Mohanty et al., 2005). The structural MRI literature does not provide consistent support for this association, despite more consistent functional neuroimaging findings. The majority of studies that have measured the amygdala structurally have not revealed a significant association with positive symptoms, (Joyal et al., 2003; Niu et al., 2004; Wang et al., 2008), though one study found an association between lower left amygdala volume and greater illness duration (Niu et al., 2004).
In this review abnormal amygdala functioning during emotional stimuli processing was associated with greater flat affect (r=0.28, CI95%=0.02–0.54), largely driven by one study (hence a significant heterogeneity statistic). This provides preliminary support for the theory that amygdala abnormalities can be associated with emotional blunting (Phillips, Drevets, Rauch, & Lane, 2003a), though replication is necessary. In support of this finding, Fahim and colleagues (2005) demonstrated that patients without blunted affect activated the amygdala and patients with blunted affect activated the amygdala only after treatment with quetiapine. In addition, one structural MRI study found reduced amygdala/hippocampus volume in patients with primary negative symptoms compared to controls (Anderson et al., 2002), with the majority of studies finding no association (Joyal et al., 2003; Niu et al., 2004; Wang et al., 2008). Further evidence is required before strong statements can be made for the association between the amygdala and negative symptoms.
Hippocampus and Parahippocampal Gyrus
In this review abnormal hippocampus and parahippocampal gyrus activity during emotional stimuli processing (r=0.24, CI95%=0.01–0.48) was associated with greater positive symptoms, specifically paranoia. This finding provides support the for the role of the hippocampus in regulating affective states involved in generating behaviors in threatening or potentially threatening contexts (Phillips, Drevets, Rauch, & Lane, 2003a) and for the role of parahippocampal gyrus in context appraisal (Sacchetti, Lorenzini, Baldi, Tassoni, & Bucherelli, 1999) being related to the persecutory symptoms of schizophrenia. In support of these findings, greater blood flow in the left parahippocampal gyrus was associated with greater positive symptoms (Liddle et al., 1992). Furthermore, positive schizotypy symptoms in a healthy population were associated with greater right hippocampal and parahippocampal activation during an emotional Stroop (Mohanty et al., 2005). Convergent evidence is provided by structural MRI, more severe Schneiderian symptoms were associated with a smaller left anterior parahippocampal gyrus (Suzuki et al., 2005). However, studies of the hippocampus have tended to not find any structural abnormalities associated with a particular symptom profile (Szeszko et al., 2003; Wang et al., 2008).
Ventral Striatum
In this review ventral striatum functioning during reward and conditioning was associated with negative symptoms (r=0.45, CI95%=0.16–0.74). This finding provides support for the theory that the ventral striatum may have a role in creating negative symptoms such as flattened affect or anhedonia, as dysfunction of this system is thought to be associated with reduced motivation (Breiter, Aharon, Kahneman, Dale, & Shizgal, 2001; Phillips, Drevets, Rauch, & Lane, 2003b). In support of this finding, Crespo-Faracorro and colleagues (2001) found amongst other regions that the right nucleus accumbens had a decreased response to unpleasant odors, suggesting dysfunction of this region in appraising emotional significance, which may underlie anhedonia. In this review, one study of ventral striatum functioning in drug-naive patients suggested an association with positive symptoms, which was not found in studies of medicated patients. In a normative sample, positive schizotypy symptoms were associated with decreased nucleus accumbens activation during an emotional Stroop (Mohanty et al., 2005). In addition, Murray and colleagues (2007) found patients with predominantly positive symptoms had an attenuated response to neutral and reward prediction error in the right ventral striatum compared to controls. Although, these findings provides support for the theory that misfiring of dopamine neurons in the ventral striatum may lead to reinforcement of false associations related to the development of delusions (Kapur, 2003), these findings need be replicated and the role of medication further clarified.
Middle & Superior Temporal Lobe
One of the most notable findings of this review was the lack of a consistent association between middle and superior temporal lobe activity during speech processing and positive symptoms. Other studies using other techniques and tasks have found significant associations. Kubicki and colleagues (2003) found an association for greater left superior temporal activation during shallow word encoding with positive symptoms. Hallucinations were found to be associated with abnormal activity in left middle temporal gyrus during word priming (Han et al., 2007) and the superior temporal gyrus during sentence completion (Plaze et al., 2006). A number of elegant studies in single or small groups of patients scanned during on-off hallucinatory periods have also reported that the regions of middle and superior temporal cortex were active during actual hallucinations (Dierks et al., 1999; Lennox, Park, Medley, Morris, & Jones, 2000; Shergill et al., 2004; Shergill, Brammer, Williams, Murray, & McGuire, 2000; Shergill et al., 2001). Honey and colleagues (2008) paired ketamine administration and fMRI in a healthy population and found an association between left middle temporal activity and auditory illusions during a verbal self-monitoring task. Importantly, a meta-analysis of 15 transcranial magnetic stimulation (TMS) studies demonstrated that stimulation of left temporoparietal cortex resulted in a reduction of auditory hallucinations (Aleman, Sommer, & Kahn, 2007). In addition, greater positive symptoms were also associated with greater deactivation of the left middle temporal gyrus (Garrity et al., 2007). Structurally, reduced planum temporale volume has been associated with delusions (Yamasaki et al., 2007).
The one study that met inclusion criteria did not find an association between middle and superior temporal activity and disorganization symptoms during speech processing (but did find associations with temporal-parietal regions). However, many other studies have found this association. Abnormal activation in the left posterior middle temporal region (Han et al., 2007) and left posterior superior temporal sulcus/middle temporal gyrus have been associated with thought disorder (Weinstein, Werker, Vouloumanos, Woodward, & Ngan, 2006). Kircher and colleagues (2001) found less positive formal thought disorder was associated with increased activation in left superior and middle temporal gyrus. Furthermore, Honey and colleagues (2008) paired ketamine administration with fMRI during a semantic generation task and found an association between left middle and superior temporal activity and formal thought disorder in a healthy population. Structurally, greater bizarre-idiosyncratic thinking has been found to be associated with reduced bilateral superior temporal gyrus volume (Subotnik, Bartzokis, Green, & Nuechterlein, 2003). Despite, the findings of this review, there is evidence that misattribution of speech and problems processing semantic meaning may lead to disordered thinking and/or auditory hallucinations (Kuperberg & Heckers, 2000). Future research needs to clarify the constraints under which these associations are found.
A potential reason for the difference between the findings of this review and other studies could be that this review focusing on speech tasks. For example, fMRI activity actually occurring during on-line auditory hallucinations is associated with the middle and superior temporal gyrus. Also the lack of relationship between middle/superior temporal region and formal thought disorder may be due to power or specific task chosen. Formal thought disorder has been found to be particularly related to tasks of online semantic processing (Kuperberg & Heckers, 2000). A possible explanation for the lack of findings between the temporal lobe and positive symptoms could be that most of the studies differentiated between groups of patients with certain positive symptoms. However, the groups may have also differed in the presentation of symptoms in the disorganization and negative domains, which may have resulted in unexpected findings. The temporal lobe has been hypothesized (Crow, 1985) and found to be associated negative symptoms both functionally (Potkin et al., 2002) and structurally (Turetsky et al., 1995), in addition to the positive and disorganization domains. Therefore studies (similar to those reviewed in the discussion) that investigated correlations between brain activity and symptoms may be more likely to find coherent associations. Lastly, the temporal lobe has been associated with illness severity in general (Honey et al., 2003).
Limitations
This review focused on the literature associating symptoms to brain activity where a healthy control group and a cognitive task were included; therefore this review may have missed associations between symptoms and brain regions that may have been present using other analytic and imaging techniques. Also this review was limited to certain regions and tasks where a significant literature had accumulated. Therefore this review may have missed relationships in additional brain regions and tasks than reviewed. A further limitation is that we combined across specific tasks into relevant construct domains. One reason to group tasks by domain was to demonstrate the generalizability of symptom-function relationships over and above specific task demands. In this review, we also chose to combine findings across the cerebral hemispheres as differential activation may reflect the specific cognitive processes recruited by different task variants, rather than interpretable differences (Gur & Chin, 1999). Furthermore, many brain regions demonstrate bilateral functional and structural abnormalities in schizophrenia when samples are sufficiently large (e.g., Glahn et al., 2005; Wright et al., 2000). This reduced our ability to reveal more subtle, hemisphere-specific symptom-function relationships. However, the small number of these reports across studies largely precludes such an examination at this point in time. Our review was conservative as we coded our effects of the psychopathology of interest as to whether or not it was expected given the pattern of activation compared to the control group. For a few of the studies where groups with differing psychopathology were contrasted and direct comparison to controls for that specific activated regions were not present, we instead used activations from that area in general. In addition, this review may have lead to conservative effect size estimates, as we converted F and t group comparison statistics without being able to account for multiple comparison corrections, which were implemented by each study.
Fundamentally, the reviewed studies involved tasks that offered no experimental manipulation of symptoms, and instead focused on experimental changes in cognitive and affective states. Therefore an argument could be made that the review summarized associations that are epiphenomena of the experimental manipulation (e.g., an individual with negative symptoms fails to activate a brain region not because the brain region causes negative symptoms, but because of impaired motivation or that the brain region causes deficient cognitive function but not negative symptoms per se). These fMRI studies provide useful associations between symptoms and brain activity. However, the causal influences of neural responses on symptoms can only be established using other techniques which enable experimental manipulation of those symptoms.
Future Recommendations
The direct experimental manipulation of brain regions is perhaps the strongest means by which to determine which brain regions (or brain circuits) cause symptoms. However, participant safety and ethical concerns make direct manipulation of brain states controversial. One of the first instances of intentional manipulations to neural systems to generate symptomatology was the application of the stimulant ketamine in nonpsychiatric subjects (Krystal et al., 1994) and individuals with schizophrenia (Lahti, Koffel, LaPorte, & Tamminga, 1995). Investigations have revealed that ketamine increases availability of dopamine in the striatum (Smith et al., 1998) and alters activity in the cingulate (Deakin et al., 2008; Fu et al., 2005; Lahti, Holcomb, Medoff, & Tamminga, 1995; Northoff et al., 2005), prefrontal cortex (Deakin et al., 2008; Fu et al., 2005), striatum (Fu et al., 2005), hippocampus, lingual gyrus, and fusiform gyrus (Lahti, Holcomb, Medoff, & Tamminga, 1995). Although ketamine provides a means by which to experimentally affect brain function, the manipulation is not confined to a single brain region. Therefore it is difficult to differentiate brain regions that cause symptoms from other regions altered by ketamine administration. The application of electromagnetic currents to neural populations through transmagnetic stimulation (TMS) provides a tool for directly manipulating neural activity in isolated cortical regions. Another advantage of TMS is that the investigator has precise temporal control of experimental changes in neural activity and thus can examine which neural changes precede the appearance or reduction of symptoms, and therefore likely cause symptoms rather than be a consequence of the experience of having symptoms. Refined differentiation of causal influences across interconnected brain regions will require the pairing of TMS with monitoring brain activity at high temporal resolution (e.g., electroencephalography, EEG). Such a pairing of manipulation and measurement would allow the investigator to document changes in neural function and symptoms in response to TMS.
Another necessary next step in identifying brain-symptom associations is to investigate within subject changes in symptoms in association with changes in brain activity. Such changes in brain and symptom states might be studied over the natural course of schizophrenia. Yet a naturalistic study would likely take long periods of time and would pose difficulties for investigators with respect to retention of subjects and consistency of assessments across time. Intervention studies include a shorter time-frame than documenting naturalistic changes. Neuroimaging during randomized control trials could allow determination of whether changes in brain activity and symptoms can be attributed to an intervention (e.g., medication, cognitive therapy or remediation). Unfortunately, this method cannot identify causal relationships between neural effects and symptoms because much is unknown about the exact consequences of interventions on brain function. Intervention studies, however, can provide complimentary evidence regarding associations of neural activity and symptoms.
In addition to carrying out experimental manipulations, characterizations of brain structure and other forms of neural function (PET, EEG, magnetoencephalography) should be considered to provide adjunctive validation of fMRI findings. Neural data with better temporal resolution than the BOLD response may help differentiate neural causes from the neural consequences of transient symptoms. Finally, symptoms may be an expression of abnormal brain connectivity in schizophrenia, implying that the identification of brain regions contributing to symptoms is a step toward characterizing dynamic interactions of the brain in schizophrenia.
There are also several conventional methodological recommendations to further our knowledge of the neural contributors to symptoms. A number of suggestions for the design, analysis, and presentation of fMRI studies in general and for clinical neuroimaging studies in particular have been previously provided to enhance interpretability and reproducibility (Carter, Heckers, Nichols, Pine, & Strother, 2008; Poldrack et al., 2008).
There are a number of methodological challenges and choices particular to addressing symptom-brain activation studies as well. Studies that employ control groups to isolate regions of abnormal activation decrease the likelihood of spurious associations with symptoms. Nonetheless, it is essential that the control group be closely matched to the individuals with schizophrenia - otherwise differential activations may reflect aspects of the disorder other than symptoms. If the experimental manipulation of symptoms proves to be unavailable due to ethical concerns, then selection of tasks that closely relate to symptoms will be important to probing brain regions suspected as contributing. Use of cognitive and affective probes to explore brain regions involved with the generation of symptomatology may fail to reveal relationships due to poor task selection, thereby merely adding noise to the pattern of associations between brain activity and symptoms across studies. This highlights the importance of additionally investigating the relationship between behavioral task performance and symptoms. When selecting tasks, investigators may consider using tasks that are sensitive to individual differences and to a specific deficit. Also, to supplement specific symptom-brain associations, investigators may also consider investigating the effects age, chronicity, general symptom severity, and medications on brain activity. As subgroups chosen to be high or low on certain symptomatology are commonly used, studies may benefit from matching the groups for factors and symptoms of non-interest to increase confidence in the specificity of the findings. Lastly, demonstrating that a significant association between one symptom dimension and brain region is greater than associations between other symptoms and that same brain region may be informative in determining a preferential role for specific associations.
Although advances in neuroimaging are required to advance the field, attention to the measurement of symptoms is equally important. The dimensional structure used is fundamental to providing accurate associations between symptoms and brain activity. Investigators may wish to consider using the positive, negative, and disorganization dimensional structure or a structure that also takes into account the potentially more transient mood symptoms (this may be particularly relevant when using affective tasks). Evaluating primary negative symptoms dimensionally may also be particularly relevant in clarifying the neural substrates of negative symptoms. In addition, the time frame for which symptoms are quantified is fundamental to understanding how brain function results in symptomatology. The week-to-month time frame measured by most studies captures the current propensity of the brain to generate different forms of symptoms. If alternatively the intent of the study is to investigate the overall propensity toward various forms of schizophrenia symptomatology, then lifetime prevalence of the symptoms might be most relevant to capturing this underlying vulnerability of brain systems.
Conclusions
As expressed by Kraepelin (1907) necessary to understanding the symptoms of schizophrenia is understanding the brain-behavior relationships. The findings summarized in this review point to brain regions that could become the first focus for hypothesizing about the role of neural networks and testing the causal contributions to symptomatology (e.g., by using ketamine administration or TMS). A better understanding of these associations has important implications for the treatment of schizophrenia. Although subcortical regions may be challenging to stimulate through TMS, subsections of the prefrontal cortex appear to be promising targets to relieve symptoms. Because negative symptoms are particularly challenging to treat in individuals with schizophrenia successful manipulation of brain activity leading to symptomatic relief may have significant impact on human welfare. Multi-disciplinary research in this area is at the cutting-edge of understanding the basis of symptomatology and fundamentally impacting the treatment and prevention of schizophrenia.
Figure 1.
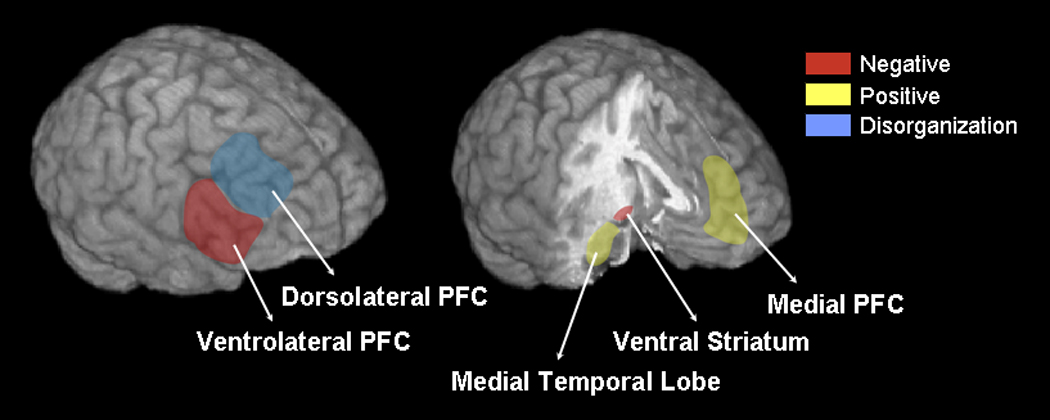
Relationship between symptom dimensions and fMRI task-related brain activity. PFC = prefrontal cortex; Medial temporal lobe = amygdala, hippocampus, and parahippocampus gyrus. Approximate brain regions for visualization purposes.
Acknowledgements
Dr. Goghari was supported by a PGS Doctoral Award from the Natural Sciences and Engineering Research Council of Canada and the Graduate Research Partnership Program and the Vertically Integrated Research Team Experience from the University of Minnesota. Dr. Sponheim was supported by a Clinical Science Merit Review grant from the Department of Veterans Affairs and NIMH grant R24 MH 069675. Dr. MacDonald was supported by the National Alliance for Research in Schizophrenia and Affective Disorders, the University of Minnesota’s McKnight-Land Grant Fellowship, and NIMH grants MH 18269 and MH 79262. We are grateful to Drs. William Iacono and Wilma Koutstaal for their feedback on a previous draft. We thank Stephen Duquette for his help with literature searches.
Footnotes
This is a PDF file of an unedited manuscript that has been accepted for publication. As a service to our customers we are providing this early version of the manuscript. The manuscript will undergo copyediting, typesetting, and review of the resulting proof before it is published in its final citable form. Please note that during the production process errors may be discovered which could affect the content, and all legal disclaimers that apply to the journal pertain.
References
- Adolphs R. The neurobiology of social cognition. Curr Opin Neurobiol. 2001;11:231–239. doi: 10.1016/s0959-4388(00)00202-6. [DOI] [PubMed] [Google Scholar]
- Aleman A, Sommer IE, Kahn RS. Efficacy of slow repetitive transcranial magnetic stimulation in the treatment of resistant auditory hallucinations in schizophrenia: a meta-analysis. J Clin Psychiatry. 2007;68:416–421. doi: 10.4088/jcp.v68n0310. [DOI] [PubMed] [Google Scholar]
- Allen P, Aleman A, McGuire PK. Inner speech models of auditory verbal hallucinations: evidence from behavioural and neuroimaging studies. Int Rev Psychiatry. 2007;19:407–415. doi: 10.1080/09540260701486498. [DOI] [PubMed] [Google Scholar]
- Amodio DM, Frith CD. Meeting of minds: the medial frontal cortex and social cognition. Nat Rev Neurosci. 2006;7:268–277. doi: 10.1038/nrn1884. [DOI] [PubMed] [Google Scholar]
- Anderson JE, Wible CG, McCarley RW, Jakab M, Kasai K, Shenton ME. An MRI study of temporal lobe abnormalities and negative symptoms in chronic schizophrenia. Schizophr Res. 2002;58:123–134. doi: 10.1016/s0920-9964(01)00372-3. [DOI] [PMC free article] [PubMed] [Google Scholar]
- Andreasen NC. Scale for the Assessment of Negative Symptoms (SANS) Iowa: University of Iowa; 1981. [PubMed] [Google Scholar]
- Andreasen NC. Scale for the Assessment of Positive Symptoms (SAPS) Iowa: University of Iowa; 1983. [Google Scholar]
- Andreasen NC, Arndt S, Alliger R, Miller D, Flaum M. Symptoms of schizophrenia. Methods, meanings, and mechanisms. Arch Gen Psychiatry. 1995;52:341–351. doi: 10.1001/archpsyc.1995.03950170015003. [DOI] [PubMed] [Google Scholar]
- Andreasen NC, Nopoulos P, Schultz S, Miller D, Gupta S, Swayze V, et al. Positive and negative symptoms of schizophrenia: past, present, and future. Acta Psychiatr Scand Suppl. 1994;384:51–59. doi: 10.1111/j.1600-0447.1994.tb05891.x. [DOI] [PubMed] [Google Scholar]
- Arce E, Leland DS, Miller DA, Simmons AN, Winternheimer KC, Paulus MP. Individuals with schizophrenia present hypo- and hyperactivation during implicit cueing in an inhibitory task. Neuroimage. 2006;32:704–713. doi: 10.1016/j.neuroimage.2006.04.189. [DOI] [PubMed] [Google Scholar]
- Arndt S, Andreasen NC, Flaum M, Miller D, Nopoulos P. A longitudinal study of symptom dimensions in schizophrenia. Prediction and patterns of change. Arch Gen Psychiatry. 1995;52:352–360. doi: 10.1001/archpsyc.1995.03950170026004. [DOI] [PubMed] [Google Scholar]
- Breiter HC, Aharon I, Kahneman D, Dale A, Shizgal P. Functional imaging of neural responses to expectancy and experience of monetary gains and losses. Neuron. 2001;30:619–639. doi: 10.1016/s0896-6273(01)00303-8. [DOI] [PubMed] [Google Scholar]
- Buchanan RW, Carpenter WT. Domains of psychopathology: an approach to the reduction of heterogeneity in schizophrenia. J Nerv Ment Dis. 1994;182:193–204. [PubMed] [Google Scholar]
- Buxton RB, Wong EC, Frank LR. Dynamices of blood flow and oxygenation changes during brain activation: the balloon model. Magnetic Resonance Medicine. 1998;39:855–864. doi: 10.1002/mrm.1910390602. [DOI] [PubMed] [Google Scholar]
- Carpenter WT, Jr, Heinrichs DW, Wagman AM. Deficit and nondeficit forms of schizophrenia: the concept. Am J Psychiatry. 1988;145:578–583. doi: 10.1176/ajp.145.5.578. [DOI] [PubMed] [Google Scholar]
- Carter CS, Heckers S, Nichols T, Pine DS, Strother S. Optimizing the design and analysis of clinical functional magnetic resonance imaging research studies. Biol Psychiatry. 2008;64:842–849. doi: 10.1016/j.biopsych.2008.06.014. [DOI] [PubMed] [Google Scholar]
- Cohen JD, Barch DM, Carter C, Servan-Schreiber D. Context-processing deficits in schizophrenia: converging evidence from three theoretically motivated cognitive tasks. J Abnorm Psychol. 1999;108:120–133. doi: 10.1037//0021-843x.108.1.120. [DOI] [PubMed] [Google Scholar]
- Crespo-Facorro B, Paradiso S, Andreasen NC, O'Leary DS, Watkins GL, Ponto LL, et al. Neural mechanisms of anhedonia in schizophrenia: a PET study of response to unpleasant and pleasant odors. JAMA. 2001;286:427–435. doi: 10.1001/jama.286.4.427. [DOI] [PubMed] [Google Scholar]
- Crow TJ. The two-syndrome concept: origins and current status. Schizophr Bull. 1985;11:471–486. doi: 10.1093/schbul/11.3.471. [DOI] [PubMed] [Google Scholar]
- Deakin JF, Lees J, McKie S, Hallak JE, Williams SR, Dursun SM. Glutamate and the neural basis of the subjective effects of ketamine: a pharmaco-magnetic resonance imaging study. Arch Gen Psychiatry. 2008;65:154–164. doi: 10.1001/archgenpsychiatry.2007.37. [DOI] [PubMed] [Google Scholar]
- Dierks T, Linden DE, Jandl M, Formisano E, Goebel R, Lanfermann H, et al. Activation of Heschl's gyrus during auditory hallucinations. Neuron. 1999;22:615–621. doi: 10.1016/s0896-6273(00)80715-1. [DOI] [PubMed] [Google Scholar]
- Duncan J, Owen AM. Common regions of the human frontal lobe recruited by diverse cognitive demands. Trends Neurosci. 2000;23:475–483. doi: 10.1016/s0166-2236(00)01633-7. [DOI] [PubMed] [Google Scholar]
- Fahim C, Stip E, Mancini-Marie A, Gendron A, Mensour B, Beauregard M. Differential hemodynamic brain activity in schizophrenia patients with blunted affect during quetiapine treatment. J Clin Psychopharmacol. 2005;25:367–371. doi: 10.1097/01.jcp.0000168880.10793.ed. [DOI] [PubMed] [Google Scholar]
- Fu CH, Abel KM, Allin MP, Gasston D, Costafreda SG, Suckling J, et al. Effects of ketamine on prefrontal and striatal regions in an overt verbal fluency task: a functional magnetic resonance imaging study. Psychopharmacology (Berl) 2005;183:92–102. doi: 10.1007/s00213-005-0154-9. [DOI] [PubMed] [Google Scholar]
- Ganesan V, Green RD, Hunter MD, Wilkinson ID, Spence SA. Expanding the response space in chronic schizophrenia: the relevance of left prefrontal cortex. Neuroimage. 2005;25:952–957. doi: 10.1016/j.neuroimage.2004.12.024. [DOI] [PubMed] [Google Scholar]
- Garrity AG, Pearlson GD, McKiernan K, Lloyd D, Kiehl KA, Calhoun VD. Aberrant "default mode" functional connectivity in schizophrenia. Am J Psychiatry. 2007;164:450–457. doi: 10.1176/ajp.2007.164.3.450. [DOI] [PubMed] [Google Scholar]
- Glahn DC, Ragland JD, Abramoff A, Barrett J, Laird AR, Bearden CE, et al. Beyond hypofrontality: a quantitative meta-analysis of functional neuroimaging studies of working memory in schizophrenia. Hum Brain Mapp. 2005;25:60–69. doi: 10.1002/hbm.20138. [DOI] [PMC free article] [PubMed] [Google Scholar]
- Grube BS, Bilder RM, Goldman RS. Meta-analysis of symptom factors in schizophrenia. Schizophr Res. 1998;31:113–120. doi: 10.1016/s0920-9964(98)00011-5. [DOI] [PubMed] [Google Scholar]
- Gur RE, Chin S. Laterality in functional brain imaging studies of schizophrenia. Schizophr Bull. 1999;25:141–156. doi: 10.1093/oxfordjournals.schbul.a033361. [DOI] [PubMed] [Google Scholar]
- Gur RE, Loughead J, Kohler CG, Elliott MA, Lesko K, Ruparel K, et al. Limbic activation associated with misidentification of fearful faces and flat affect in schizophrenia. Arch Gen Psychiatry. 2007;64:1356–1366. doi: 10.1001/archpsyc.64.12.1356. [DOI] [PubMed] [Google Scholar]
- Gur RE, McGrath C, Chan RM, Schroeder L, Turner T, Turetsky BI, et al. An fMRI study of facial emotion processing in patients with schizophrenia. Am J Psychiatry. 2002;159:1992–1999. doi: 10.1176/appi.ajp.159.12.1992. [DOI] [PubMed] [Google Scholar]
- Han SD, Nestor PG, Hale-Spencer M, Cohen A, Niznikiewicz M, McCarley RW, et al. Functional neuroimaging of word priming in males with chronic schizophrenia. Neuroimage. 2007;35:273–282. doi: 10.1016/j.neuroimage.2006.11.029. [DOI] [PMC free article] [PubMed] [Google Scholar]
- Hartley AA, Speer NK. Locating and fractionating working memory using functional neuroimaging: storage, maintenance, and executive functions. Microsc Res Tech. 2000;51:45–53. doi: 10.1002/1097-0029(20001001)51:1<45::AID-JEMT5>3.0.CO;2-O. [DOI] [PubMed] [Google Scholar]
- Heinrichs RW, Zakzanis KK. Neurocognitive deficit in schizophrenia: a quantitative review of the evidence. Neuropsychology. 1998;12:426–445. doi: 10.1037//0894-4105.12.3.426. [DOI] [PubMed] [Google Scholar]
- Hempel A, Hempel E, Schonknecht P, Stippich C, Schroder J. Impairment in basal limbic function in schizophrenia during affect recognition. Psychiatry Res. 2003;122:115–124. doi: 10.1016/s0925-4927(02)00126-9. [DOI] [PubMed] [Google Scholar]
- Honey GD, Corlett PR, Absalom AR, Lee M, Pomarol-Clotet E, Murray GK, et al. Individual differences in psychotic effects of ketamine are predicted by brain function measured under placebo. J Neurosci. 2008;28:6295–6303. doi: 10.1523/JNEUROSCI.0910-08.2008. [DOI] [PMC free article] [PubMed] [Google Scholar]
- Honey GD, Sharma T, Suckling J, Giampietro V, Soni W, Williams SC, et al. The functional neuroanatomy of schizophrenic subsyndromes. Psychol Med. 2003;33:1007–1018. doi: 10.1017/s0033291703007864. [DOI] [PubMed] [Google Scholar]
- Jensen J, Willeit M, Zipursky RB, Savina I, Smith AJ, Menon M, et al. The formation of abnormal associations in schizophrenia: neural and behavioral evidence. Neuropsychopharmacology. 2008;33:473–479. doi: 10.1038/sj.npp.1301437. [DOI] [PubMed] [Google Scholar]
- Joyal CC, Laakso MP, Tiihonen J, Syvalahti E, Vilkman H, Laakso A, et al. The amygdala and schizophrenia: a volumetric magnetic resonance imaging study in first-episode, neuroleptic-naive patients. Biol Psychiatry. 2003;54:1302–1304. doi: 10.1016/s0006-3223(03)00597-3. [DOI] [PubMed] [Google Scholar]
- Juckel G, Schlagenhauf F, Koslowski M, Filonov D, Wustenberg T, Villringer A, et al. Dysfunction of ventral striatal reward prediction in schizophrenic patients treated with typical, not atypical, neuroleptics. Psychopharmacology (Berl) 2006;187:222–228. doi: 10.1007/s00213-006-0405-4. [DOI] [PubMed] [Google Scholar]
- Juckel G, Schlagenhauf F, Koslowski M, Wustenberg T, Villringer A, Knutson B, et al. Dysfunction of ventral striatal reward prediction in schizophrenia. Neuroimage. 2006;29:409–416. doi: 10.1016/j.neuroimage.2005.07.051. [DOI] [PubMed] [Google Scholar]
- Kapur S. Psychosis as a state of aberrant salience: a framework linking biology, phenomenology, and pharmacology in schizophrenia. Am J Psychiatry. 2003;160:13–23. doi: 10.1176/appi.ajp.160.1.13. [DOI] [PubMed] [Google Scholar]
- Kay SR, Fiszbein A, Opler LA. The positive and negative syndrome scale (PANSS) for schizophrenia. Schizophr Bull. 1987;13:261–276. doi: 10.1093/schbul/13.2.261. [DOI] [PubMed] [Google Scholar]
- Kircher TT, Leube DT, Erb M, Grodd W, Rapp AM. Neural correlates of metaphor processing in schizophrenia. Neuroimage. 2007;34:281–289. doi: 10.1016/j.neuroimage.2006.08.044. [DOI] [PubMed] [Google Scholar]
- Kircher TT, Liddle PF, Brammer MJ, Williams SC, Murray RM, McGuire PK. Neural correlates of formal thought disorder in schizophrenia: preliminary findings from a functional magnetic resonance imaging study. Arch Gen Psychiatry. 2001;58:769–774. doi: 10.1001/archpsyc.58.8.769. [DOI] [PubMed] [Google Scholar]
- Kircher TT, Liddle PF, Brammer MJ, Williams SC, Murray RM, McGuire PK. Reversed lateralization of temporal activation during speech production in thought disordered patients with schizophrenia. Psychol Med. 2002;32:439–449. doi: 10.1017/s0033291702005287. [DOI] [PubMed] [Google Scholar]
- Koeda M, Takahashi H, Yahata N, Matsuura M, Asai K, Okubo Y, et al. Language processing and human voice perception in schizophrenia: a functional magnetic resonance imaging study. Biol Psychiatry. 2006;59:948–957. doi: 10.1016/j.biopsych.2006.01.013. [DOI] [PubMed] [Google Scholar]
- Kraepelin E. In: Clinical Psychiatry: A Textbook for Students and Physicians. 7th ed. Diefendorf AR, translator. London: MacMillan Company; 1907. [Google Scholar]
- Krystal JH, Karper LP, Seibyl JP, Freeman GK, Delaney R, Bremner JD, et al. Subanesthetic effects of the noncompetitive NMDA antagonist, ketamine, in humans. Psychotomimetic, perceptual, cognitive, and neuroendocrine responses. Arch Gen Psychiatry. 1994;51:199–214. doi: 10.1001/archpsyc.1994.03950030035004. [DOI] [PubMed] [Google Scholar]
- Kubicki M, McCarley RW, Nestor PG, Huh T, Kikinis R, Shenton ME, et al. An fMRI study of semantic processing in men with schizophrenia. Neuroimage. 2003;20:1923–1933. doi: 10.1016/s1053-8119(03)00383-5. [DOI] [PMC free article] [PubMed] [Google Scholar]
- Kuperberg G, Heckers S. Schizophrenia and cognitive function. Curr Opin Neurobiol. 2000;10:205–210. doi: 10.1016/s0959-4388(00)00068-4. [DOI] [PubMed] [Google Scholar]
- Lahti AC, Holcomb HH, Medoff DR, Tamminga CA. Ketamine activates psychosis and alters limbic blood flow in schizophrenia. Neuroreport. 1995;6:869–872. doi: 10.1097/00001756-199504190-00011. [DOI] [PubMed] [Google Scholar]
- Lahti AC, Holcomb HH, Medoff DR, Weiler MA, Tamminga CA, Carpenter WT., Jr Abnormal patterns of regional cerebral blood flow in schizophrenia with primary negative symptoms during an effortful auditory recognition task. Am J Psychiatry. 2001;158:1797–1808. doi: 10.1176/appi.ajp.158.11.1797. [DOI] [PubMed] [Google Scholar]
- Lahti AC, Koffel B, LaPorte D, Tamminga CA. Subanesthetic doses of ketamine stimulate psychosis in schizophrenia. Neuropsychopharmacology. 1995;13:9–19. doi: 10.1016/0893-133X(94)00131-I. [DOI] [PubMed] [Google Scholar]
- Lennox BR, Park SB, Medley I, Morris PG, Jones PB. The functional anatomy of auditory hallucinations in schizophrenia. Psychiatry Res. 2000;100:13–20. doi: 10.1016/s0925-4927(00)00068-8. [DOI] [PubMed] [Google Scholar]
- Lewis DA, Levitt P. Schizophrenia as a disorder of neurodevelopment. Annu Rev Neurosci. 2002;25:409–432. doi: 10.1146/annurev.neuro.25.112701.142754. [DOI] [PubMed] [Google Scholar]
- Liddle PF. Schizophrenic syndromes, cognitive performance and neurological dysfunction. Psychol Med. 1987a;17:49–57. doi: 10.1017/s0033291700012976. [DOI] [PubMed] [Google Scholar]
- Liddle PF. The symptoms of chronic schizophrenia. A re-examination of the positive-negative dichotomy. Br J Psychiatry. 1987b;151:145–151. doi: 10.1192/bjp.151.2.145. [DOI] [PubMed] [Google Scholar]
- Liddle PF. Inner connections within domain of dementia praecox: role of supervisory mental processes in schizophrenia. Eur Arch Psychiatry Clin Neurosci. 1995;245:210–215. doi: 10.1007/BF02191799. [DOI] [PubMed] [Google Scholar]
- Liddle PF, Friston KJ, Frith CD, Hirsch SR, Jones T, Frackowiak RS. Patterns of cerebral blood flow in schizophrenia. Br J Psychiatry. 1992;160:179–186. doi: 10.1192/bjp.160.2.179. [DOI] [PubMed] [Google Scholar]
- Lipsey MW, Wilson DB. Practical Meta-Analysis. Vol. 49. Thousands Oak: Sage Publications; 2001. [Google Scholar]
- Logothetis NK, Pauls J, Augath M, Trinath T, Oeltermann A. Neurophysiological investigation of the basis of the fMRI signal. Nature. 2001;412:150–157. doi: 10.1038/35084005. [DOI] [PubMed] [Google Scholar]
- Lopez-Garcia P, Aizenstein HJ, Snitz BE, Walter RP, Carter CS. Automated ROI-based brain parcellation analysis of frontal and temporal brain volumes in schizophrenia. Psychiatry Res. 2006;147:153–161. doi: 10.1016/j.pscychresns.2006.04.007. [DOI] [PubMed] [Google Scholar]
- MacDonald AW, 3rd, Carter CS. Event-related FMRI study of context processing in dorsolateral prefrontal cortex of patients with schizophrenia. J Abnorm Psychol. 2003;112:689–697. doi: 10.1037/0021-843X.112.4.689. [DOI] [PubMed] [Google Scholar]
- MacDonald AW, 3rd, Carter CS, Kerns JG, Ursu S, Barch DM, Holmes AJ, et al. Specificity of prefrontal dysfunction and context processing deficits to schizophrenia in never-medicated patients with first-episode psychosis. Am J Psychiatry. 2005;162:475–484. doi: 10.1176/appi.ajp.162.3.475. [DOI] [PubMed] [Google Scholar]
- Manoach DS, Gollub RL, Benson ES, Searl MM, Goff DC, Halpern E, et al. Schizophrenic subjects show aberrant fMRI activation of dorsolateral prefrontal cortex and basal ganglia during working memory performance. Biol Psychiatry. 2000;48:99–109. doi: 10.1016/s0006-3223(00)00227-4. [DOI] [PubMed] [Google Scholar]
- Manoach DS, Press DZ, Thangaraj V, Searl MM, Goff DC, Halpern E, et al. Schizophrenic subjects activate dorsolateral prefrontal cortex during a working memory task, as measured by fMRI. Biol Psychiatry. 1999;45:1128–1137. doi: 10.1016/s0006-3223(98)00318-7. [DOI] [PubMed] [Google Scholar]
- Menon V, Anagnoson RT, Mathalon DH, Glover GH, Pfefferbaum A. Functional neuroanatomy of auditory working memory in schizophrenia: relation to positive and negative symptoms. Neuroimage. 2001;13:433–446. doi: 10.1006/nimg.2000.0699. [DOI] [PubMed] [Google Scholar]
- Mohanty A, Herrington JD, Koven NS, Fisher JE, Wenzel EA, Webb AG, et al. Neural mechanisms of affective interference in schizotypy. J Abnorm Psychol. 2005;114:16–27. doi: 10.1037/0021-843X.114.1.16. [DOI] [PubMed] [Google Scholar]
- Molina V, Reig S, Pascau J, Sanz J, Sarramea F, Gispert JD, et al. Anatomical and functional cerebral variables associated with basal symptoms but not risperidone response in minimally treated schizophrenia. Psychiatry Res. 2003;124:163–175. doi: 10.1016/s0925-4927(03)00107-0. [DOI] [PubMed] [Google Scholar]
- Murray GK, Corlett PR, Clark L, Pessiglione M, Blackwell AD, Honey G, et al. Substantia nigra/ventral tegmental reward prediction error disruption in psychosis. Mol Psychiatry. 2007 doi: 10.1038/sj.mp.4002058. [DOI] [PMC free article] [PubMed] [Google Scholar]
- Ngan ET, Vouloumanos A, Cairo TA, Laurens KR, Bates AT, Anderson CM, et al. Abnormal processing of speech during oddball target detection in schizophrenia. Neuroimage. 2003;20:889–897. doi: 10.1016/S1053-8119(03)00385-9. [DOI] [PubMed] [Google Scholar]
- Niu L, Matsui M, Zhou SY, Hagino H, Takahashi T, Yoneyama E, et al. Volume reduction of the amygdala in patients with schizophrenia: a magnetic resonance imaging study. Psychiatry Res. 2004;132:41–51. doi: 10.1016/j.pscychresns.2004.06.002. [DOI] [PubMed] [Google Scholar]
- Northoff G, Richter A, Bermpohl F, Grimm S, Martin E, Marcar VL, et al. NMDA hypofunction in the posterior cingulate as a model for schizophrenia: an exploratory ketamine administration study in fMRI. Schizophr Res. 2005;72:235–248. doi: 10.1016/j.schres.2004.04.009. [DOI] [PubMed] [Google Scholar]
- Overall J, Gorham D. The brief psychiatric rating scale. Psychological Reports. 1962;10:799–812. [Google Scholar]
- Peralta V, Cuesta MJ. Psychometric properties of the positive and negative syndrome scale (PANSS) in schizophrenia. Psychiatry Res. 1994;53:31–40. doi: 10.1016/0165-1781(94)90093-0. [DOI] [PubMed] [Google Scholar]
- Perlstein WM, Carter CS, Noll DC, Cohen JD. Relation of prefrontal cortex dysfunction to working memory and symptoms in schizophrenia. Am J Psychiatry. 2001;158:1105–1113. doi: 10.1176/appi.ajp.158.7.1105. [DOI] [PubMed] [Google Scholar]
- Phillips ML, Drevets WC, Rauch SL, Lane R. Neurobiology of emotion perception I: The neural basis of normal emotion perception. Biol Psychiatry. 2003a;54:504–514. doi: 10.1016/s0006-3223(03)00168-9. [DOI] [PubMed] [Google Scholar]
- Phillips ML, Drevets WC, Rauch SL, Lane R. Neurobiology of emotion perception II: Implications for major psychiatric disorders. Biol Psychiatry. 2003b;54:515–528. doi: 10.1016/s0006-3223(03)00171-9. [DOI] [PubMed] [Google Scholar]
- Phillips ML, Williams L, Senior C, Bullmore ET, Brammer MJ, Andrew C, et al. A differential neural response to threatening and non-threatening negative facial expressions in paranoid and non-paranoid schizophrenics. Psychiatry Res. 1999;92:11–31. doi: 10.1016/s0925-4927(99)00031-1. [DOI] [PubMed] [Google Scholar]
- Plaze M, Bartres-Faz D, Martinot JL, Januel D, Bellivier F, De Beaurepaire R, et al. Left superior temporal gyrus activation during sentence perception negatively correlates with auditory hallucination severity in schizophrenia patients. Schizophr Res. 2006;87:109–115. doi: 10.1016/j.schres.2006.05.005. [DOI] [PubMed] [Google Scholar]
- Poldrack RA, Fletcher PC, Henson RN, Worsleyv KJ, Brett M, Nichols TE. Guidelines for reporting an fMRI study. Neuroimage. 2008;40:409–414. doi: 10.1016/j.neuroimage.2007.11.048. [DOI] [PMC free article] [PubMed] [Google Scholar]
- Potkin SG, Alva G, Fleming K, Anand R, Keator D, Carreon D, et al. A PET study of the pathophysiology of negative symptoms in schizophrenia. Am J Psychiatry. 2002;159:227–237. doi: 10.1176/appi.ajp.159.2.227. [DOI] [PubMed] [Google Scholar]
- Rapoport JL, Addington AM, Frangou S, Psych MR. The neurodevelopmental model of schizophrenia: update 2005. Mol Psychiatry. 2005;10:434–449. doi: 10.1038/sj.mp.4001642. [DOI] [PubMed] [Google Scholar]
- Russell TA, Reynaud E, Kucharska-Pietura K, Ecker C, Benson PJ, Zelaya F, et al. Neural responses to dynamic expressions of fear in schizophrenia. Neuropsychologia. 2006 doi: 10.1016/j.neuropsychologia.2006.04.026. [DOI] [PubMed] [Google Scholar]
- Sacchetti B, Lorenzini CA, Baldi E, Tassoni G, Bucherelli C. Auditory thalamus, dorsal hippocampus, basolateral amygdala, and perirhinal cortex role in the consolidation of conditioned freezing to context and to acoustic conditioned stimulus in the rat. J Neurosci. 1999;19:9570–9578. doi: 10.1523/JNEUROSCI.19-21-09570.1999. [DOI] [PMC free article] [PubMed] [Google Scholar]
- Shergill SS, Brammer MJ, Amaro E, Williams SC, Murray RM, McGuire PK. Temporal course of auditory hallucinations. Br J Psychiatry. 2004;185:516–517. doi: 10.1192/bjp.185.6.516. [DOI] [PubMed] [Google Scholar]
- Shergill SS, Brammer MJ, Williams SC, Murray RM, McGuire PK. Mapping auditory hallucinations in schizophrenia using functional magnetic resonance imaging. Arch Gen Psychiatry. 2000;57:1033–1038. doi: 10.1001/archpsyc.57.11.1033. [DOI] [PubMed] [Google Scholar]
- Shergill SS, Cameron LA, Brammer MJ, Williams SC, Murray RM, McGuire PK. Modality specific neural correlates of auditory and somatic hallucinations. J Neurol Neurosurg Psychiatry. 2001;71:688–690. doi: 10.1136/jnnp.71.5.688. [DOI] [PMC free article] [PubMed] [Google Scholar]
- Smith GS, Schloesser R, Brodie JD, Dewey SL, Logan J, Vitkun SA, et al. Glutamate modulation of dopamine measured in vivo with positron emission tomography (PET) and 11C-raclopride in normal human subjects. Neuropsychopharmacology. 1998;18:18–25. doi: 10.1016/S0893-133X(97)00092-4. [DOI] [PubMed] [Google Scholar]
- Snitz BE, MacDonald A, 3rd, Cohen JD, Cho RY, Becker T, Carter CS. Lateral and medial hypofrontality in first-episode schizophrenia: functional activity in a medication-naive state and effects of short-term atypical antipsychotic treatment. Am J Psychiatry. 2005;162:2322–2329. doi: 10.1176/appi.ajp.162.12.2322. [DOI] [PubMed] [Google Scholar]
- Steel P. MetaExcel [Computer software] 2008 Retrieved 6/15/2008 from www.procrastinus.com. [Google Scholar]
- Stuart GW, Pantelis C, Klimidis S, Minas IH. The three-syndrome model of schizophrenia: meta-analysis of an artefact. Schizophr Res. 1999;39:233–242. doi: 10.1016/s0920-9964(99)00019-5. [DOI] [PubMed] [Google Scholar]
- Subotnik KL, Bartzokis G, Green MF, Nuechterlein KH. Neuroanatomical correlates of formal thought disorder in schizophrenia. Cognit Neuropsychiatry. 2003;8:81–88. doi: 10.1080/13546800244000148. [DOI] [PubMed] [Google Scholar]
- Surguladze S, Russell T, Kucharska-Pietura K, Travis MJ, Giampietro V, David AS, et al. A reversal of the normal pattern of parahippocampal response to neutral and fearful faces is associated with reality distortion in schizophrenia. Biol Psychiatry. 2006;60:423–431. doi: 10.1016/j.biopsych.2005.11.021. [DOI] [PubMed] [Google Scholar]
- Surguladze SA, Calvert GA, Brammer MJ, Campbell R, Bullmore ET, Giampietro V, et al. Audio-visual speech perception in schizophrenia: an fMRI study. Psychiatry Res. 2001;106:1–14. doi: 10.1016/s0925-4927(00)00081-0. [DOI] [PubMed] [Google Scholar]
- Suzuki M, Zhou SY, Hagino H, Niu L, Takahashi T, Kawasaki Y, et al. Morphological brain changes associated with Schneider's first-rank symptoms in schizophrenia: a MRI study. Psychol Med. 2005;35:549–560. doi: 10.1017/s0033291704003885. [DOI] [PubMed] [Google Scholar]
- Szeszko PR, Goldberg E, Gunduz-Bruce H, Ashtari M, Robinson D, Malhotra AK, et al. Smaller anterior hippocampal formation volume in antipsychotic-naive patients with first-episode schizophrenia. Am J Psychiatry. 2003;160:2190–2197. doi: 10.1176/appi.ajp.160.12.2190. [DOI] [PubMed] [Google Scholar]
- Taylor SF, Liberzon I, Decker LR, Koeppe RA. A functional anatomic study of emotion in schizophrenia. Schizophr Res. 2002;58:159–172. doi: 10.1016/s0920-9964(01)00403-0. [DOI] [PubMed] [Google Scholar]
- Taylor SF, Welsh RC, Chen AC, Velander AJ, Liberzon I. Medial frontal hyperactivity in reality distortion. Biol Psychiatry. 2007;61:1171–1178. doi: 10.1016/j.biopsych.2006.11.029. [DOI] [PubMed] [Google Scholar]
- Turetsky B, Cowell PE, Gur RC, Grossman RI, Shtasel DL, Gur RE. Frontal and temporal lobe brain volumes in schizophrenia. Relationship to symptoms and clinical subtype. Arch Gen Psychiatry. 1995;52:1061–1070. doi: 10.1001/archpsyc.1995.03950240079013. [DOI] [PubMed] [Google Scholar]
- Vaiva G, Cottencin O, Llorca PM, Devos P, Dupont S, Mazas O, et al. Regional cerebral blood flow in deficit/nondeficit types of schizophrenia according to SDS criteria. Prog Neuropsychopharmacol Biol Psychiatry. 2002;26:481–485. doi: 10.1016/s0278-5846(01)00292-5. [DOI] [PubMed] [Google Scholar]
- Ventura J, Lukoff D, Nuechterlein KH, Liberman RP, Green MF, Shaner A. Manual for the expanded Brief Psychiatric Rating Scale. International Journal of Methods in Psychiatric Research. 1993;3:221–224. [Google Scholar]
- Wang L, Mamah D, Harms MP, Karnik M, Price JL, Gado MH, et al. Progressive Deformation of Deep Brain Nuclei and Hippocampal-Amygdala Formation in Schizophrenia. Biol Psychiatry. 2008 doi: 10.1016/j.biopsych.2008.08.007. [DOI] [PMC free article] [PubMed] [Google Scholar]
- Weinstein S, Werker JF, Vouloumanos A, Woodward TS, Ngan ET. Do you hear what I hear? Neural correlates of thought disorder during listening to speech in schizophrenia. Schizophr Res. 2006;86:130–137. doi: 10.1016/j.schres.2006.05.011. [DOI] [PubMed] [Google Scholar]
- Williams LM, Das P, Harris AW, Liddell BB, Brammer MJ, Olivieri G, et al. Dysregulation of arousal and amygdala-prefrontal systems in paranoid schizophrenia. Am J Psychiatry. 2004;161:480–489. doi: 10.1176/appi.ajp.161.3.480. [DOI] [PubMed] [Google Scholar]
- Williams LM, Das P, Liddell BJ, Olivieri G, Peduto AS, David AS, et al. Fronto-limbic and autonomic disjunctions to negative emotion distinguish schizophrenia subtypes. Psychiatry Res. 2007;155:29–44. doi: 10.1016/j.pscychresns.2006.12.018. [DOI] [PubMed] [Google Scholar]
- Winterer G, Musso F, Beckmann C, Mattay V, Egan MF, Jones DW, et al. Instability of prefrontal signal processing in schizophrenia. Am J Psychiatry. 2006;163:1960–1968. doi: 10.1176/ajp.2006.163.11.1960. [DOI] [PubMed] [Google Scholar]
- Woodruff PW, Wright IC, Bullmore ET, Brammer M, Howard RJ, Williams SC, et al. Auditory hallucinations and the temporal cortical response to speech in schizophrenia: a functional magnetic resonance imaging study. Am J Psychiatry. 1997;154:1676–1682. doi: 10.1176/ajp.154.12.1676. [DOI] [PubMed] [Google Scholar]
- Wright IC, Rabe-Hesketh S, Woodruff PW, David AS, Murray RM, Bullmore ET. Meta-analysis of regional brain volumes in schizophrenia. Am J Psychiatry. 2000;157:16–25. doi: 10.1176/ajp.157.1.16. [DOI] [PubMed] [Google Scholar]
- Yamasaki S, Yamasue H, Abe O, Yamada H, Iwanami A, Hirayasu Y, et al. Reduced planum temporale volume and delusional behaviour in patients with schizophrenia. Eur Arch Psychiatry Clin Neurosci. 2007;257:318–324. doi: 10.1007/s00406-007-0723-5. [DOI] [PubMed] [Google Scholar]
- Yamasue H, Iwanami A, Hirayasu Y, Yamada H, Abe O, Kuroki N, et al. Localized volume reduction in prefrontal, temporolimbic, and paralimbic regions in schizophrenia: an MRI parcellation study. Psychiatry Res. 2004;131:195–207. doi: 10.1016/j.pscychresns.2004.05.004. [DOI] [PubMed] [Google Scholar]
- Yoon JH, Minzenberg MJ, Ursu S, Walters R, Wendelken C, Ragland JD, et al. Association of dorsolateral prefrontal cortex dysfunction with disrupted coordinated brain activity in schizophrenia: relationship with impaired cognition, behavioral disorganization, and global function. Am J Psychiatry. 2008;165:1006–1014. doi: 10.1176/appi.ajp.2008.07060945. [DOI] [PMC free article] [PubMed] [Google Scholar]
- Zhou Y, Liang M, Tian L, Wang K, Hao Y, Liu H, et al. Functional disintegration in paranoid schizophrenia using resting-state fMRI. Schizophr Res. 2007;97:194–205. doi: 10.1016/j.schres.2007.05.029. [DOI] [PubMed] [Google Scholar]