

Abstract
Ethnic differences in insulin secretion and action between African-Americans (AA) and European-Americans (EA) may influence mobilization of free fatty acids (FFA). We tested the hypotheses that FFA concentrations would be associated with measures of insulin secretion and action before and during a glucose challenge test. Subjects were 48 pre-pubertal girls, 60 pre-menopausal women, and 46 post-menopausal women. Fasting insulin (insulin0), the acute insulin response to glucose (AIRg), the insulin sensitivity index (SI), basal and nadir FFA (FFA0, FFAnadir), and nadir time (TIMEnadir) were determined during an intravenous glucose tolerance test. Stepwise multiple linear regression (MLR) analysis was conducted to identify associations of FFA0, FFAnadir, and TIMEnadir with ethnicity, age group, insulin measures, indices of body composition from DXA, and measures of fat distribution from CT scan. In this population, insulin0 and AIRg were higher among AA vs. EA, whereas SI was lower, independent of age group. MLR analyses indicated that FFA0 was best predicted by lean tissue mass, leg fat mass, ethnicity (lower in AA), SI, and insulin0. FFAnadir was best predicted by FFA0, age group, and intra-abdominal adipose tissue. TIMEnadir was best predicted by leg fat mass, AIRg, and SI. In conclusion, indices of insulin secretion and action were associated with FFA dynamics in healthy girls and women. Lower FFA0 among AA was independent of insulin0 and Si. Whether lower FFA0 is associated with substrate oxidation or risk for obesity remains to be determined.
Introduction
Greater fasting and post-challenge insulin concentrations among African-Americans (AA) vs. European-Americans (EA) have been reported (1-4). In healthy (non-diabetic) adults, the acute insulin response to glucose (AIRg) was ∼39% higher among AA compared to non-Hispanic whites (4). Similarly in children, AIRg was more than two-fold higher among AA vs. EA, independent of insulin sensitivity (3). Among 30 healthy AA and EA adolescents, AA had ∼50% higher first-phase insulin levels, ∼38% higher second-phase insulin levels, during a hyperglycemic clamp compared to EA (1). Some studies also have reported higher basal insulin among AA vs. EA (4). Greater insulin among AA cannot be accounted for by differences in insulin sensitivity or body composition (3;5;6).
Insulin is both lipogenic and anti-lipolytic (7). Thus, higher insulin among AA may affect metabolism of free fatty acids (FFA) and thereby maintenance or accrual of adipose tissue. FFA levels are highest in the fasted state, and decline in response to insulin. Elevation of endogenous insulin experimentally via glucose injection, or naturally via consumption of a carbohydrate-containing meal, results in a rapid decline in FFA (8-11). It has been hypothesized that greater insulin among AA vs. EA results in greater suppression of lipolysis and lower circulating concentrations of free fatty acids (FFA) (1;12;13).
Existing research in young children supports an association between insulin and FFA metabolism. We previously conducted a small study involving a group of 8 EA and 8 AA pre-pubertal boys matched for insulin sensitivity (12). Children were given an intravenous glucose challenge while in the fasted state, and postchallenge concentrations of serum insulin and FFA were assessed. In this earlier study, the FFA nadir (FFAnadir) during the test was lower among AA, who also had two-fold higher post-challenge insulin than EA children. Furthermore, lower FFAnadir was associated with higher post-challenge insulin. Basal concentrations of FFA also are reported to be lower, and insulin concentrations higher, among AA vs. EA adolescents matched for BMI (1). Further, during a hyperglycemic clamp, fat oxidation was lower among AA vs. EA, suggesting that lower circulating FFA limited the availability of lipid substrate for oxidation. Reduced lipid oxidation may ultimately contribute to risk for obesity, which is greater among AA vs. EA.
Whether ethnic differences in FFA metabolism are maintained into adulthood is not known. Pancreatic beta-cell function is reported to decline with age (14), which may result in a reduction in the anti-lipolytic effect of insulin. If this is the case, then ethnic differences in FFA metabolism may be less apparent among older subjects. The effect of age on FFA metabolism has not been studied in a bi-ethnic population.
This study was conducted in three age groups of AA and EA females to test the hypothesis that FFA concentrations would be associated with measures of insulin secretion and action before and during a glucose challenge test. Specifically, we hypothesized that 1) basal (fasting) concentrations of FFA (FFA0) would be inversely associated with fasting insulin; 2) nadir concentrations of FFA (FFAnadir) and the time at which the nadir occurred (TIMEnadir) would be inversely associated with AIRg; 3) FFA concentrations would not differ with ethnicity after accounting for measures of insulin secretion and action; and 4) AIRg would decline, and FFAnadir would increase, with age. Women were selected for the study due to the greater prevalence of obesity and type 2 diabetes among AA women (15;16).
Methods and Procedures
Subjects
Subjects were AA and EA girls and women, recruited as three age groups: pre-pubertal (age 7-12 years), pre-menopausal (age 18-32 years), and post-menopausal (age 50-70 years). Data on insulin sensitivity and lipids from the adult subjects have been published (17). Exclusion criteria were type 1 or type 2 diabetes, polycystic ovarian disease, any disorders of glucose or lipid metabolism, use of medication that could affect body composition or glucose metabolism (including oral contraceptives and postmenopausal hormone replacement therapy), use of tobacco, alcohol consumption in excess of 400 grams per week, history of hypoglycemic episodes, and a medical history that counter-indicated inclusion in the study. The minimum weight for children admitted to the study was 20 kg to minimize risks associated with blood sampling. All subjects had normal glucose tolerance (18). Participants were informed of the experimental design, and oral and written consent were obtained. The study was approved by the Institutional Review Board for Human Use at the University of Alabama at Birmingham (UAB).
Methods
Protocol
All testing was done on an in-patient basis at UAB's General Clinical Research Center (GCRC). Participants were asked to consume at least 250 grams carbohydrates for 3 days prior to admission, and were provided with a list of common foods and their carbohydrate content. Pre-menopausal women were tested in the follicular stage of the menstrual cycle. Subjects came to the GCRC the evening prior to testing. While at the GCRC, participants were given a standard meal based on estimated energy needs, and consisting of 50% energy from carbohydrate, 30% energy from fat, and 20% energy from protein. A computed tomography (CT) scan was done at UAB's Radiology facility between 7:00 pm and 9:00 pm. No food was consumed for 12 hours prior to intravenous glucose tolerance testing, which was performed at 7:00 am the following morning. After completion of the glucose tolerance test, subjects were given a late breakfast/lunch. Body composition was subsequently assessed in the Department of Nutrition Sciences. All children were accompanied by one parent during testing.
Body composition and fat distribution
Total and regional body composition were measured by dual-energy X-ray absorptiometry (DXA) using a Lunar Prodigy densitometer (GE-Lunar Corporation, Madison, WI). Subjects were required to wear light clothing, remove all metal objects from their body, and lie flat on their backs with arms at their sides while undergoing a total body scan. Intra-abdominal adipose tissue (IAAT) and subcutaneous abdominal adipose tissue (SAAT) were determined by computed tomography (CT) scanning. Scans were performed with a HiLight/Advantage Scanner (General Electric, Milwaukee). A 5 millimeter scan at the level of the umbilicus (approximately the L4-L5 intervertebral space) was taken. Scans were analyzed for cross-sectional area (cm2) of adipose tissue using the density contour program with Hounsfield units for adipose tissue set at −190 to −30. The test-retest reliability for IAAT was 1.7% (19). The same person analyzed all scans. Because adipose tissue distribution affects FFA flux (10), and because flux rate differs among individual adipose tissue depots (20), IAAT, SAAT, and leg fat were included in statistical analyses. LTM was included in analyses to account for differences in body size and for the strong influence of resting metabolic rate on FFA metabolism (21).
Intravenous glucose tolerance test (IVGTT)
Basal insulin concentration (insulin0), the insulin sensitivity index (SI), the acute insulin response to glucose (AIRg), the disposition index (DI), and basal and nadir FFA were determined during an intravenous glucose tolerance test (IVGTT). Flexible catheters were placed in the antecubital spaces of both arms. Three blood samples were taken over a 15 min period to determine basal glucose, insulin, and FFA (the average of the values was used for basal concentrations). At time zero, glucose (50% dextrose, 300 mg/kg) was given intravenously. Insulin (0.02 Units/kg) was infused over a 5-min period from 20-25 min post glucose injection. For adults, blood samples (2.0 ml) were collected at the following times (in min) relative to glucose administration: 2, 3, 4, 5, 6, 8, 10, 12, 15, 19, 20, 21, 22, 24, 26, 28, 30, 35, 40, 45, 50, 55, 60, 70, 80, 100, 120, 140, 180, 210, 240, 300. For children, a reduced sampling protocol was used, where blood was drawn at baseline (two samples) and at 2, 3, 4, 5, 6, 8, 10, 12, 15, 19, 20, 21, 22, 24, 26, 28, 30, 35, 40, 50, 60, 70, and 240 min post glucose injection (total of 25 samples). Serum was stored at -85°C until analysis. Glucose and insulin values were entered into the minimal model computer program (version 3.9) for determination of the insulin sensitivity index (SI) and the acute insulin response to glucose (AIRg). AIRg is the integrated incremental area under the curve for insulin during the first 10 min of the test, and is measure of post-challenge insulin concentration. The disposition index (DI; (22)) was calculated as the product of SI and AIRg, and thereby reflects the combined effects of insulin sensitivity and insulin concentration. Basal FFA (FFA0) was the average of the baseline values (prior to glucose administration). Nadir FFA (FFAnadir) was the lowest value measured following glucose administration. Both nadir value and time were recorded.
Laboratory analyses
Concentrations of glucose, insulin, and FFA were analyzed in the Metabolism Core Laboratory of the GCRC and Clinical Nutrition Research Center (CNRC). Glucose was measured in 10 μL sera using an Ektachem DT II System (Johnson and Johnson Clinical Diagnostics). This analysis had a mean intra-assay coefficient of variation (CV) of 0.61%, and a mean inter-assay CV of 1.45%. Insulin was assayed in duplicate 100 μL aliquots with reagents from Linco Research Inc. (St. Charles, MO; assay sensitivity 3.35 μIU/ml; mean intra-assay CV 3.49%; mean interassay CV 5.57%). FFA were assayed with “NEFA-C” reagents (Wako Diagnostics, Richmond, VA (12)). At a FFA concentration of 0.433 mEq/L (which approximates fasting values), the intra-assay cv was 3.89%, and the inter-assay cv was 5.87%. Minimum assay sensitivity was 0.0014 mEq/L. All values reported/analyzed for this study were in the detectable range. One value was omitted due to procedural problems (high background) and was deemed unreliable.
Statistical Analysis
Distributions of variables were examined. SI, AIRg, and insulin0 values were log-10 transformed prior to statistical analysis. All statistical tests were two-sided and were performed using a Type I error rate of 0.05 unless otherwise noted. All statistical analyses were performed using SAS (version 9.1; SAS Institute, Inc., Cary, NC).
Descriptive statistics were computed using ANOVA for main effects of ethnicity and age group. AIRg also was examined by ANCOVA, adjusting for SI.
Pearson partial correlation analysis, adjusting for LTM, was conducted to examine associations of FFA0, FFAnadir, and TIMEnadir with body composition, fat distribution, and insulin measures. Data were adjusted for LTM in order to examine associations with adiposity, rather than absolute fat mass, and to account for differences in body size.
Stepwise multiple linear regression (MLR) analyses were performed to identify the variables that best predicted FFA0, FFAnadir, and TIMEnadir. Independent variables used for FFA0 were ethnicity, age group, SI, insulin0, LTM, IAAT, SAAT, and leg fat; for FFAnadir were FFA0, ethnicity, age group, SI, AIRg, LTM, IAAT, SAAT, and leg fat; and for TIMEnadir were FFA0, ethnicity, age group, SI, AIRg, LTM, IAAT, SAAT, and leg fat. Criteria for model entry and exit was set at P=0.15. Subsequently, MLR analysis (non-stepwise) was conducted using the variables identified in the stepwise analysis to generate a final model for presentation.
To examine the independent effect of age on FFA0, FFAnadir, and Timenadir, and the possible associations with age-related changes in insulin measures, analysis of covariance (ANCOVA) was used, adjusting for the relevant independent body composition variables identified in MLR analysis. Class variables were ethnicity and age group; covariates were LTM and leg fat mass (for FFA0), IAAT and FFA0 (for FFAnadir), and leg fat mass (for TIMEnadir); and the interaction term was (ethnicity × age group).
Results
Descriptive characteristics of the subject population are shown in Table 1 by ethnicity and age group. SI was lower (P<0.001), and insulin0 (P<0.05) and DI (P<0.001) higher, among AA vs. EA. AIRg was higher among AA (P<0.001) and younger subjects (<0.05), both unadjusted (Table 1), and after adjusting for SI (Fig. 1). TIMEnadir was earlier among children than among older subjects (P<0.001). Among all subjects combined, mean TIMEnadir was 51.8 +/- 16.6 min; range was 10-100 min; median was 50 min.
Table 1.
Descriptive statistics by ethnicity and age group (mean ± SD).
| Prepubertal | Premenopausal | Postmenopausal | |
|---|---|---|---|
| European American (n=78) | n=14 | n=33 | n=31 |
| Age (yr) | 9.6 ± 1.6 | 25.7 ± 3.5 | 55.7 ± 4.2 |
| BMI (kg/m2) | 17.6 ± 1.8 | 26.1 ± 6.0 | 26.2 ± 5.1 |
| FFA0 (mEq/L) | 0.65 ± 0.27 | 0.51 ± 0.16 | 0.57 ± 0.20 |
| FFAnadir (mEq/L) | 0.12 ± 0.04 | 0.08 ± 0.04 | 0.08 ± 0.04 |
| TIMEnadir (min) | 46 ± 13 | 57 ± 16 | 55 ± 10 |
| Fasting insulin (μIU/ml) | 10.9 ± 3.2 | 10.6 ± 4.6 | 12.2 ± 7.2 |
| AIRg (μIU/ml × 10 min) | 592 ± 287 | 493 ± 375 | 443 ± 341 |
| SI [×10-4 min-1/(μIU/ml)] | 5.28 ± 1.65 | 4.86 ± 2.74 | 5.02 ± 3.76 |
| DI (×10-4min-1) | 2905 ± 1060 | 2015 ± 1340 | 1768 ± 1716 |
| LTM (kg) | 23.2 ± 4.6 | 41.4 ± 5.2 | 39.2 ± 4.4 |
| Total body fat (kg) | 8.7 ± 4.0 | 27.2 ± 12.3 | 28.3 ± 11.6 |
| Leg fat (kg) | 3.9 ± 1.5 | 11.3 ± 4.4 | 10.7 ± 4.3 |
| SAAT (cm2) | 81.1 ± 39.4 | 280.0 ± 166.7 | 269.3 ± 163.1 |
| IAAT (cm2) | 30.6 ± 12.9 | 69.2 ± 45.3 | 122.8 ± 66.4 |
| African American (n=76) | n=34 | n=27 | n=15 |
| Age (yr) | 9.3 ± 1.5 | 24.8 ± 3.3 | 56.6 ± 5.1 |
| BMI (kg/m2) | 19.3 ± 4.1 | 27.6 ± 6.2 | 30.5 ± 5.5 |
| FFA0 (mEq/L) | 0.54 ± 0.24 | 0.53 ± 0.16 | 0.56 ± 0.16 |
| FFAnadir (mEq/L) | 0.10 ± 0.06 | 0.06 ± 0.04 | 0.09 ± 0.08 |
| TIMEnadir (min) | 41 ± 16 | 53 ± 21 | 61 ± 11 |
| Fasting insulin (μIU/ml) | 14.7 ± 5.7 | 11.9 ± 3.7 | 12.6 ± 4.9 |
| AIRg (μIU/ml × 10 min) | 1473 ± 751 | 1089 ± 713 | 933 ± 536 |
| SI [×10-4 min-1/(μIU/ml)] | 3.52 ± 2.22 | 3.63 ± 3.63 | 3.28 ± 2.68 |
| DI (×10-4min-1) | 4412 ± 2061 | 3051 ± 1883 | 2573 ± 2453 |
| LTM (kg) | 25.7 ± 5.3 | 42.5 ± 4.7 | 43.0 ± 5.1 |
| Total body fat (kg) | 10.3 ± 6.9 | 28.6 ± 14.3 | 37.6 ± 12.8 |
| Leg fat (kg) | 4.7 ± 2.7 | 12.5 ± 5.8 | 15.6 ± 5.6 |
| SAAT (cm2) | 96.0 ± 74.5 | 262.8 ± 177.6 | 416.6 ± 176.8 |
| IAAT (cm2) | 27.6 ± 17.8 | 42.3 ± 23.4 | 114.1 ± 40.2 |
BMI=body mass index; FFA0=basal (fasting) free-fatty acid concentration; FFAnadir=free fatty acid nadir concentration; TIMEnadir=time of free fatty acid nadir; AIRg=acute insulin response to glucose; SI=insulin sensitivity index; DI=disposition index; LTM=lean tissue mass; SAAT=subcutaneous abdominal adipose tissue; IAAT=intra-abdominal adipose tissue
Fig. 1.
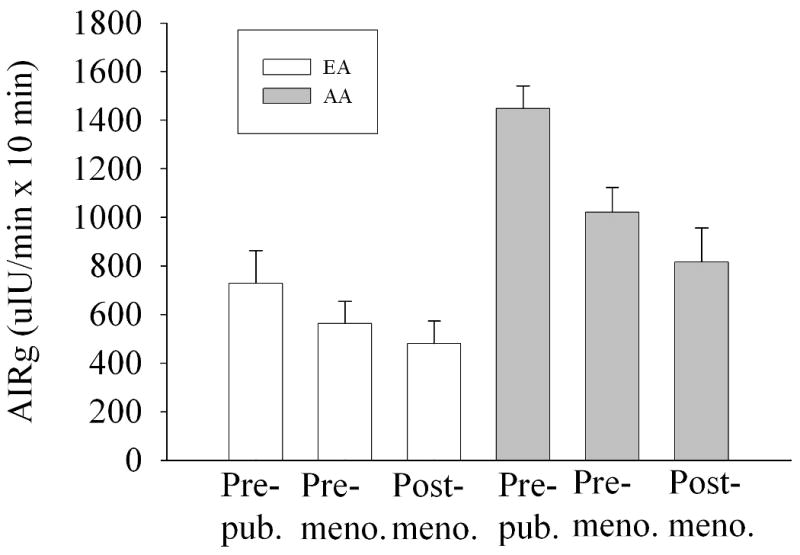
Mean (± SEM) AIRg by ethnicity and age group, adjusted for SI. P for age group (<0.001) and ethnicity (<0.001). The (age group × ethnicity) interaction term was not significant (P=0.936).
Partial correlation analysis, adjusting for LTM, indicated FFA0, FFAnadir, and Timenadir were variably associated both with measures of insulin outcomes (insulin0, AIRg, Si, and DI) and with body composition / fat distribution outcomes (fat mass, IAAT, SAAT, and leg fat) (Table 2). TIMEnadir was significantly associated with both SI and AIRg, whereas FFA0 was associated with DI, and FFAnadir with SI. FFA0 was associated with subcutaneous adipose tissue (SAAT and leg fat), whereas FFAnadir and TIMEnadir were associated with both subcutaneous depots and IAAT.
Table 2.
Partial correlations of FFA0, FFAnadir, and Timenadir with measures of insulin, body composition, and body fat distribution. All associations adjusted for lean tissue mass (LTM), except those including LTM. All subjects combined.
| FFA0 | FFAnadir | TIMEnadir | Insulin0 | SI | AIRg | DI | LTM | |
|---|---|---|---|---|---|---|---|---|
| Fat mass | 0.26* | 0.25* | 0.28* | 0.33* | -0.38* | 0.15 | -0.07 | 0.73* |
| IAAT | 0.13 | 0.20* | 0.18* | 0.25* | -0.24* | -0.02 | -0.14 | 0.44* |
| SAAT | 0.26* | 0.25* | 0.28* | 0.34* | -0.37* | 0.12 | -0.10 | 0.62* |
| Leg fat | 0.28* | 0.21* | 0.25* | 0.25* | -0.31* | 0.16 | -0.01 | 0.74* |
| LTM | -0.14 | -0.24* | 0.41* | 0.12 | -0.30* | -0.16 | -0.36* | --- |
| Insulin0 | -0.04 | 0.19* | 0.02 | --- | --- | --- | --- | --- |
| SI | -0.16 | -0.21* | -0.24* | -0.66* | --- | --- | --- | --- |
| AIRg | -0.01 | 0.08 | 0.28* | 0.47* | -0.59* | --- | --- | --- |
| DI | -0.20* | -0.12 | 0.18* | -0.00 | 0.23* | 0.55* | --- | --- |
IAAT=intra-abdominal adipose tissue; SAAT=subcutaneous abdominal adipose tissue; LTM=lean tissue mass; insulin0=fasting insulin; SI=insulin sensitivity index; AIRg=acute insulin response to glucose; DI=disposition index
P<0.05
Stepwise MLR analysis for the dependent variable FFA0 indicated that a model containing LTM, leg fat, ethnicity, SI, and insulin0 best explained FFA0 (model R2 = 0.15, Table 3, Model A). FFA0 was lower among AA, and among subjects with higher SI and higher fasting insulin concentration. Greater FFA0 was associated with greater leg fat mass and lesser LTM. Stepwise MLR analysis for the dependent variable FFAnadir indicated that a model containing FFA0, age group, and IAAT best explained FFAnadir (model R2 = 0.36, Table 3, Model B). FFAnadir was higher in younger subjects, and among subjects with greater IAAT. Stepwise MLR analysis for the dependent variable TIMEnadir indicated that a model containing leg fat mass, AIRg, and SI best explained TIMEnadir (model R2 = 0.26, Table 3, Model C). Subjects with lesser leg fat mass, higher AIRg, and higher SI, had an earlier nadir.
Table 3.
Multiple linear regression results for FFA0, FFAnadir, and TIMEnadir. Model R2 = 0.15, 0.36, and 0.26, respectively.
| Variable | Parameter estimate | SEE | P | Model R2 |
|---|---|---|---|---|
| A. FFA0 | 0.15 | |||
| LTM | -9.64e-3 | 2.58e-3 | <0.001 | |
| Leg fat | 0.012 | 0.004 | 0.005 | |
| Ethnicity | -0.63 | 0.033 | 0.059 | |
| SI | -0.208 | 0.077 | 0.008 | |
| Insulin0 | -0.246 | 0.117 | 0.037 | |
| B. FFAnadir | 0.36 | |||
| FFA0 | 0.133 | 0.019 | <0.001 | |
| Age group | -0.022 | 0.006 | <0.001 | |
| IAAT | 2.37e-4 | 0.89e-4 | 0.009 | |
| C. TIMEnadir | 0.26 | |||
| Leg fat mass | 1.06 | 0.26 | <0.001 | |
| AIRg | -13.70 | 4.34 | 0.002 | |
| SI | -12.30 | 5.84 | 0.037 | |
LTM=lean tissue mass; SI=insulin sensitivity index; insulin0=fasting insulin; FFA0=fasting (basal) FFA; IAAT=intra-abdominal adipose tissue; AIRg=acute insulin response to glucose. Ethnicity coded such that EA=0; AA=1. Age coded such that prepubertal=0; premenopausal=1; postmenopausal=2.
ANCOVA results indicated that the association between FFA0 and age group was P=0.895 (Fig. 2), the association between FFAnadir and age group was P<0.01 (Fig. 3), and the association between TIMEnadir and age group was P=0.435 (Fig. 4).
Fig. 2.
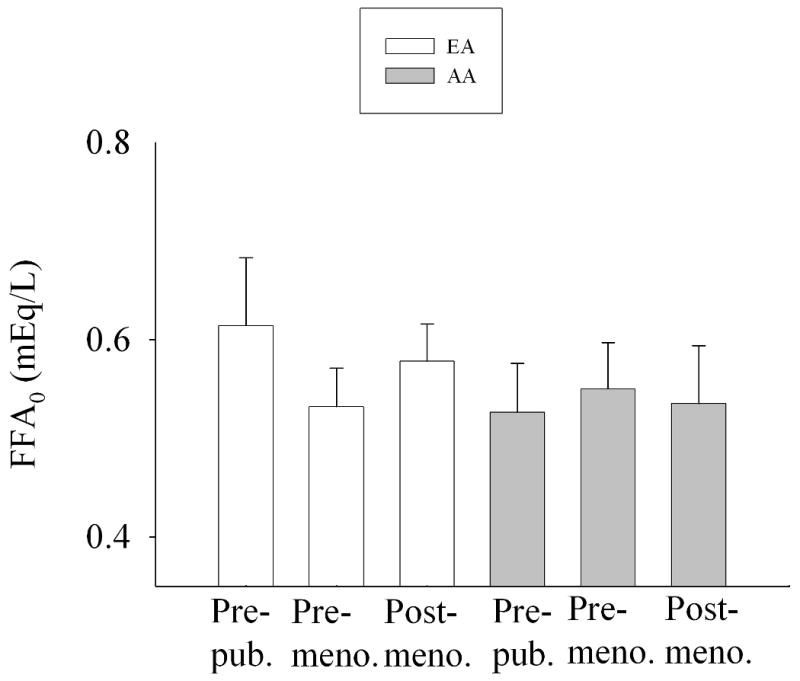
FFA0 by ethnicity and age group, adjusted for LTM and leg fat (adjusted mean +/- SEM). Two-way ANCOVA indicated that neither ethnicity (P=0.307) nor age group (P=0.895) were significant. The (ethnicity × age group) interaction term was not significant (P=0.427).
Fig. 3.
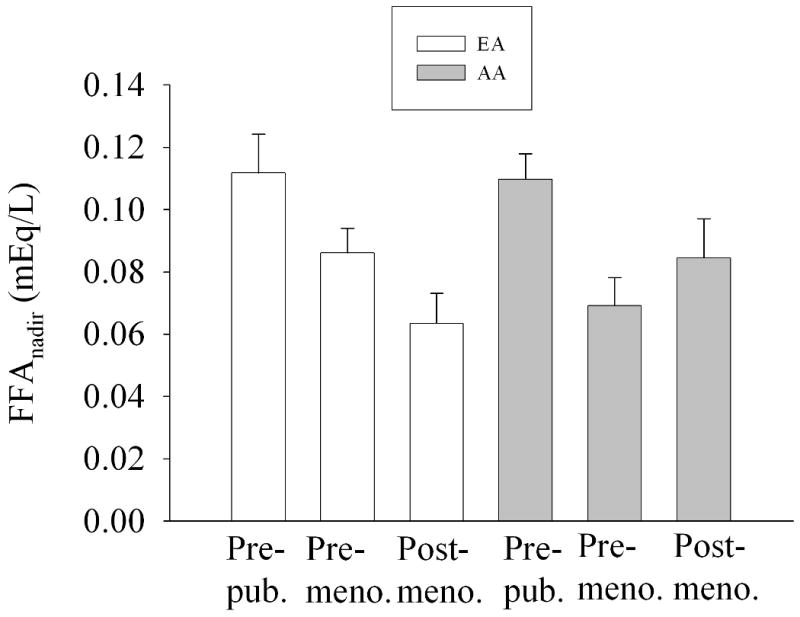
FFAnadir by ethnicity and age group, adjusted for FFA0 and IAAT (adjusted mean +/- SEM). Two-way ANCOVA indicated an effect of age group (P=0.002); ethnicity was not significant (P=0.942). The (ethnicity × age group) interaction term was not significant (P=0.133).
Fig. 4.
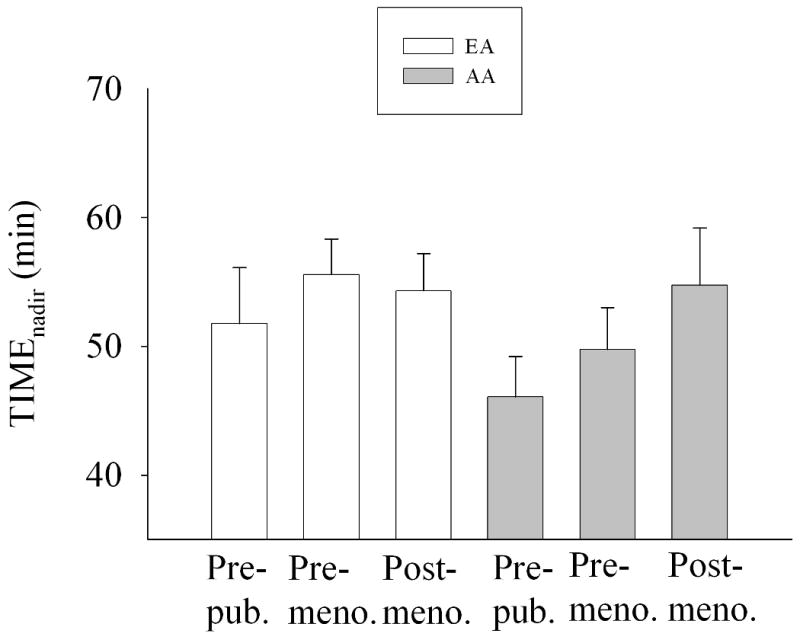
TIMEnadir by ethnicity and age group, adjusted for leg fat mass (adjusted mean +/- SEM). Two-way ANCOVA indicated that neither ethnicity (P=0.191) nor age group (P=0.435) were significant. The (ethnicity × age group) interaction term was not significant (P=0.588).
Discussion
Higher insulin and lower FFA have been reported among AA vs. EA. Whether these processes are mechanistically related is not clear. The present study was conducted in AA and EA children and adults to identify independent effects of ethnicity, age, and insulin on FFA dynamics, and to test the hypothesis that ethnic differences in FFA would not be apparent after accounting for measures of insulin secretion and action. Results indicated that, among healthy females, measures of insulin secretion and action were associated with FFA dynamics, after accounting for body composition. AA tended to have lower FFA0 independent of measures of insulin and body composition.
We found that FFA0 was inversely associated with insulin0 and SI independent of other factors, suggesting a tonic suppression of FFA mobilization by insulin during the fasted state. In the postchallenge state, TIMEnadir was inversely associated with both SI and AIRg. Thus, following a glucose challenge, individuals who have a greater insulin response, and those who are more insulin sensitive, have a more rapid suppression of lipolysis. Although SI from IVGTT is a whole-body insulin sensitivity index that primarily reflects skeletal muscle glucose uptake, it is likely that relatively insulin sensitive individuals also show an enhanced ability of insulin to suppress lipolysis at the level of the adipocyte (9). In fact, a hallmark of insulin resistance is incomplete suppression of lipolysis following meal consumption (10;20). In this study, FFAnadir was not independently associated with any insulin measure, suggesting that other factors predominate in determining the degree to which FFA are suppressed following a glucose challenge. The strong association of FFA0 with FFAnadir suggests that any influence of insulin on FFAnadir acts primarily through determining fasting FFA concentrations.
FFA0 tended to be lower among AA vs. EA, independent of insulin measures, perhaps suggesting an enhanced sensitivity to effects of insulin on fat metabolism, as has been suggested (9;23-26). Within pre-pubertal children, lipolysis, as reflected in the glycerol rate of appearance, was lower in AA vs. EA both during basal (fasted) and clamp conditions, suggesting that AA have enhanced sensitivity to the antilipolytic effect of insulin (23;24). Similarly, among adult women, AA showed lower basal and insulin-suppressed glycerol turnover rates, despite similar SI, suggesting that the lipolytic response to insulin may be greater in AA vs. EA (25). However, fatty acid turnover did not differ, suggesting that ethnic differences in lipolysis are not necessarily reflected in FFA dynamics. Likewise, fatty acid turnover rate following insulin or epinephrine infusion did not differ between ethnic groups in a sample of 9 AA and 8 or 9 EA obese women (26). Taken together, these results suggest that lipolysis is lower among AA vs. EA, but that this difference is not due to higher insulin, and it is not necessarily reflected in lower FFA turnover or concentration. The hypothesis that AA are more sensitive than EA to the anti-lipolytic effect of insulin deserves testing.
In this study, FFA0 was best explained by LTM. This result likely reflects the observation that, among healthy adults, resting energy expenditure (REE) is the single largest determinant of circulating concentrations of FFA (21). REE is determined primarily by muscle and organ mass, which is reflected in the DXA measure of total body LTM. One possible explanation for lower FFA reported among AA relates to energy expenditure. Many studies have shown that AA relative to EA have lower REE (27-30). This difference may be due to a lower amount of fat-free mass in the trunk area, which may reflect metabolically active organ tissue (31). It is likely that FFA are released primarily in response to tissue demand for fuel, which may be chronically lower in the resting condition among AA vs. EA. In this study, FFA0 tended to be lower among AA vs. EA, independent of LTM. However, because AA have lower mass-specific REE than EA, further research is needed to determine if lower FFA0 among AA is due to lower REE.
We hypothesized that a decline in insulin secretion with age (14) would result in a reduction in post-challenge suppression of FFA with age. Our data indicated that AIRg was dramatically lower in older vs. younger subjects (Table 1) independent of SI (Fig. 1), and declined similarly in AA and EA. SI did not differ with age group, suggesting that the lower AIRg was due to an effect of age on either beta-cell response or insulin clearance. Although FFA0 was stable across age groups (Fig. 2), FFAnadir declined with age (Fig. 3). Thus, although AIRg declined with age, this was not reflected in FFAnadir, which declined, rather than increased with age. The reason for lower FFA among adults may be due to the reported age-related decline in the response of adipocytes to lipolytic agents (32). In this study, the later TIMEnadir initially observed in older subjects (Table 1) disappeared after adjusting for leg fat mass (Fig. 4) suggesting that increased adiposity with age delays postprandial FFA suppression by insulin.
We included measures of intra-abdominal and subcutaneous body fat distribution in our analyses to account for potential confounding by differences among ethnic-age groups in body fat distribution. Most circulating FFA in both lean and obese subjects derive from upper-body subcutaneous adipose tissue (reviewed in (10)). Although viscerally obese individuals have greater FFA flux, the FFA derive from SAAT (not IAAT), and the greater flux occurs secondary to insulin resistance. In the present study, IAAT was positively related to FFAnadir, indicating that subjects with greater IAAT had less suppression of FFA following the glucose challenge. In contrast, leg fat mass was positively associated with FFA0 and TIMEnadir, suggesting that lower-body subcutaneous adipose tissue either is a relevant source of FFA, or exerts an influence in some way on FFA metabolism. However in this sample, SAAT and leg fat were closely correlated (r of 0.90), making it difficult to determine which depot may be more relevant.
The physiologic implications of lower fasting FFA among AA are not clear. However, the availability of circulating FFA may affect fat oxidation, which is reported to be lower among AA vs. EA (1;26;33;34), and to be exquisitely sensitive to suppression by insulin (26). As noted earlier, AA also appear to be more sensitive than EA to the antilipolytic effect of insulin (24;25). Taken together, these observations suggest a heightened sensitivity to insulin regulation of FFA metabolism among AA. This hypothesis deserves further study.
Strengths of the study were the relatively large sample size of AA and EA subjects well-matched for age and glucose tolerance status, and the robust assessment of SI and AIRg. Limitations of the study were the relatively small sample size in the groups of EA girls and AA postmenopausal women, and the use of FFA concentrations to reflect lipolysis. Although circulating FFA concentrations provide a qualitative estimate of lipolyis, determination of FFA rate of appearance is necessary to better assess quantitative aspects (35).
In conclusion, in our subject population, insulin0, SI, and AIRg were associated with FFA dynamics. AA relative to EA tended to have lower basal (fasting) FFA after adjusting for body composition, insulin0, and Si. Whether lower FFA0 is associated with substrate oxidation or risk for obesity remains to be determined. The decline in AIRg with age was similar among AA and EA, and was not reflected in FFAnadir, which also declined with age. Further research is needed to determine whether AA are more sensitive than EA to insulin suppression of fatty acid metabolism.
Acknowledgments
This work was supported by NIH grants R01DK58278, M01-RR-00032, P30-DK56336, and P60-DK079626. The authors acknowledge Robert Petri for DXA analysis; Maryellen Williams and Cindy Zeng for laboratory analyses; Tena Hilario-Hailey, Crystal Douglas, and Sidney Barnes for project coordination; Fernando Ovalle for medical supervision, and the staff of the GCRC for nursing care, diet provision, and anthropometric measurements. These data were presented in preliminary version at the annual meeting of NAASO, the Obesity Society (Oct. 20-24, 2007; New Orleans).
Footnotes
Disclosure Statement: The authors have no conflicts of interest to declare.
References
- 1.Arslanian S, Suprasongsin C. Differences in the in vivo insulin secretion and sensitivity of healthy black versus white adolescents. J Pediatr. 1996;129:440–443. doi: 10.1016/s0022-3476(96)70078-1. [DOI] [PubMed] [Google Scholar]
- 2.Arslanian S, Suprasongsin C, Janosky JE. Insulin secretion and sensitivity in black versus white prepubertal healthy children. J Clin Endocrinol Metab. 1997;82:1923–1927. doi: 10.1210/jcem.82.6.4002. [DOI] [PubMed] [Google Scholar]
- 3.Gower BA, Granger WM, Franklin F, Shewchuk RM, Goran MI. Contribution of insulin secretion and clearance to glucose-induced insulin concentration in African-American and Caucasian children. J Clin Endocrinol Metab. 2002;87:2218–2224. doi: 10.1210/jcem.87.5.8498. [DOI] [PubMed] [Google Scholar]
- 4.Haffner SM, D'Agostino R, Jr, Saad MF, et al. Increased insulin resistance and insulin secretion in nondiabetic African-Americans and Hispanics compared with non-Hispanic whites. The Insulin Resistance Atherosclerosis Study. Diabetes. 1996;45:742–748. doi: 10.2337/diab.45.6.742. [DOI] [PubMed] [Google Scholar]
- 5.Gower BA, Goran MI. Immunoreactive insulin, specific insulin, and proinsulin in African-American and Caucasian children. Diabetes. 2000;49(Suppl 1):A297. [Google Scholar]
- 6.Lindquist CH, Gower BA, Goran MI. Role of dietary factors in ethnic differences in early risk of cardiovascular disease and type 2 diabetes. Am J Clin Nutr. 2000;71:725–732. doi: 10.1093/ajcn/71.3.725. [DOI] [PubMed] [Google Scholar]
- 7.Campbell PJ, Carlson MG, Nurjhan N. Fat metabolism in human obesity. American Journal of Physiology. 1994;266:E600–E605. doi: 10.1152/ajpendo.1994.266.4.E600. [DOI] [PubMed] [Google Scholar]
- 8.Sumner AE, Kushner H, Tulenko TN, Falkner B, Marsh JB. The relationship in African-Americans of sex differences in insulin-mediated suppression of nonesterified fatty acids to sex differences in fasting triglyceride levels. Metabolism. 1997;46:400–405. doi: 10.1016/s0026-0495(97)90055-x. [DOI] [PubMed] [Google Scholar]
- 9.Periwal V, Chow CC, Bergman RN, Ricks M, Vega GL, Sumner AE. Evaluation of quantitative models of the effect of insulin on lipolysis and glucose disposal. American Journal of Physiology (Regulatory, Integrative, and Comparative Physiology) 2008;295:R1089–R1096. doi: 10.1152/ajpregu.90426.2008. [DOI] [PMC free article] [PubMed] [Google Scholar]
- 10.Jensen MD. Adipose tissue metabolism - an aspect we should not neglect? Hormone and Metabolic Research. 2007;39:722–725. doi: 10.1055/s-2007-990274. [DOI] [PubMed] [Google Scholar]
- 11.Roust LR, Jensen MD. Postprandial free fatty acid kinetics are abnormal in upper body obesity. Diabetes. 1993;42:1567–1573. doi: 10.2337/diab.42.11.1567. [DOI] [PubMed] [Google Scholar]
- 12.Gower BA, Herd SL, Goran MI. Anti-lipolytic effects of insulin in African American and white prepubertal children. Obesity Res. 2001;9:224–228. doi: 10.1038/oby.2001.25. [DOI] [PubMed] [Google Scholar]
- 13.Gower BA, Higgins PB. Energy balance, body composition, and puberty in children and adolescents: importance of ethnicity. Curr Opin Endocrinol Diabetes. 2003;10:9–22. [Google Scholar]
- 14.Chang AM, Halter JB. Aging and insulin secretion. American Journal of Physiology (Endocrinology and Metabolism) 2003;284:E7–E12. doi: 10.1152/ajpendo.00366.2002. [DOI] [PubMed] [Google Scholar]
- 15.National Center for Health Statistics, Centers for Disease Control and Prevention. Age-adjusted prevalence of diagnosed diabetes by race/ethnicity and sex, United States, 1980-2005. 2005 http://www.cdc.gov/diabetes/statistics/prev/national/figraceethsex.htm.
- 16.Ogden CL, Carroll MD, Curtin LR, McDowell MA, Tabak CJ, Flegal KM. Prevalence of overweight and obesity in the United States, 1999-2004. JAMA. 2006;295:1549–1555. doi: 10.1001/jama.295.13.1549. [DOI] [PubMed] [Google Scholar]
- 17.Gower BA, Ard JD, Hunter GR, Fernandez JR, Ovalle F. Elements of the metabolic syndrome: Association with insulin sensitivity, and effects of ethnicity. Metabolic Syndrome and Related Disorders. 2007;5:77–86. doi: 10.1089/met.2006.0027. [DOI] [PubMed] [Google Scholar]
- 18.American Diabetes Association. Screening for type 2 diabetes. Diabetes Care. 2003;26(suppl 1):S21–S24. doi: 10.2337/diacare.26.2007.s21. [DOI] [PubMed] [Google Scholar]
- 19.Goran M, Kaskoun MC, Shuman WP. Intra-abdominal adipose tissue in young children. Int J Obesity. 1995;19:279–283. [PubMed] [Google Scholar]
- 20.Guo ZK, Hensrud DD, Johnson CM, Jensen MD. Regional postprandial fatty acid metabolism in different obesity phenotypes. Diabetes. 1999;48:1586–1592. doi: 10.2337/diabetes.48.8.1586. [DOI] [PubMed] [Google Scholar]
- 21.Nielsen S, Guo Z, Albu JB, Klein S, O'Brien PC, Jensen MD. Energy expenditure, sex, and endogenous fuel availability in humans. J Clin Invest. 2003;111:981–988. doi: 10.1172/JCI16253. [DOI] [PMC free article] [PubMed] [Google Scholar]
- 22.Bergman RN, Ader M, Huecking K, Van CG. Accurate assessment of beta-cell function: the hyperbolic correction. Diabetes. 2002;51(Suppl 1):S212–S220. doi: 10.2337/diabetes.51.2007.s212. [DOI] [PubMed] [Google Scholar]
- 23.Danadian K, Lewy V, Arslanian SA. Risk of obesity in African-American children: nature or nurture? Diabetes. 1999;48(Supplement 1):A310. [Google Scholar]
- 24.Danadian K, Lewy V, Janosky JE, Arslanian S. Lipolysis in African-American children: is it a metabolic risk factor predisposing to obesity? J Clin Endocrinol Metab. 2001;86:3022–3026. doi: 10.1210/jcem.86.7.7626. [DOI] [PubMed] [Google Scholar]
- 25.Albu JB, Curi M, Shur S, Murphy L, Matthews DE, Pi-Sunyer FX. Systemic resistance to the antilipolytic effect of insulin in black and white women with visceral obesity. American Journal of Physiology (Endocrinology and Metabolism) 1999;277:E551–E560. doi: 10.1152/ajpendo.1999.277.3.E551. [DOI] [PubMed] [Google Scholar]
- 26.Berk ES, Kovera AJ, Boozer CN, Pi-Sunyer FX, Albu JB. Metabolic inflexibility in substrate use is present in African-American but not Caucasian healthy, premenopausal, nondiabetic women. J Clin Endocrinol Metab. 2006;91:4099–4106. doi: 10.1210/jc.2005-2411. [DOI] [PMC free article] [PubMed] [Google Scholar]
- 27.Weinsier RL, Hunter GR, Zuckerman PA, et al. Energy expenditure and free-living physical activity in black and white women: comparison before and after weight loss. Am J Clin Nutr. 2000;71:1138–1146. doi: 10.1093/ajcn/71.5.1138. [DOI] [PubMed] [Google Scholar]
- 28.Albu JB, Shur M, Curi M, Murphy L, Heymsfield SB, Pi-Sunyer FX. Resting metabolic rate in obese, premenopausal black women. Am J Clin Nutr. 1997;66:531–538. doi: 10.1093/ajcn/66.3.531. [DOI] [PubMed] [Google Scholar]
- 29.Yanovski SZ, Reynolds JC, Boyle AJ, Yanovski JA. Resting metabolic rate in African-American and Caucasian girls. Obesity Res. 1997;5:324–325. doi: 10.1002/j.1550-8528.1997.tb00558.x. [DOI] [PubMed] [Google Scholar]
- 30.Weyer C, Snitker S, Bogardus C, Ravussin E. Energy metabolism in African Americans: potential risk factors for obesity. Am J Clin Nutr. 1999;70:13–20. doi: 10.1093/ajcn/70.1.13. [DOI] [PubMed] [Google Scholar]
- 31.Byrne NM, Weinsier RL, Hunter GR, et al. Influence of distribution of lean body mass on resting metabolic rate after weight loss and weight regain: comparison of responses in white and black women. Am J Clin Nutr. 2003;77:1368–1373. doi: 10.1093/ajcn/77.6.1368. [DOI] [PubMed] [Google Scholar]
- 32.Lonnqvist F, Nyberg B, Wahrenberg H, Arner P. Catecholamine-induced lipolysis in adipose tissue of the elderly. J Clin Invest. 1990;85:1614–1621. doi: 10.1172/JCI114612. [DOI] [PMC free article] [PubMed] [Google Scholar]
- 33.Nicklas BJ, Berman DM, Davis DC, Dobrovolny CL, Dennis KE. Racial differences in metabolic predictors of obesity among postmenopausal women. Obesity. 1999;7:463–468. doi: 10.1002/j.1550-8528.1999.tb00434.x. [DOI] [PubMed] [Google Scholar]
- 34.Lee S, Arslanian S. Fat oxidation in black and white youth: a metabolic phenotype potentially predisposing black girls to obesity. J Clin Endocrinol Metab. 2008;93:4547–4551. doi: 10.1210/jc.2008-1024. [DOI] [PMC free article] [PubMed] [Google Scholar]
- 35.Coppack SW, Jensen MD, Miles JM. In vivo regulation of lipolysis in humans. Journal of Lipid Research. 1994;35:177–193. [PubMed] [Google Scholar]