

Abstract
Novel immune-type receptors (NITRs) are encoded by large multi-gene families and share structural and signaling similarities to mammalian natural killer receptors (NKRs). NITRs have been identified in multiple bony fish species, including zebrafish, and may be restricted to this large taxonomic group. Thirty-nine NITR genes that can be classified into 14 families are encoded on zebrafish chromosomes 7 and 14. Herein, we demonstrate the expression of multiple NITR genes in the zebrafish ovary and during embryogenesis. All 14 families of zebrafish NITRs are expressed in hematopoietic kidney, spleen and intestine as are immunoglobulin and T cell antigen receptors. Furthermore, all 14 families of NITRs are shown to be expressed in the lymphocyte lineage, but not in the myeloid lineage, consistent with the hypothesis that NITRs function as NKRs. Sequence analyses of NITR amplicons identify known alleles and reveal additional alleles within the nitr1, nitr2, nitr3, and nitr5 families, reflecting the recent evolution of this gene family.
Electronic supplementary material
The online version of this article (doi:10.1007/s00251-009-0416-5) contains supplementary material, which is available to authorized users.
Keywords: Innate immunity, Lymphocytes, Natural killer receptors
Novel immune-type receptor (NITR) genes have been identified in zebrafish and 14 other bony fish species (Yoder 2009; Ferraresso et al. 2009). Several lines of investigation suggest that their occurrence may be restricted to teleost species. The majority of NITR transcripts encode type I transmembrane proteins. All NITRs possess a single extracellular immunoglobulin (Ig) domain of the variable (V)-type and most possess a second Ig domain of the intermediate (I)-type. NITRs can be classified as: inhibitory, activating and functionally ambiguous based on peptide signaling motifs (Yoder 2009). Bony fish possess cytotoxic NK-like cells (TCRα−β−γ−IgM−) as well as cytotoxic T cells (TCRα+β+IgM−) (Shen et al. 2002) and inhibitory and activating NITRs may play significant roles in the functional regulation of both of these lymphocyte populations (reviewed in Yoder 2009). A phylogenetic comparison of NITR sequences from different fish species demonstrates that these genes are both recently and rapidly evolving (Yoder 2009) Although the fundamental role of NITRs is not known, their specificity for allogeneic determinants, a characteristic of many NK receptors, has been demonstrated (Cannon et al. 2008).
The expression levels of subsets of NITR genes have been described in various tissues in multiple bony fish species and NITR transcripts are detected predominantly in hematopoietic tissues (Strong et al. 1999; Hawke et al. 2001; Yoder et al. 2002; Piyaviriyakul et al. 2007; Evenhuis et al. 2007; Ferraresso et al. 2009). The majority of NITR transcripts are between 1.4 to 2.0 kB as detected by RNA blot analyses. NITR expression in spleen, kidney and intestine is more abundant than in muscle and liver (Strong et al. 1999; Hawke et al. 2001; Yoder et al. 2002; Evenhuis et al. 2007; Ferraresso et al. 2009). NITRs also are expressed in circulating leukocytes of trout and sea bass (Yoder et al. 2002; Ferraresso et al. 2009) as well as in gills of Japanese flounder and sea bass (Piyaviriyakul et al. 2007; Ferraresso et al. 2009) and on TCRα+ and IgM+ lymphocytes in Japanese flounder (Piyaviriyakul et al. 2007). RT-PCR analyses reveal that several different classes of NITRs are expressed at different levels in different tissues (Strong et al. 1999; Hawke et al. 2001; Yoder et al. 2002; Piyaviriyakul et al. 2007; Ferraresso et al. 2009). Furthermore, expression of NITR transcripts has been detected by RNA blot and RT-PCR analyses in various clonal NK-like, T, B, and macrophage cell lines of channel catfish (Hawke et al. 2001; Evenhuis et al. 2007). Certain NITRs in catfish appear to be expressed nearly ubiquitously in the various hematopoietic cell lines whereas expression of other catfish NITRs is more restricted (Evenhuis et al. 2007).
Thirty-six zebrafish NITR genes representing 12 families of NITRs have been identified from the zebrafish genome in a single gene cluster on chromosome 7 (Yoder et al. 2004). Three additional NITR genes, defining two additional families, are encoded in a gene cluster on zebrafish chromosome 14 (Yoder et al. 2008). Neither the tissue distribution nor expression of the different NITR families has been examined in a comprehensive manner. We describe herein the expression patterns of 14 different NITR families in zebrafish embryos, tissues and leukocytes.
In order to detect all possible NITR transcripts, including described polymorphisms and alleles, a panel of primers was developed for detecting NITR transcripts by RT-PCR. For example, three degenerate primer pairs were used to detect the 14 member genes of the nitr1 family (Fig. 1 and Table 1). As observed previously in other bony fish species, all zebrafish NITRs are expressed in the kidney, spleen and intestine; a few NITR transcripts are expressed at lower levels in the liver (Fig. 2). Notably, transcripts of the nitr1, nitr3, nitr6, nitr7, nitr9, nitr10, nitr12, and nitr14 families were detected in the ovary. However, only maternal transcripts of nitr3, nitr7, and nitr9 were detected in the 1-cell embryo (0-h post-fertilization) and only nitr3 was expressed throughout embryogenesis. Efforts to further characterize nitr3 expression during embryogenesis using whole mount RNA in situ hybridization were unsuccessful (Cannon, Litman and Yoder, data not shown; Thisse and Thisse 2004). These observations are not surprising based on relative levels of expression seen here and noted in previous efforts to recover nitr3 cDNAs in library screening. The role of the maternal and embryonic NITR transcripts is unknown but of considerable interest.
Fig. 1.
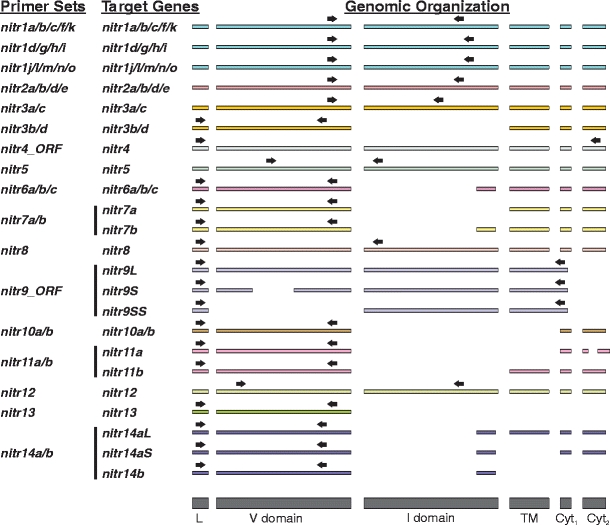
Overview of oligonucleotide primer design for reverse-transcriptase polymerase chain reaction (RT-PCR). Primer sets are listed on the left. Genes targeted by each primer set and the overall genomic organization of these genes are listed to the right of each primer set. Families of NITRs are defined by number (e.g., nitr1). Individual genes within a family are identified with the addition of a lowercase letter (e.g., nitr1a). Alternatively spliced isoforms are identified with uppercase letters L, S, and SS for long, short, and super-short, respectively (e.g., nitr9L). Colored rectangles represent exons and black arrows approximate the relative location of each primer. The peptide domains associated with each exon are shown at the bottom as gray rectangles (L peptide leader sequence, V variable domain, I intermediate domain, TM transmembrane domain, Cyt 1 and Cyt 2 cytoplasmic regions). Primer sequences are listed in Table 1
Table 1.
Primer sequences and cycling parameters for PCR
| Primer sets | Forward primer | Annealing Temp (°C) | Extension time (s) | No. of cycles (Fig. 2) | No. of cycles (Fig. 3) | Amplicon length (bp) |
|---|---|---|---|---|---|---|
| Reverse primer | ||||||
| nitr1a/b/c/f/k | AAGACAAAGYCTTYAGACTCTGC | 65 | 30 | 40 | 40 | 345 |
| GTTGTTCTTGTGGAGACTGTAGA | ||||||
| nitr1d/g/h/i | TCAGACTCTGCAACATATTACTGTG | 65 | 30 | 40 | 40 | 367/370 |
| ACAGCACAGTAGTAAATGCCAG | ||||||
| nitr1j/l/m/n/o | GGTTATTTTAATCTRACCATTTTAAA | 60 | 30 | 40 | 40 | 389/392/395 |
| TAAATGCCAGWATCAGAGCSACTGA | ||||||
| nitr2a/b/d/e | GATGAWGKYAGTTTTAATCTGAGCATC | 65 | 30 | 40 | 40 | 346 |
| GCAGGCTGTAGATGCATTTGTGTGCAG | ||||||
| nitr3a/c | GARGAWTTTGCAAMYTAYTATTG | TD65–55a | 30 | 40 | 50 | 274 |
| CGCTCCGGTTATCATGAGTGTAA | ||||||
| nitr3b/d | ATGAGCTTRCAARRTTGTTTTACC | 55 | 30 | 40 | 40 | 378 |
| TTCTCCAAACATCATGATGTTCAG | ||||||
| nitr4_ORF b | ATGAATCACATCATCTACGTGATCATC | 65 | 60 | 40 | 40 | 957/1,014 |
| TCATCTTGCAGCATTGGTCTGTGTTGG | ||||||
| nitr5 | GAAGAGCCACGTCTCATTGCTTCC | 70 | 30 | 35 | 35 | 354 |
| ATGACTGAACCAGTAGAGACGATG | ||||||
| nitr6a/b/c | TTGGKTYATTTTGATGTGTTKGGC | 58 | 30 | 40 | 40 | 284 |
| TKATGTTGAGGTGAAAAGAGTCTT | ||||||
| nitr7a/b | TCTGGACTACAYCCGCTGATGCTC | 70 | 30 | 35 | 35 | 262/301/304 |
| CATCCACGCTGATAATCCTCAGTG | ||||||
| nitr8 | CAACATGAGCACAGYTTTATTCCTC | 65 | 30 | 35 | 40 | 486 |
| TTCTTATCTTCCCTCYGAACTCTAC | ||||||
| nitr9_ORF b | ATGATCAACTTTTGGATTTTTGGACTTTTC | 65 | 60 | 40 | 40 | 606/858/951 |
| TTACTGCTGGTTAGAAACCGAGTTAATCAT | ||||||
| nitr10a/b | GCAGCTTTATTGCTCTTTG | 65 | 30 | 40 | 40 | 323 |
| CCACAAAAGTAGAAGCCAG | ||||||
| nitr11a/b | GYGTKTAKTAATYTCAGCGCTGTTGATG | 65 | 30 | 35 | 40 | 348/351 |
| ATTTTCCAAGAGYMCCAACCACAGAAG | ||||||
| nitr12 | GCAAACCCTTGGAGAAGCTCCAAC | 65 | 30 | 40 | 40 | 502 |
| GGGCAGATTGTAGATACAGGACTGC | ||||||
| nitr13 | GGATTTCTCTCATGCTTCTATGCAGG | 70 | 30 | 40 | 50 | 328 |
| CAGCCACAGTAATATGTTGCYTCATC | ||||||
| nitr14a/b | ATGATTCTCTGGGCATTTGTTACTG | 60 | 30 | 40 | 40 | 326 |
| GATGCACAATAGTACACTGCTTCATC | ||||||
| LC1 | GAAGATGCTGGAGATTATTACTGT | 65 | 30 | 40 | N.A. | ∼433 |
| ACTCTGAACACTGCTGTCTCC | ||||||
| LC3 | GAAGATGCTGGAGATTATTACTGT | 65 | 30 | 40 | N.A. | ∼405 |
| ACACACAGATCAGCACTTG | ||||||
| TCRα | GCNSTNTAYTAYTGYGC | TD65–55a | 30 | 45 | 45 | ∼339 |
| ATGCCCAGTGACAAGAAG | ||||||
| mpx | CCAGAACCAGTGAGCCTGAGACACG | 70 | 30 | N.A. | 25 | 639 |
| CAGTCTAACCATGGGCAGCGCTGCAC | ||||||
| β-actin | GGTATGGAATCTTGCGGTATCCAC | 65 | 30 | 25 | 25 | 301 |
| ATGGGCCAGACTCATCGTACTCCT |
aTouch-down PCR during which the annealing temperature is lowered from 65°C to 55°C by 0.5°C per cycle for 20 cycles and then an additional 20, 25, or 30 cycles are completed with a 55°C annealing temperature
bSequences corresponding to translational start and stop codons are underlined
Fig. 2.
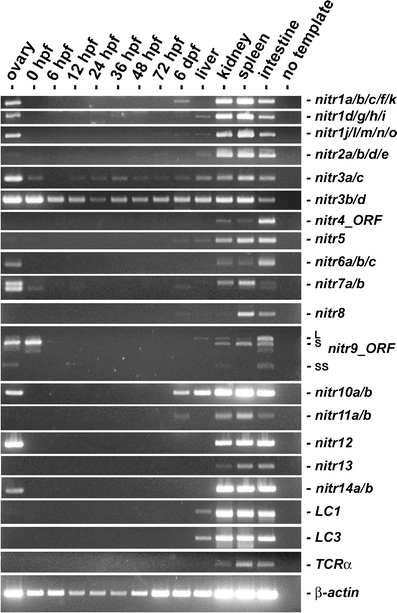
RT-PCR analyses of NITR gene expression from zebrafish ovaries, embryos, and adult tissues. Zebrafish (AB strain) embryos were collected by natural mating and maintained at 28°C as described (Westerfield 2000). Total RNA (2 μg) from pooled embryos at various developmental stages (hours post-fertilization (hpf) or days post fertilization (dpf)) and dissected tissues (pooled from multiple animals) was reverse transcribed (SuperScript™ II Reverse Transcriptase: Invitrogen; Carlsbad, CA) and subjected to thermal cycling with gene-specific primers (Table 1 and Fig. 1) and TITANIUM™ Taq DNA polymerase (Clontech). Primers that amplify the entire open reading frame were utilized for nitr4 and nitr9: note that three mRNA splice variants of nitr9, (Wei et al. 2007) are detected in the kidney and intestine. RT-PCR of immunoglobulin light chains (LC1 and LC3), T cell receptor α (TCR-α) and β-actin are included for reference. TCR-α primers were designed to amplify sequences between the variable (V) and constant (C) domains and thus only detect transcripts, which reflect somatic recombination. The degenerate TCR-α forward primers were designed to detect all V domain sequences encoding the conserved motif: A(V/L)YYCA. Limited RNA blot analyses with polyA+ mRNA from intestine, kidney and spleen, detected transcripts between 1.4–2.0 Kb for the zebrafish nitr1–nitr7 families (unpublished observations)
The expression of NITR genes in zebrafish lymphoid and myeloid cell populations was characterized by RT-PCR (Fig. 3). Expression of the 14 different NITR gene families was detected in the lymphocyte population, but not in the myeloid population. This expression pattern is consistent with the hypothesis that NITRs are expressed and function in cytotoxic NK-like and T cells in bony fish (Yoder 2009); however, expression of a single flounder NITR and a single catfish NITR have been reported in B cells (Piyaviriyakul et al. 2007; Evenhuis et al. 2007). Although the expression of certain catfish NITRs in a macrophage cell line (Evenhuis et al. 2007) may be a derived feature of catfish, it may be that some zebrafish NITRs are expressed in myeloid cells, but at a level too low for detection by our assay.
Fig. 3.
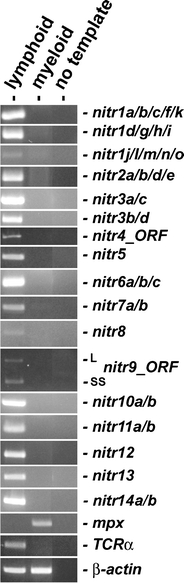
RT-PCR analyses of NITR gene expression from different leukocyte populations. Lymphoid and myeloid cell populations were purified from the kidney of multiple zebrafish and pooled as described (Yoder et al. 2007). RT-PCR was performed as described in Fig. 2, except 1 μg of total RNA was used in the reverse transcription reaction. RT-PCR of myeloperoxidase (mpx) provides a positive control for myeloid cells and TCR-α provides a positive control for T lymphocytes. β-actin is shown as a standard reference. Primer sequences and thermal cycling parameters are listed in Table 1
In order to confirm the identity of the NITR amplicons (Figs. 2 and 3) at least one amplicon was sequenced and confirmed to be the predicted gene (data not shown). In an effort to evaluate the ability of the degenerate primers to amplify multiple genes and alleles, multiple nitr1a/b/c/f/k, nitr1d/g/h/I, nitr2a/b/d/e, and nitr3b/d amplicons were sequenced from various cDNA sources. The peptide sequences encoded by these amplicons is provided in Supplemental Fig. 1 and summarized in Fig. 4. Of the 44 nitr1a/b/c/f/k amplicons sequenced from five different cDNA sources, 27 different alleles were identified (different alleles defined as encoding different peptide sequences) including 14 new alleles. Similar results were observed for nitr1d/g/h/I, nitr2a/b/d/e, and nitr3b/d amplicons. In the course of developing rational priming strategies for the nitr1, nitr2, and nitr3 multi-gene families, we had the occasion to examine the allelic variation of nitr5, which represents a single copy gene. Of the 27 nitr5 amplicons sequenced from four different cDNA sources, seven new nitr5 alleles were identified (Supplemental Fig. 1 and Fig. 4). These data further document the polymorphic nature of the NITR gene cluster (Yoder et al. 2004; Yoder 2009) and support a recent and rapid evolution of the NITR gene family.
Fig. 4.
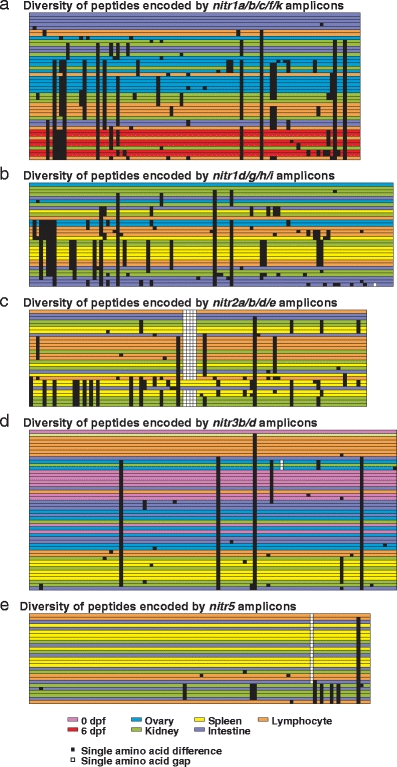
Summary of variation detected from sequenced a nitr1a/b/c/f/k, b nitr1d/g/h/i, c nitr2a/b/d/e, d nitr3b/d, and e nitr5 amplicons. Figures are derived from ClustalW alignments of peptides encoded by amplicons (Supplemental Fig. 1). Each row represents a single peptide sequence and is color-coded based on cDNA source, with the top row serving as an arbitrary reference (0 dpf = pink; 6 dpf = red; ovary = blue; kidney = green; spleen = yellow; intestine = violet; lymphocyte = orange). Amino acid positions that differ from the reference sequence are represented as black squares. Gaps in amino acid sequence are represented by white squares
The work described herein documents that zebrafish NITRs are expressed in the spleen, kidney and intestine; some NITR genes are expressed less abundantly in the liver. The expression of all NITR genes in the lymphoid lineage supports their role as NKRs, as does their high degree of allelic variation (e.g., nitr1, nitr2, nitr3, and nitr5). As a large diversified multigene family, zebrafish NITRs exhibit differential, variable expression in the ovary and during embryogenesis. The nitr3 family is unique in that it is expressed throughout development and suggests that certain NITRs may exhibit alternative functions outside of the leukocyte lineage and their likely primary role as NKRs.
Electronic supplementary material
Below is the link to the electronic supplementary material.
Peptide sequences encoded by NITR amplicons detected from various zebrafish tissues (Figs. 2 and 3). Sequences were aligned by ClustalW. Identical residues are highlighted in black, similar residues are highlighted in gray and gaps are indictaed by a dash (-). Sequence identity numbers (ID) are shown on the left and are color coded to the tissue source (bottom). BLAST searches identified known alleles for certain NITR sequences which are indicated on the right: sequences without a listed allele are considered new alleles. The peptide domains are shown at the top of the alignments (Leader sequence; V, variable domain; I, intermediate domain; J, joining-like domain.) Primers used to generate amplicons are described in Table 1 and Fig. 1. Sequences have been deposited in Genbank with accession numbers GU193985–GU194163 (PDF 47 kb)
Acknowledgements
We thank Diana Skapura, Timothy Orcutt, and Amanda Grant for assistance with zebrafish husbandry and embryo collection, Bob Haire for zebrafish light chain primers and Barb Pryor for editorial assistance. Sequences described in this report have been deposited in Genbank with accession numbers GU193985-GU194163. This work was supported by grants from the National Science Foundation (MCB-0505585 to JAY) and the National Institutes of Health (R01 AI057559 to GWL).
Open Access
This article is distributed under the terms of the Creative Commons Attribution Noncommercial License which permits any noncommercial use, distribution, and reproduction in any medium, provided the original author(s) and source are credited.
References
- Cannon JP, Haire RN, Magis AT, Eason DD, Winfrey KN, Hernandez Prada JA, Bailey KM, Jakoncic J, Litman GW, Ostrov DA. A bony fish immune receptor of the NITR multigene family mediates allogeneic recognition. Immunity. 2008;29:228–237. doi: 10.1016/j.immuni.2008.05.018. [DOI] [PMC free article] [PubMed] [Google Scholar]
- Evenhuis J, Bengten E, Snell C, Quiniou SM, Miller NW, Wilson M. Characterization of additional novel immune type receptors in channel catfish, Ictalurus punctatus. Immunogenetics. 2007;59:661–671. doi: 10.1007/s00251-007-0230-x. [DOI] [PubMed] [Google Scholar]
- Ferraresso S, Kuhl H, Milan M, Ritchie DW, Secombes CJ, Reinhardt R, Bargelloni L (2009) Identification and characterisation of a novel immune-type receptor (NITR) gene cluster in the European sea bass, Dicentrarchus labrax, reveals recurrent gene expansion and diversification by positive selection. Immunogenetics. doi:10.1007/s00251-009-0398-3 [DOI] [PMC free article] [PubMed]
- Hawke NA, Yoder JA, Haire RN, Mueller MG, Litman RT, Miracle AL, Stuge T, Shen L, Miller N, Litman GW. Extraordinary variation in a diversified family of immune-type receptor genes. Proc Natl Acad Sci U S A. 2001;98:13832–13837. doi: 10.1073/pnas.231418598. [DOI] [PMC free article] [PubMed] [Google Scholar]
- Piyaviriyakul P, Kondo H, Hirono I, Aoki T. A novel immune-type receptor of Japanese flounder (Paralichthys olivaceus) is expressed in both T and B lymphocytes. Fish Shellfish Immunol. 2007;22:467–476. doi: 10.1016/j.fsi.2006.05.007. [DOI] [PubMed] [Google Scholar]
- Shen L, Stuge TB, Zhou H, Khayat M, Barker KS, Quiniou SMA, Wilson M, Bengten E, Chinchar VG, Clem LW, Miller NW. Channel catfish cytotoxic cells: a mini-review. Dev Comp Immunol. 2002;26:141–149. doi: 10.1016/S0145-305X(01)00056-8. [DOI] [PubMed] [Google Scholar]
- Strong SJ, Mueller MG, Litman RT, Hawke NA, Haire RN, Miracle AL, Rast JP, Amemiya CT, Litman GW. A novel multigene family encodes diversified variable regions. Proc Natl Acad Sci U S A. 1999;96:15080–15085. doi: 10.1073/pnas.96.26.15080. [DOI] [PMC free article] [PubMed] [Google Scholar]
- Thisse B, Thisse C (2004) Fast release clones: a high throughput expression analysis. ZFIN Direct Data Submission (http://zfin.org)
- Wei S, Zhuo J-M, Chen X, Shah R, Liu J, Orcutt TM, Traver D, Djeu JY, Litman GW, Yoder JA. The zebrafish activating immune receptor Nitr9 signals via Dap12. Immunogenetics. 2007;59:813–821. doi: 10.1007/s00251-007-0250-6. [DOI] [PMC free article] [PubMed] [Google Scholar]
- Westerfield M. The zebrafish book. Guide for the laboratory use of zebrafish (Danio rerio) Eugene: University of Oregon Press; 2000. [Google Scholar]
- Yoder JA. Form, function and phylogenetics of NITRs in bony fish. Dev Comp Immunol. 2009;33:135–144. doi: 10.1016/j.dci.2008.09.004. [DOI] [PubMed] [Google Scholar]
- Yoder JA, Mueller MG, Nichols KM, Ristow SS, Thorgaard GH, Ota T, Litman GW. Cloning novel immune-type inhibitory receptors from the rainbow trout, Oncorhynchus mykiss. Immunogenetics. 2002;54:662–670. doi: 10.1007/s00251-002-0511-3. [DOI] [PubMed] [Google Scholar]
- Yoder JA, Litman RT, Mueller MG, Desai S, Dobrinski KP, Montgomery JS, Buzzeo MP, Ota T, Amemiya CT, Trede NS, Wei S, Djeu JY, Humphray S, Jekosch K, Hernandez Prada JA, Ostrov DA, Litman GW. Resolution of the novel immune-type receptor gene cluster in zebrafish. Proc Natl Acad Sci U S A. 2004;101:15706–15711. doi: 10.1073/pnas.0405242101. [DOI] [PMC free article] [PubMed] [Google Scholar]
- Yoder JA, Orcutt TM, Traver D, Litman GW. Structural characteristics of zebrafish orthologs of adaptor molecules that associate with transmembrane immune receptors. Gene. 2007;401:154–164. doi: 10.1016/j.gene.2007.07.014. [DOI] [PMC free article] [PubMed] [Google Scholar]
- Yoder JA, Cannon JP, Litman RT, Murphy C, Freeman JL, Litman GW. Evidence for a transposition event in a second NITR gene cluster in zebrafish. Immunogenetics. 2008;60:257–265. doi: 10.1007/s00251-008-0285-3. [DOI] [PMC free article] [PubMed] [Google Scholar]
Associated Data
This section collects any data citations, data availability statements, or supplementary materials included in this article.
Supplementary Materials
Peptide sequences encoded by NITR amplicons detected from various zebrafish tissues (Figs. 2 and 3). Sequences were aligned by ClustalW. Identical residues are highlighted in black, similar residues are highlighted in gray and gaps are indictaed by a dash (-). Sequence identity numbers (ID) are shown on the left and are color coded to the tissue source (bottom). BLAST searches identified known alleles for certain NITR sequences which are indicated on the right: sequences without a listed allele are considered new alleles. The peptide domains are shown at the top of the alignments (Leader sequence; V, variable domain; I, intermediate domain; J, joining-like domain.) Primers used to generate amplicons are described in Table 1 and Fig. 1. Sequences have been deposited in Genbank with accession numbers GU193985–GU194163 (PDF 47 kb)