Abstract
We investigated a model for the neural integrator based on hysteretic units connected by positive feedback. Hysteresis is assumed to emerge from the intrinsic properties of the cells. We consider the recurrent networks containing either bistable or multistable neurons. We apply our analysis to the oculomotor velocity-to-position neural integrator that calculates eye positions using the inputs that carry information about eye angular velocity. By analyzing this system in the parameter space we show the following. The direction of hysteresis in the neuronal response may be reversed for the system with recurrent connections compared to the case of unconnected neurons. Thus, for the NMDA receptor based bistability the firing rates after ON saccades may be higher than after OFF saccades for the same eye position. The reversal of hysteresis occurs in this model only when the size of hysteresis differs from neuron to neuron. We also relate the macroscopic leak time-constant of the integrator to the rate of microscopic spontaneous noise-driven transitions in the hysteretic units. Finally, we investigate the conditions under which the hysteretic integrator may have no threshold for integration.
Introduction
Persistent neuronal firing is a likely correlate of short-term memory (Fuster, 1995; Goldman-Rakic, 1995). In some cases the variables stored in memory are continuous in nature (Romo et al., 1999). Examples of such quantities include continuous sensory inputs (Romo et al., 1999; Miller et al., 2003; Machens et al., 2005), tension of a muscle, or variables representing accumulated sensory evidence (Shadlen and Newsome, 2001; Mazurek et al., 2003). The continuously varying parameters are encoded in neuronal firing, which has a graded set of values. The components of the nervous system that encode the graded values of parameters are called parametric memory systems (Romo et al., 1999; Miller et al., 2003; Machens et al., 2005).
Perhaps the best-studied system of this type is the oculomotor neural integrator (Robinson, 1974, 1989; Fukushima and Kaneko, 1995; Major and Tank, 2004). Graded persistent activity in this system represents continuously varying eye position, which depends on the prior inputs carrying information about eye angular velocity. Since the transformation from velocity to position involves temporal integration, this system is also sometimes called velocity-to-position neural integrator (VPNI). The graded persistent activity in VPNI is likely to be maintained by positive feedback (Rosen, 1972; Robinson, 1989; Seung et al., 2000a; Major and Tank, 2004). The presence of positive feedback poses a problem of robustness (Robinson, 1989; Aksay et al., 2001). This is because mistuning of the feedback leads to instabilities, which are hard to avoid in realistic systems. Previous researchers proposed that robustness with respect to parameter mistuning could stem from hysteresis in the neuronal responses (Koulakov et al., 2002; Goldman et al., 2003). In this approach the robustness is similar to the stability of digital electronic systems to mistuning of parameters and noise. A similar argument has been made for robustness of persistent activity with respect to distracters and noise (Camperi and Wang, 1998).
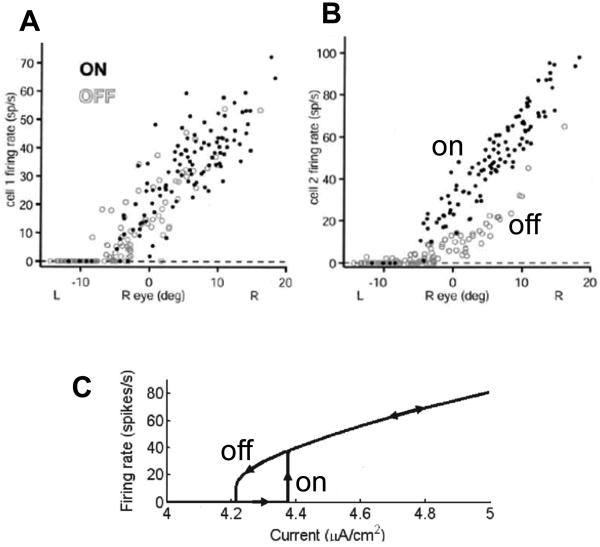
A recent study in the goldfish oculomotor integrator (Aksay et al., 2003) has tested the history dependence in the responses of VPNI neurons. This study makes the following observations. First, the firing rate of a single neuron as a function of eye position exhibits hysteresis (Figure 1B). Second, the firing rates during fixations are typically higher after the ON saccades than after the OFF saccades (Figure 1B, by ON or OFF saccades it is customary to understand the eye movements in the direction of increasing or decreasing firing rates of neurons). This finding implies that the hysteresis has an inverted direction compared to a typical positive feedback system, such as that due to nonlinear conductance of the NMDA receptor current shown in Figure 1C (Wang, 1999; Koulakov et al., 2002). Third, the firing rate of one cell versus the other also displays history dependence. Fourth, the hysteresis width varies from cell to cell, with some cells showing no statistically substantial history dependence (Figure 1A).
Figure 1.
Although responses of some goldfish medulla area I neurons display little or no hysteresis (A), other neurons are clearly hysteretic (B) (Aksay et al., 2003). For the hysteretic responses the firing rates after ON saccades are above those after the OFF saccades. Here and throughout the paper the ON/OFF saccades are defined as abrupt eye movements in the direction of increasing/decreasing firing rate of the neuron. (C) Firing rate as a function of input current for a model neuron. The hysteretic response in the neuron has origins in the non-linearity of NMDA receptor conductance [adopted from (Koulakov et al., 2002)]. The ON response is below the OFF response in contrast to experiments in (B). The discrepancy between (B) and (C) will be explained below in this paper.
Our present study addresses these experimental observations. We developed a simple model for VPNI that can be solved exactly without the use of a computer. We considered two related versions of this model, involving bistable and multistable neurons. The bistability is attributed to the bistable compartments within a single neuron (Lisman et al., 1998; Koulakov et al., 2002), while the multistability is formed by many bistable dendritic compartments. Although the specific mechanism is proposed, the properties of neurons in this model could be understood phenomenologically, and could be generated by many intracellular or network mechanisms. We also present the results for a more biologically plausible computational model, which are consistent with the simpler model.
The main results of our study are as follows. First, we show that if the neurons in the absence of recurrent connections have hysteresis of regular sign (counterclockwise) (Lisman et al., 1998; Koulakov et al., 2002), adding global recurrent feedback produces the reversed hysteresis (clockwise) that is consistent with the higher firing rates seen after the ON saccades as described above. Thus, the direction of hysteresis observed experimentally could be attributed to the global recurrent connections between cells. Second, the phenomenon of the reversal of the sign of hysteresis occurs only if different neurons have different widths of hysteresis. Thus the experimental observation number two, that the firing rates are higher after the ON saccades, may follow from observation number four, that the hysteresis width varies from cell to cell. Finally, we studied the temporal properties of VPNI using a kinetic equation formulated in the parameter space of the system. We show that the rate of integration is controlled by the synaptic time constant τs, which, in the case of the NMDA receptor is about 0.1 sec. On the other hand, the integrator leak time constant τleak is determined by the rate of spontaneous transitions in the bistable neurons denoted here τh. The expression for the integrator leak is of the form
| (1) |
The parameter ε <<1 defines the precision with which the integrator is tuned. This expression is valid for small values of tuning parameter ε as discussed below in Section 5. For the VPNI without hysteresis, the leak is given by the same expression with τh replaced by τs (Robinson, 1989; Seung et al., 2000a). Because the time-constant of spontaneous transitions τh is usually much larger than the synaptic time-constant τs ~ 0.1sec (Bialek, 2000; Koulakov, 2001), the use of hysteretic neurons allows stabilization of the integrator at a much larger value of the precision of tuning ε, which provides another argument for the robustness of the hysteretic system.
Computational Model
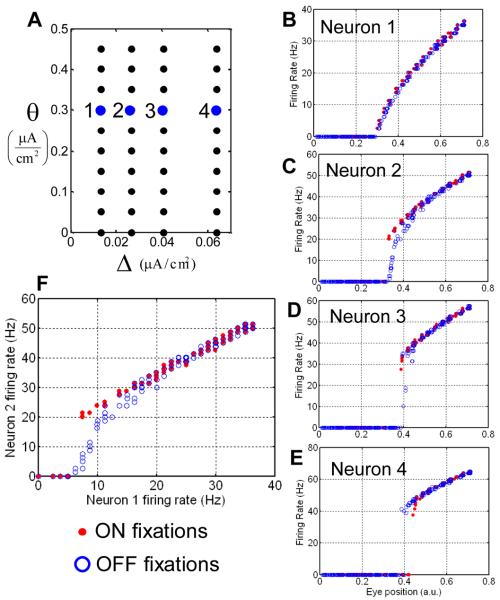
The network model that we used in the computational part of this study is similar to the previously described NMDA-based models (Lisman et al., 1998; Koulakov et al., 2002). The network included 40 two-compartmental neurons. Each neuron contained the somatic and dendritic compartments. The somatic compartment included sodium and potassium currents making it capable of generating action potentials. The dendritic compartments received feedforward NMDA current, feedback NMDA current, and an offset current needed to distribute the thresholds for activation. The NMDA-based bistability was produced by the feedforward NMDA currents into the dendritic compartments. This current was due to feedforward inputs from 100 neurons discharging at 30Hz. The NMDA conductance for feedforward inputs was equal to 0.7, 1, 1.1, and 1.2 mS/cm2 for neurons from groups 1 through 4 in Figure 11A. Different values of NMDA conductance in these neurons resulted in differing hysteresis. These four groups of neurons also received feedforward input currents of 1.98, 1.20, 0.93, and 0.68 μA/cm2 to equate their mean thresholds for activation (parameter θ) as shown in Figure 11A. To produce a difference in the mean thresholds, another offset current was added to the quadruples of neurons. Each quadruple was separated by 0.05 μA/cm2 (Figure 11A) in θ-space from its nearest neighbor. The offset feedforward current needed to satisfy these assumptions could be of AMPA origin. However, no specific implementation for the synaptic current was introduced into the model to simplify the numeric algorithm. The feedback connections between neurons contained NMDA conductance of 4μS/cm2. For the surface area of the dendrite of about 1.2·105μm2 estimated from images obtained in (Aksay et al., 2000) and the single-channel NMDA conductance of 50pS (Lin et al., 2004), the value of NMDA conductance given above yields about 100 NMDA channels per recurrent connection. Since there are 40 recurrent connections per cell we estimate about 4·103 NMDA channels per neuron localized in the recurrent synapses. For simplicity our model did not include AMPA current in the recurrent synapses. The effects of possible presence of AMPA currents in the recurrent synapses are discussed in the online supplement 1. The somatic, dendritic capacitances and leak current (both somatic and dendritic) were taken to be 1μF/cm2, 0.5μF/cm2, and 0.1 mS/cm2 respectively (Lisman et al., 1998; Koulakov et al., 2002). The details of the numerical implementation of our model are described in the Supplementary material 3.
Figure 11.
Reversal of hysteresis in the network of Hodgkin-Huxley neurons. (A) The arrangement of 40 neurons in the parameter space of hysteresis positions and half-widths. (B-E) The firing rate traces for four example neurons indicated in (A). The red/blue markers display values obtained after ON/OFF saccades. (B) for some neurons the observed hysteresis is small, similarly to some experimental observations (Figure 1A). (C and D) For neurons 2 and 3 the red dependence is above the blue one. These neurons belong to groups G1 or G2 defined in Figure 9 and display reversed hysteresis (compare to Figure 1B) (E) Neuron 4 belongs to G4. (F) Firing rate of one neuron versus the other [(B) versus (A)] displays hysteresis, as observed experimentally (Aksay et al., 2003).
Results
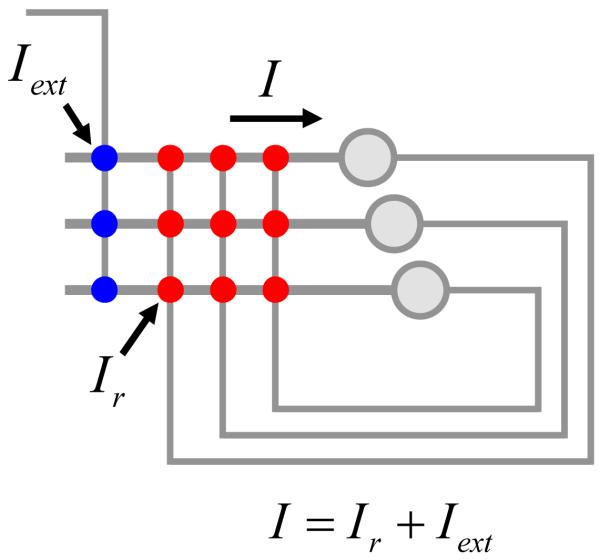
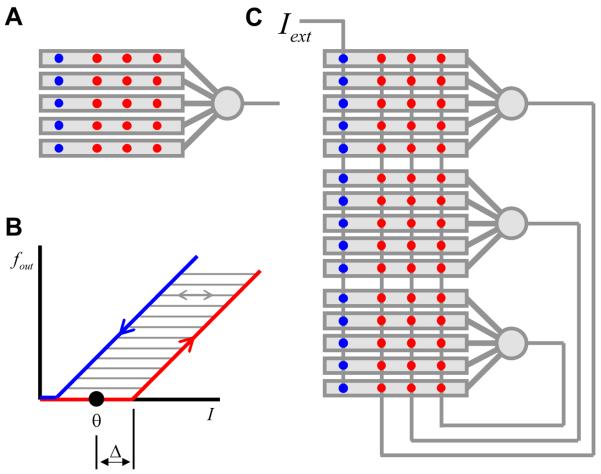
Our model for the neural integrator is based on recurrent positive feedback (Rosen, 1972; Robinson, 1989; Seung et al., 2000a; Koulakov et al., 2002; Goldman et al., 2003). First we present the results obtained for a simplified model, which can be solved exactly without the use of a computer. To make the exact solution possible some assumptions have to be made about the recurrent network connectivity. One of the assumptions that we will make throughout this study is that the neurons are connected in the all-to-all fashion with equal weights (Figure 2). In this case all neurons receive the same input current, which greatly simplifies the analysis. This assumption about network connectivity is in contrast to the one made by (Goldman et al., 2003), who considered feedback connectivity targeting specific dendritic compartments.
Figure 2.
The recurrent feedback model, which is thought to underlie the neural integrator. Recurrent synapses, external synapses, and somata are shown by red, blue, and gray circles respectively. In the fully-connected network considered here, all the neurons receive the same input (I). The input is a sum of external and recurrent currents (Iext and Ir respectively).
1. Bistable neurons
1.1 The case of no recurrent feedback
In this subsection we consider the properties of integrator neurons without recurrent connections. The recurrent connections are included in the subsection 1.2.
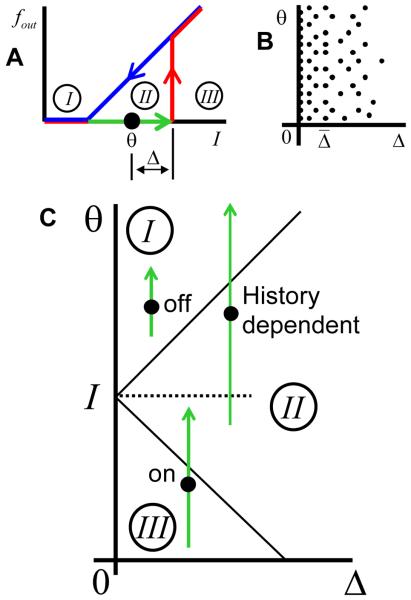
Figure 3A shows the response of the neuron that is used in this simplified model. The red and blue curves show the firing rate dependences for increasing and decreasing inputs respectively. If the input is in the range marked by the green arrow (region II in Figure 3A) the firing rate of the neuron may have two values depending on the prior history. The neuron is therefore bistable for this range of inputs (green arrow).
Figure 3.
Ensemble of bistable neurons with differential parameters. (A) Example of the input to firing rate relationship for a bistable neuron. The activation (red) and deactivation curves (blue) do not coincide in the bistable range (green). If the input current (I) to the neuron is in the bistable range the firing rate can have two values depending on the previous history. The bistable range is shown by the green arrow, with the threshold for activation denoted by the arrowhead. The threshold for deactivation coincides with the arrow's tail. Such neurons can be described by two parameters: θ and Δ, representing the mean position of the threshold (black dot) and the half-width of hysteresis. The unconditionally OFF, bistable, and unconditionally ON ranges of input are labeled by I, II, and III respectively. (B) We considered an ensemble of many bistable neurons. Each neuron is represented by a point in the parameter space (Δ,θ). The density of neurons is uniform along the vertical θ-axis, while the density decays for lager values of the hysteresis half-width. (C) For a given value of the synaptic current on the inputs of all neurons (I, dotted line) the parameter space is divided into three regions. In the top region the neurons are unconditionally OFF. This region corresponds to the range of inputs labeled by I in (A). Thus for one of such neurons, whose bistable range is shown by the green arrow, the input level (dotted line) is below both thresholds for activation and deactivation, which implies that the neuron is unconditionally OFF. In the bottom region, labeled by III, all the neurons are unconditionally ON, since, as shown for another example neuron, the input is above the threshold for activation. In the middle region (labeled by II) the input current is in the bistable range, as shown for one of the neurons. The firing state of these neurons is therefore history dependent, which implies that they can be either ON or OFF.
The response of a neuron as a function of input current exhibits three regimes shown in Figure 3A. For the values of input current below the bistable regime (region I in Figure 3A) the neuron is deactivated (OFF) unconditionally. For the inputs above the bistable range (region III), the neuron is always active (ON). If the inputs are in region II the neuron can be either ON or OFF depending on prior inputs.
We consider an ensemble of units which differ in two respects: hysteresis width and position. The former parameter is described by the half-width of hysteresis Δ = (θ↑ − θ↓)/2, where θ↑ and θ↓ are thresholds for activation and deactivation respectively. The position of hysteresis is described by the average of the two thresholds: θ = (θ↑ + θ↓)/2, as illustrated in Figure 3A. The ensemble of many of such neurons is distributed in the 2D parameter space (Δ,θ) as shown in Figure 3B. The density of neurons in the parameter plane assumed to be
| (2) |
Here, C and Δ̄ are the maximal 2D density of neurons and the average half-width of hysteresis. We assume that Δ ≥ 0 throughout the study. Thus only neurons with regular hysteresis are included in our model. The number of neurons in the square of parameter space with dimensions dΔ and dθ along the Δ- and the θ -axes respectively is given by ρ(Δ,θ)dΔdθ for a sufficiently small square. Thus, although ρ depends only on one coordinate, it is a 2D density of neurons. The 1D density along the θ -axis is constant ρ(θ) = CΔ̄ = const. Although we adopted distribution (2) for concreteness, the analysis described below could be performed for an arbitrary distribution.
We now recall that in case of all-to-all connectivity all neurons receive the same value of synaptic input current (Figure 2). It is interesting therefore to consider properties of the neuronal ensemble when the same input is supplied to all of the neurons. In particular it is of interest to determine what neurons are ON or OFF for a given value of input current. Clearly, an unambiguous answer to this question cannot be given. This is because for the given value of input current I there are neurons, which are in the bistable regime, i.e. their state depends on their history.
For a given value of input current all neurons can be divided into three groups: neurons, which are unconditionally OFF, ON, and the history-dependent units. In Figure 3C the areas occupied by these groups are marked by I, III, and II respectively. For neurons in these areas the input currents are in the ranges I, III, and II indicated in Figure 3A. For the neurons that are unconditionally ON (group III) the value of input current is above their threshold for activation, as follows from Figure 3A: I ≥ θ↑ = θ + Δ. Therefore, such units are located in the region of the parameter space defined by the following condition:
| (3) |
The units which are unconditionally OFF (group I) receive input current, which is below their threshold for activation: I ≤ ↓ = θ − Δ . These units are therefore defined by another condition:
| (4) |
Finally, the neurons which are neither unconditionally ON nor OFF, have a state, which depends on history (group II). Their positions are defined by an alternative to (3) and (4):
| (5) |
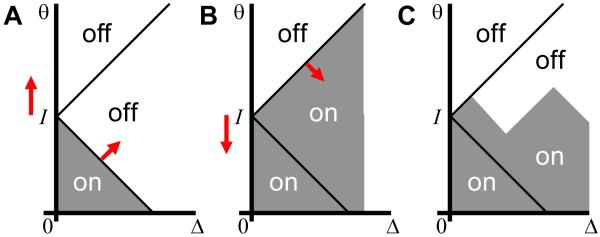
Note that the positions of areas I-III depend on the value of input current I and therefore may change with time. By manipulating external current, one can form various patterns of activation and deactivation in the parameter space, some of which are shown in Figure 4. These patterns do not depend on the distribution of units in the parameter space, i.e. function ρ in (2). The latter function only defined the density of neurons independently of whether they are ON or OFF. It is therefore not history dependent. Another distribution has to be used to describe history dependence in the activation of hysteretic neurons.
Figure 4.
Possible configurations of active units (activation function h(Δ,θ)) in the absence of global recurrent feedback connections. The active areas are shaded. (A) If initially all neurons are OFF and the external current was increased from zero, only the units, which are unconditionally ON (group I) are active. (B) If initially all units are ON and the external current sweeps the parameters space downward, there is a deactivation wave propagating with the boundary between regions II and III (red slanted arrow). The active region extends indefinitely in the direction of a large Δ and is truncated in this and following figures. (C) A more complex pattern of activation in the history dependent region (III) can be produced by a complex pattern of inputs. For the profile shown, current was going up, down, up, and down.
We next define the activation function h(Δ,θ). This function specifies whether a neuron at a point with coordinates (Δ,θ) is ON or OFF. It is equal to one in the areas occupied by active units and to zero in other areas. The total number of active neurons in the ensemble is determined by the sum of the product of the densities over the parameter space:
| (6) |
In this equation the activation function h acts as a marker, which allows inclusion of only the areas occupied by the active neurons into the sum. This expression will allow us to calculate the recurrent current in the next subsection.
1.2 Recurrent feedback and the stability condition
In the previous subsection we studied the properties of a simplified model of hysteretic neurons with only feedforward connections present. Here we include the recurrent connections into the model. To this end we assume that the recurrent current Ir is proportional to the total number of active neurons n given by (6). We therefore neglect the variations in the recurrent current due to changes in the neuronal firing rates assuming synaptic saturation (Seung et al., 2000b; Koulakov et al., 2002). This approximation is valid, if a receptor with a large time constant, such as an NMDA receptor is responsible for neurotransmission in the recurrent synapses (Seung et al., 2000b; Koulakov et al., 2002). The long time constant of NMDA receptors leads to saturation of synaptic currents even at small firing rates (10-20Hz), implying little dependence of the recurrent current on the firing rates. The saturation at low firing rates may also be of presynaptic nature, arising from synaptic depression.
We will now address the dynamics of our model in the case of recurrent connections present. We will assume here that each active neuron contributes I0 to the recurrent current. Therefore the total recurrent current into each neuron can be found as a product of the number of active neurons and parameter I0
| (7) |
Note that the recurrent current is related to the number of active neurons n with a synaptic delay τs. This statement is justified in Appendix A. If the NMDA receptor is a primary neurotransmitter in the recurrent synapses, one should expect synaptic delay to be τs ⎕ 100 msec.
To complete the description of the simplified model we introduce the total value of the input current for each neuron (Figure 2)
| (8) |
Here Iext is the external “command” input. The new value of input current I(t) determines the neuronal activation function for the new time-step h(Δ,θ,t) through the set of inequalities (3)-(5). The activation function through equation (7) leads to a new value of recurrent current at the next time-step t+τs. Thus the system of equations (3)-(8) allows accounting for iterative dynamics of the system of hysteretic neurons connected by recurrent synapses. This dynamic is illustrated below on a series of examples.
We will first discuss the response to a tonic external input [Iext(t)= const]. Let us first assume that the current is positive (Iext > 0). It is expected then that under certain conditions, which become evident below, the input is integrated temporarily, implying that total current in the system increases with time. We then expect a wave of activation, similar to shown in Figure 4A to propagate upward in the parameter space. We will now discuss the equations governing the propagation of this wave and the conditions of its existence.
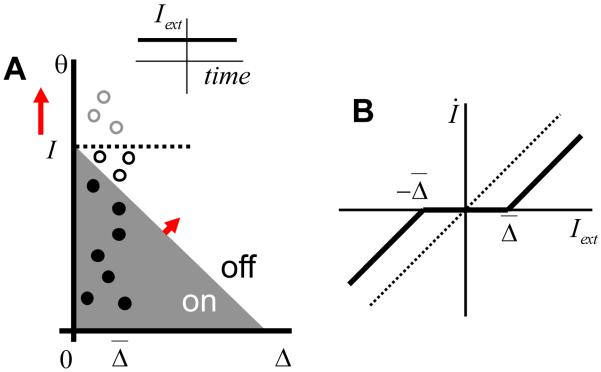
Given the value of total current I, the number of active units is approximately given by the product of the area occupied by neurons under the dotted line in Figure 5A, IΔ̄, and the concentration of neurons in the parameter space C [see (2)], i.e. n = CIΔ̄. This is assuming that the value of current I exceeds substantially the average hysteresis width Δ̄. A small correction has to be made to subtract the neurons, represented by black empty circles in Figure 5A. The corrected expression for the number of neurons in the ON state is
| (9) |
This equation can also be obtained directly from equation (6). As mentioned before, in deriving equation (9) we assumed that I(t) >> Δ̄, which allowed us to neglect contributions to (9) proportional to exp(−I(t)/Δ̄). This approximation will be used by us in all subsequent derivations.
Figure 5. Response to tonic input.
(A) For non-zero external input that is constant in time (inset) the current in the system ( I ) may increase as a function of time (see B for the condition of this). In this case the number of active neurons (full circles) is given by (9). The inactive units are shown by empty circles.
(B) For stationary external input the system's response increases with time if the value of input exceeds a threshold equal to Δ̄. The rate of increase (İ ≡ dI / dt) is proportional to the external current above threshold.
The new value of current at the next time-step is, according to (7), (8), and (9)
| (10) |
where we introduced the tuning parameter α = I0CΔ̄. The “perfect integrator” condition corresponds to the value of parameter α = 1. In this case the current is accumulated according to (10) without a loss:
| (11) |
The quantity being accumulated is actually Iext −Δ̄. The system is therefore capable to act as a temporal integrator. Note that equations described above are valid only on the temporal scales exceeding τs. To describe the behavior of the system on shorter time scales a more precise model of synaptic dynamics is needed.
The sustained integration is possible only if external current exceeds the average value of hysteresis, i.e. Iext > Δ̄ for α = 1. For Iext < Δ̄ the current would have to decrease according to (10), which is not valid in this case. Indeed, in deriving (11) we assumed that there is a wave of activation propagating up in the parameter space (Figure 5A). Because we obtain that current would have to decrease for the case Iext < Δ̄, the persistently propagating in the positive direction wave is not self-consistent in this regime. Therefore sustained increase in the input synaptic current I is not possible if Iext < Δ̄. Consequently, the value of external input current of Δ̄ represents a threshold for integration. Similarly, only the negative inputs below −Δ̄ can be integrated in a sustained manner, which results in a negative threshold for integration. The rate of change in the synaptic current İ ≡ d I/d t as a function of external input is summarized in Figure 5B. This figure shows that if the external input is between −Δ̄ and Δ̄, it is not integrated in a sustained manner. This statement is valid for an arbitrary distribution of active units in the parameter space ρ. That is, if, instead of an exponential distribution given by equation (2), any other distribution of hysteresis widths is found, the threshold for sustained integration is equal to the average value of hysteresis Δ̄. The issue of threshold for integration is discussed below is sections 4 and 5.
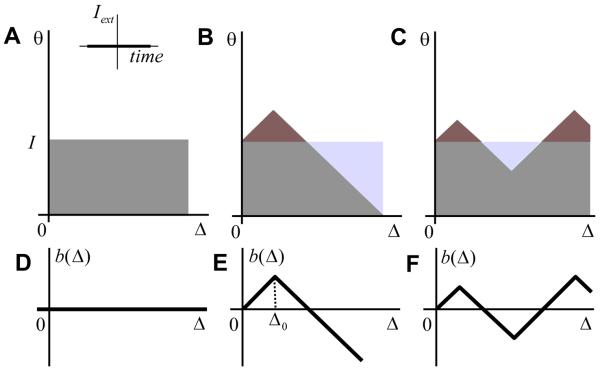
We will now discuss the case of zero external input, which for the oculomotor VPNI corresponds to eye fixations. It turns out that our model displays more sophisticated behaviors in this stationary condition rather than in the non-stationary one. The possible distributions of active units are shown in Figure 6. We start from the simplest case, in which the activation function is shown in Figure 6A. In this case all the neurons that have the medial threshold θ below the present value of input current I are active. The interface between the ON and OFF neurons is a straight line parallel to the Δ-axis. It is not so difficult to see that this distribution function cannot be realized using just the network architecture with all-to-all recurrent connections and the same synaptic input to all neurons. This is because in this architecture the boundaries separating ON and OFF neurons form a 45 degree angle with the parameter axes (Figures 4 and 5). Nevertheless, we will consider the activation function in Figure 6A, because it gives insights into more complex cases (Figure 6B and C). Assume that by manipulating each neuron individually the activation function in Figure 6A was set up. What is the condition needed for it to remain stable as a function of time?
Figure 6. The case of zero external input (inset).
(A-C) Possible stationary configurations of the activation function. The areas shaded by red/cyan lead to an increase/decrease in the number of active neurons with respect to (A). Stable configurations are achieved when the red and cyan areas have the same number of neurons.
(D-F) The boundary functions b(Δ)corresponding to the activation profiles in (A-C).
To answer this question one has to repeat the calculations, which led us to equation (10). The number of active units as a function of total synaptic current is n(t) = CI(t)Δ̄ [see the text preceding equation (9)]. The value of the total synaptic current I at the next time-step t + τs is equal to the total recurrent current since Iext = 0:
| (12) |
For the configuration in Figure 6A to remain stable one has to satisfy the condition of stationarity of the synaptic current, i.e. I(t + τs = I(t). In view of equation (12) this is equivalent to setting α = 1, i.e. having a perfectly tuned integrator. We conclude that the activation function in Figure 6A is stable for a perfectly tuned integrator (α = 1). We will assume the perfect integration for the remainder of this subsection. Some solutions for a non-perfect integrator will be given in the next subsection.
What other stable activation functions are possible? One can generate stable activation functions from the previous example (Figure 6A) using the following prescription. First, one modifies the activation function in Figure 6A in such a way that the number of active units is unchanged. Thus, Figure 6B shows the activation function for which the number of newly recruited neurons (shaded red) is compensated by the deactivated ones (cyan), so that the total number of active neurons is the same as in Figure 6A. Second, one ensures that the intersection of the boundary between ON and OFF neurons with the vertical axis θ should be the same. Near this intersection neurons have very small hysteresis (Δ = 0) and therefore the position of this intersection corresponds to the total synaptic current I. The total current is not perturbed according to the first requirement, because the number of active neurons is unchanged. The first requirement (the change in the number of ON neurons with respect to Figure 6A Δn is zero) amounts to
| (13) |
The boundary function b(Δ) is the shape of the interface between the active and inactive neurons, which is set to be zero at Δ = 0 (Figures 6D-F). This function describes the deviation of the shape of the interface from the case shown in Figure 6A. The boundary function is positive in the areas in Figure 6 having a shade of red and is negative in the cyan areas. Equation (13) implies that an increase in the number of active units in the red areas in Figures 6B and C, where b(Δ) > 0, is compensated by the decrease in the cyan areas [b(Δ) < 0], thus leading to no overall change in the total number of active units. If Δn = 0 the recurrent current is the same as in Figure 6A leading to the stable configuration. We refer to condition (13) as the stability condition. We will show below how this condition leads to the reversal of the sign of hysteresis in the firing rate as a function of eye-position dependence.
The parameter Δ0 introduced in Figure 6B determines the position of the maximum of the function in Figure 6B (the wedge in the activation function). This parameter can be found from (13). In Appendix B we calculate Δ0 for the exponential distribution of cellular hystereses (2)
| (14) |
This relationship is valid only for the exponential distribution of the hysteresis widths. For a distribution different from exponential, a different coefficient of proportionality between Δ0 and Δ̄ is expected. Thus, previously we considered the ensemble of neurons with the same values of hysteresis width (Koulakov et al., 2002). This ensemble is defined by the distribution that replaces equation (2):
| (15) |
where δ is the Dirac delta-function. The stability condition (13) can also be used to calculate the parameter Δ0 for this distribution (Appendix B):
| (16) |
Thus, although the numerical coefficients for exponential and delta-function distributions differ between equations (14) and (16), the value of parameter Δ0 is determined by the average hysteresis width, Δ̄.
Finally, the stability condition (13) allows finding stable parameters of more complex configurations, such as the one shown in Figure 6C.
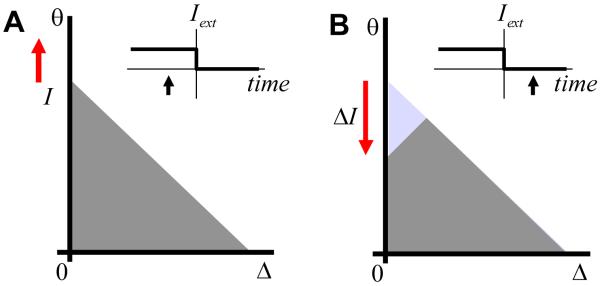
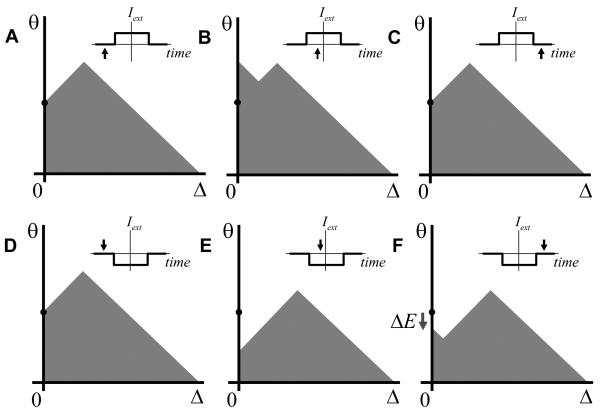
We will now describe the transitional regime between integration (Iext > Δ0, eye movement) and the stable configuration described in the previous paragraph (Iext=0, eye fixation). With the external current present and larger than the activation threshold Δ̄, the activation function is described by the wave of activation propagating in the parameter space (Figures 5A replicated in Figure 7A), which means that the eye position is increasing. Assume that the external current is suddenly removed (Figure 7A, inset). The activation function in Figure 7A is formed during eye movements and does not satisfy the stability condition. As such, it cannot exist during eye fixations. The activation function has to evolve to one of the stable configurations, such as that shown in Figure 6. In the simplest case the activation function evolves to the configuration in Figures 6B also shown in Figure 7B. As a result, the recurrent current Ir drops after the removal of external current in the direction opposite to the previous eye movement. The amount of such a recurrent current drop ΔI is
| (17) |
This drop is given here with a positive sign despite the fact that the current was decreasing after the disappearance of the external input.
Figure 7.
Response to input current that suddenly drops to zero (insets). The black arrows in the insets indicate the moment of time when this activation function is expected.
To calculate the firing rate as a function of eye position during eye fixations we will assume here that the eye position is proportional to the recurrent current. During eye fixations the external input is absent, i.e. Iext=0. The eye position is therefore equal to the total synaptic current I [see (8)]. Ignoring the proportionality constant we assume that during fixations the eye position is equal to the input synaptic current
| (18) |
The problem of finding the firing rate as a function of eye position is therefore seemingly simple: It is to determine the response of a neuron as a function of input current. It may appear that this problem is already solved in Figure 3A, which postulates neuronal response to the input current as one of the assumptions of our model. Indeed, in regions I and III (unconditionally OFF/ON) nothing can change the response postulated in Figure 3A. However, in the bistable region II the firing rate can follow one of the dependences, either ON or OFF. The problem is therefore to determine what branch of the firing rate dependence is followed after ON and OFF saccades.
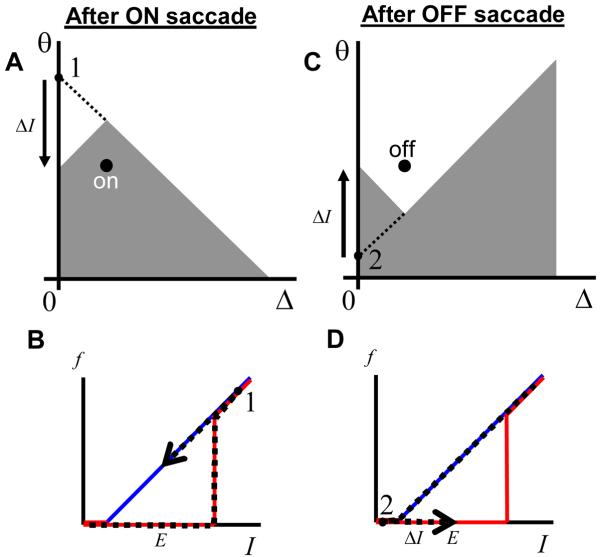
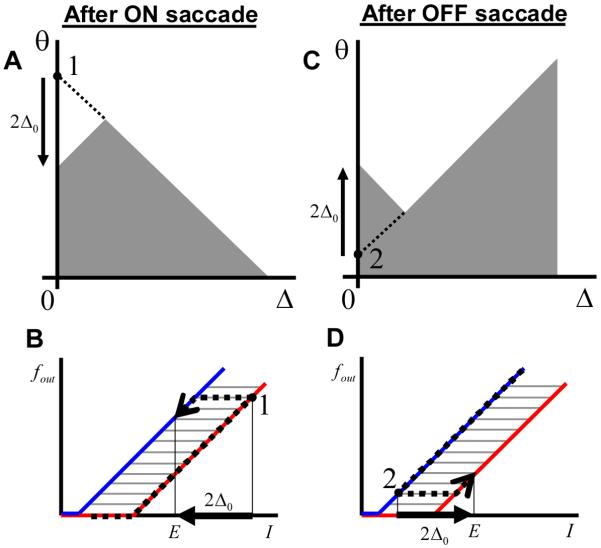
Figure 8 demonstrates qualitatively the reversal of the hysteresis sign in the case of neurons connected by recurrent feedback. Figure 8A and C shows the activation function for a neuron, whose location in the parameter space is illustrated by the black dot. For the same value of the input current and, consequently, the same eye position [see equation (18)] this neuron will be in the active state after the ON saccade (Figure 8A). After the OFF saccade, the same neuron is expected to be OFF (Figure 8C). The firing rate of this neuron is therefore expected to be higher after the ON saccade as illustrated in Figure 8 B and D. This behavior is due to the drop of the recurrent current after the eye movement in the ON direction (increase after the OFF saccade) as was discussed in the previous paragraph. The presence of the global positive feedback therefore leads to the reversal of the sign of hysteresis for some neurons in the network in agreement with experimental findings.
Figure 8.
The reversed direction of hysteresis in the model with differential parameters. The response of the neuron indicated by the black dot after the ON saccade (A) is higher than after the OFF saccade (B). This is because this neuron is ON/OFF in these states as indicated. (B) and (D) illustrate the calculation of the firing rate as a function of eye position during fixations used to generate Figure 9. For the same eye position E after ON saccade (A and B) the firing rate is larger than after the OFF saccade (C and D). This is in agreement with experimental findings (Figure 1).
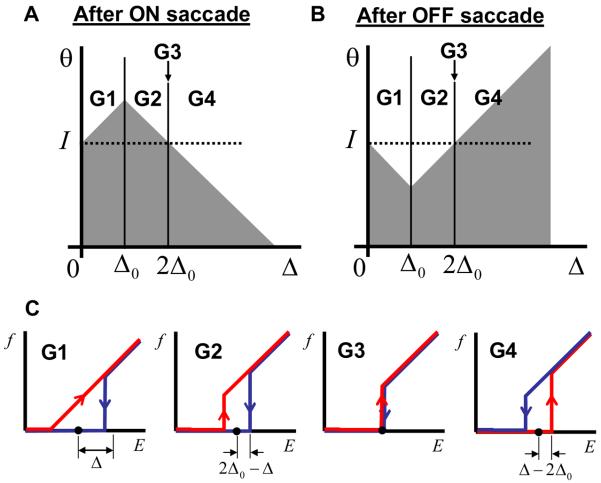
We next examined, quantitatively, the dependence of the firing rate as a function of eye position in our model. We used the following method. Suppose that one has to calculate the firing rate after an ON saccade fON(E). We evaluate the state of the neuron with the total input E + ΔI in the ON state (red dependence in Figure 3A) and subsequently follow the OFF firing rate dependence (blue in Figure 3A) from input E + ΔI to E. This latter operation reproduces the drop in the total recurrent current after the end of a saccade. A similar procedure is followed for the OFF saccades. This method is illustrated in Figure 8 B and D. The results of systematically applying this method are presented in Figure 9.
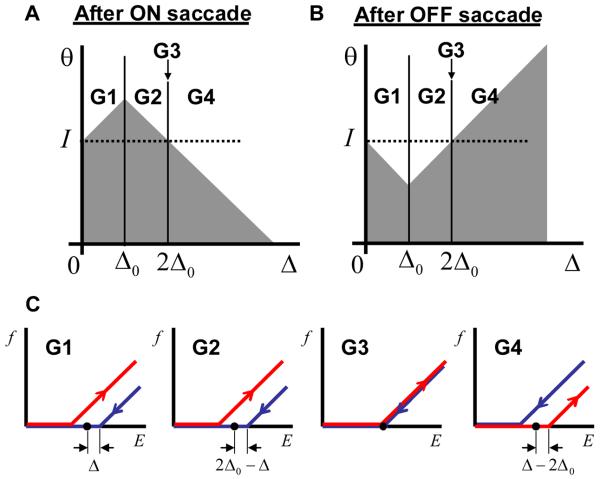
Figure 9.
The firing rate as a function of eye position during fixations for different groups of neurons (G1-4). (A) and (B) the activation functions after the ON and OFF saccades respectively. (C) Firing rate as a function of eye position for neurons from four groups (G1 to G4) indicated in (A). The red and blue curves correspond to the preceding ON and OFF saccades respectively.
Neurons can be separated into four groups with qualitatively different behaviors of the firing rates as functions of eye position. Figures 9A and B show the regions in the parameter space occupied by these groups with the corresponding dependencies of the firing rates on the eye position displayed in Figure 9C. For neurons with a large value of endogenous hysteresis (group G4) a regular direction of hysteresis is observed, the same as the endogenous one. This is not surprising, because the endogenous hysteresis is so strong for these neurons that no drop in the recurrent current can reverse it. The neurons with smaller values of endogenous hysteresis (parameter Δ), which belong to groups G1 and G2 in Figure 9A, display a reversed hysteresis as follows from the qualitative argument illustrated in Figure 8. Finally, a small group of neurons (G3) shows no hysteresis at all. We call these neurons marginal. The marginal neurons are important in establishing a relationship with our previous results (Koulakov et al., 2002) as explained below.
It is of interest to calculate the relative numbers of neurons belonging to different groups. This can be accomplished by using the conditions for areas occupied by different groups of neurons summarized in Figure 9A and equation (2). Thus, for the exponential distribution of neurons in the parameter space, G1 contains 1/2 of all neurons, while G2 and G4 contain a 1/4 fraction each. Therefore, 3/4 of the neurons (G1 and G2) should demonstrate a reversed hysteresis, while for the 1/4 of the neurons (G4) the sign of the hysteresis should remain unchanged. These fractions are specific to the exponential distribution of the endogenous hysteresis ρ(Δ) given by equation (2). For a different from exponential ρ(Δ) a different set of relative abundances of neurons in the groups is expected. Although the relative fractions of different groups of neurons (G1 versus G2) depend on the distribution of hysteresis widths (2), the firing rate dependences shown in Figure 9C do not. For a different distribution the neural responses as a function of eye position are exactly the same in this model.
The group G3 contains neurons with no hysteresis. This is despite the fact that without global feedback they should display a bistable response as in Figure 3A. This group is defined by the condition that their hysteresis half-width Δ is equal to 2Δ0. Since this group resides on the interface between G2 and G4, the number of neurons in this group is vanishingly small for the exponential distribution of Δ. This however is not true for the case when all neurons have the same value of Δ, such as in the case of delta-function distribution (15). In this case all the neurons belong to the marginal group. This is because the position of these neurons in the parameter space Δ = 2Δ0 determined by (16) coincides with the definition of the marginal neurons G3 in Figure 9A. Therefore in this case one should expect no hysteresis in the firing rate as a function of eye position displayed by all neurons. This conclusion applies to neurons in our previous study (Koulakov et al., 2002).
1.5 A more realistic implementation
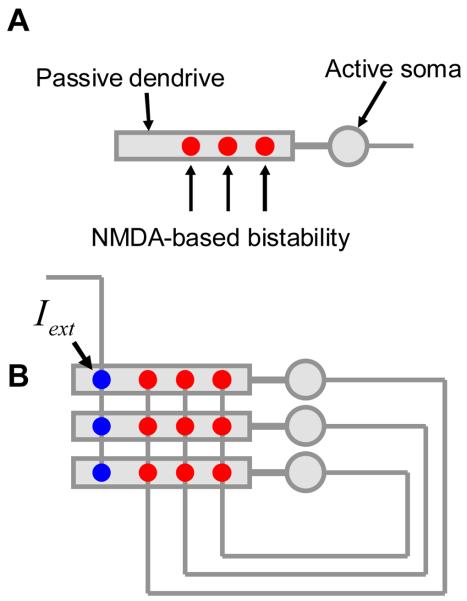
We then investigated if our simplified theory can apply to a more realistic model for a neural integrator involving biophysically plausible implementation of neurons and synaptic conductances. We implemented our model with 40 two-compartmental neurons. Each neuron is represented by two compartments: somatic and dendritic (Figure 10A). The somatic compartment contains sodium and potassium conductances for the generation of action potentials. The firing frequency depends on the overall input into the dendritic compartment. The dendritic compartment is capable of generating membrane voltage-based bistability due to non-linearity of NMDA conductances. Since the amount of NMDA conductance is different for different cells (see Methods) the cells display a hysteretic input-output relationship, with the width of hysteresis varying from cell to cell, similarly to the simple model (Figure 11A).
Figure 10.
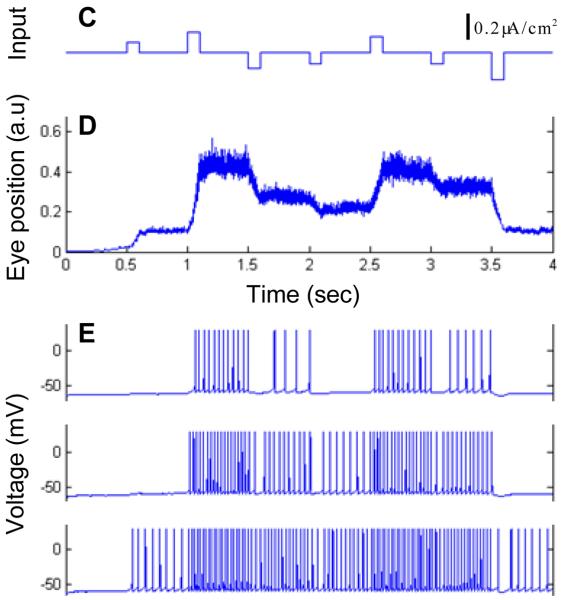
The model with Hodgkin-Huxley neurons. (A) Each neuron has a dendritic compartment that is bistable and soma that generates action potentials. To generate bistability the dendrite receives tonic NMDA current. (B) Neurons are connected into the network by all-to-all global feedback that generates additional NMDA current into each dendrite. The network contains 40 neurons, only three of which are shown. (C) An example of external input supplied to every dendritic compartment. (D) Resulting changes in the average feedback current reflect the integral of input. This variable could therefore be associated with the eye position. (E) The membrane voltage for three example neurons.
We then connected the cells by the recurrent feedback. The strength of all recurrent synapses is the same, which corresponds to the all-to-all connectivity with roughly the same recurrent current on the input to all neurons (Figure 10B). When these cells are connected by recurrent feedback, the network can integrate a transient input current (Figure 10C-E) as a function of time.
As predicted by the simple model, the neurons fall into four categories: with little or no hysteresis (Figure 11B), inverted hysteresis (Figure 11C), marginal neurons (Figure 11D), and regular direction of hysteresis (Figure 11E). These classes correspond to the dependences derived in the simplified model and illustrated in Figure 9C. We have therefore shown that the conclusions of the simplified model sustain the test by a more realistic implementation.
2. Multistable neurons
We next examined the behavior of the recurrent system of neurons that themselves exhibit multistability. Cellular multistability is assumed to emerge from the bistable properties of several dendritic compartments of the same neuron (Figure 12A). We demonstrate here that under certain conditions the recurrent network of multistable neurons may be mapped mathematically onto the system of bistable neurons considered above. The properties of the multistable neurons in the network are therefore similar to the behaviors of bistable neurons, including the history-dependent profiles of the activation function (Figure 9) and the reversal of the sign of hysteresis.
Figure 12.
Model with multistable neurons. (A) Neuron with multiple bistable dendritic compartments. Synapses are shown by colored circles. (B) Firing rate as a function of input current for such a neuron is multistable: each stable firing state corresponds to the fixed number of active dendritic compartments. Introducing the parameters θ and Δ allows us to map the problem mathematically to the previous model with bistable neurons. (C) The recurrent network of multistable neurons with all-to-all connections that can be solved using this method.
We first consider the properties of multistable neurons in isolation, i.e. without recurrent connections present. Each neuron includes several dendritic compartments (Figure 12A). The dendritic compartments are assumed to be electrotonically isolated from each other. This implies that the response of each dendritic compartment is independent of the state of other compartments in the same dendritic tree and on the firing activity of the cell's soma. Each of the compartments is assumed to be bistable. The bistable ranges of the compartments are assumed to be distributed over a large range of values with no substantial difference in the hysteresis width. These assumptions lead to the dependence of the firing rate on the input current in the form of a staircase (Koulakov et al., 2002; Goldman et al., 2003) as discussed below. This dependence is illustrated in Figure 12 B.
When the cell receives input current that increases, the dendritic compartments are sequentially switched on and the firing rate of the cell increases following the red line in Figure 12B. When the current decreases, the dendritic compartments are switched off leading to a decrease in the firing rate (blue line in Figure 12B). The space between the blue and the red lines corresponds to the bistable range of the dendritic compartments. This implies that none of them will change their state and, therefore, the firing rate is preserved in the region between the red and the blue lines. This is signified by the gray horizontal segments in Figure 12B. The bistability in the behavior of dendritic compartments results in the hysteretic loop in the response of the cell (Lisman et al., 1998; Koulakov et al., 2002). Note that the activation line (red) is below the deactivation line (blue) which means that for an isolated cell the hysteresis has a regular sign (cf. Figure 3). An additional twist is provided by the states that are accessible inside the hysteretic loop. We will argue that the multistable neurons with these response properties connected into a recurrent network (Figure 12C) display reversed hysteresis through the mechanism similar to the previously discussed.
We will now consider the multistable neurons connected into an all-to-all network (Figure 12C). As in our previous model we assume that all neurons receive the same value of input current composed of the external and recurrent currents. The latter component is determined by the number of neurons that are presently active. Similarly to the model with bistable neurons we assume that the neuron is active if the firing rate of this neuron is above zero. This assumption leads to the similarity between the model with multistable and bistable neurons (Section 1). Indeed, due to the saturation of slow NMDA conductance and/or synaptic depression, the recurrent NMDA current varies weakly as a function of the firing rates of the presynaptic neurons. Therefore, the exact form of the firing rate dependence is not important for the network current. Thus, the neurons shown in Figure 3A and 12B are not distinguishable from the viewpoint of other neurons in the network. In particular, we can describe each multistable neuron by two parameters: the median hysteresis position θ and half-width Δ (Figure 12B). The neurons then can be arranged on the 2D parameter plane similarly to the bistable case. Our conclusions about the dynamics of activation function can be transferred from the bistable case to the multistable case without any modification. Therefore, as far as the properties of the entire network are concerned, two networks based on bistable and multistable neurons are indistinguishable. The differences between the networks emerge when the firing rate of individual neurons is determined from the history dependence of the recurrent current. We will illustrate this point next.
Consider a multistable neuron in the network. During the saccade in the ON direction the firing rate of this neuron was increasing according to the red dependence (Figure 13B). When the eye movement comes to conclusion the external input driving it terminates. The moment of termination of the external input is shown in Figures 13 A and B by point 1. Establishment of the eye position during fixations leads to a recoil in the recurrent current in this model by the amount equal to 2Δ0, similar to the case of bistable neurons. From the point of view of the single neuron in the network, the input current is decreased by 2Δ0 leading to the transition from point 1 illustrated in Figure 13B by the dotted arrow. The newly established firing rate during eye fixation is shown by the tip of the arrow. After the OFF saccade, the removal of external driving input leads to a symmetric increase in the recurrent current given by 2Δ0 (Figure 13C). The corresponding firing rate for this neuron after the OFF saccade is represented by the tip of the dotted arrow in Figure 13D. Notice that for the same eye position in Figures 13B and D the firing rate is higher after an ON saccade than after the OFF saccade. This is in contrast to the response of the neuron that is not connected by the feedback (Figure 12B). Thus, the hysteresis is expected to be reversed for this neuron due to the presence of network feedback.
Figure 13.
Illustration of the calculation of the firing rate as a function of eye position during fixations. For the same eye position E after ON saccade (A and B) the firing rate is larger than after the OFF saccade (C and D). This is similar to experimental findings (Figure 1).
Through systematic application of the geometric procedure illustrated in Figure 13B and D to all possible groups of neurons in the parameter plane of the system, we obtained the dependence of the firing rate on the eye position illustrated in Figure 14. This Figure shows that the neurons with substantially small hysteresis i.e. from groups G1 and G2, display inverted hysteresis as suggested by the qualitative analysis in Figure 13. For an inverted hysteresis the native hysteresis width Δ has to be smaller than twice the recoil in the recurrent current 2Δ0. For neurons with strong native hysteresis from group G4, a regular sign of hysteresis is expected. These conclusions are similar to the results of the model with bistable neurons (Figure 9).
Figure 14.
The firing rate as a function of eye position during fixations. The separation of the parameter space into areas (A and B) is similar to the bistable case (Figure 9). (C) The response is given by the inverted hysteretic loop. These dependencies are obtained for the case of large saccades. For smaller saccades the values of the firing rate inside hysteretic loops are accessible, which is one of the experimental predictions of this model.
The important feature displayed in Figure 14C is that the values of response inside the hysteretic loop are not accessible during fixations. This observation is an artifact of considering the saccades of large amplitude, which are independent of each other. If the actual eye movement included many smaller saccades, the values inside the hysteretic loop in Figure 14 would be possible. Thus one could make an experimental prediction that in the experimental data in Figure 1, smaller amplitude saccades result in the responses near the center of the hysteretic loop.
3. Mistuned integrator
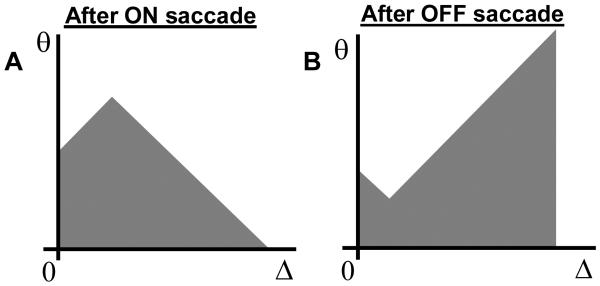
In the previous sections we discussed the properties of the perfectly tuned integrator. In this case the current needed to recruit an additional neuron was exactly equal to the increase in the recurrent current resulting from recruiting this neuron. This condition is sufficient for many states of the system to be equally stable, i.e. for the system to be multistable. The condition was quantitatively described by setting the parameter α = I0CΔ̄ to 1. Here I0 describes the contribution to the recurrent current from a single neuron and CΔ̄ is the inverse spacing between neuronal thresholds for activation, representing the increase in the recurrent current needed to activate an extra neuron. What if the recurrent feedback strength is weaker (α < 1) or stronger (α > 1)? We find that for substantial deviations from the perfectly tuned condition (α = 1) stable eye fixations are also possible. Our model displays the same degree of robustness as simpler hysteretic systems (Koulakov et al., 2002; Goldman et al., 2003). The activation function during fixations is displayed for the case of weak feedback in Figure 15. Although the fixation is stable, the recoil in the recurrent current after the ON saccade is larger than the increase after the OFF saccade (Figure 15A versus B). The activation function therefore loses its symmetry between ON and OFF saccade cases pertinent to the perfectly tuned integrators (Figures 9 and 13).
Figure 15.
Robustness of a mistuned integrator. Mistuning α = I0CΔ̄ ≠ 1 [defined in (10)] leads to the asymmetric activation function after the ON and OFF saccades. The activation functions shown correspond to α < 1, i.e. the weak feedback.
4. Subthreshold inputs
Our model includes some neurons that have no hysteresis (Δ = 0). At the same time we have concluded above that sustained integration requires the external input exceeding a certain threshold equal to the average value of hysteresis for the ensemble (Figure 5). The natural question is whether the neurons with no hysteresis can somehow integrate even a subthreshold input (Iext < Δ̄).
In the model described above the subthreshold inputs can indeed induce persistent changes in the activation function and the firing rates of integrator neurons. It is true, however, that these changes will not depend on the duration of the stimulus. They depend only on the stimulus amplitude. Thus, persistent integration is indeed not possible, which means that the longer stimulus will not induce larger changes in the number of active neurons. This statement is valid for the model with no noise, i.e. with no spontaneous switching of the bistable units. We demonstrate below that the presence of a finite switching time will lead to the leaky integrator and will make sustained integration possible even for subthreshold inputs.
Consider the state of the activation function during fixation after an ON saccade (Figure 16A). A small positive input, (0 < Iext < Δ̄, Figure 16B), leads to no sustained changes in the activation function. This implies that when the input is extinguished (Figure 16C) the activation function is the same as before the stimulus (Figure 16A). This is because the stability equation (13) has only one solution in this case as shown in Figures 16A and C. However, the negative inputs, (Iext > 0), do lead to a sustained decrease in the eye position (Figure 16D-F). This partially justifies the intuition that the units with small hysteresis can react to stimuli of small amplitude. Of course this intuition fails for positive inputs (Figure 16A-C), since they do not lead to sustained changes in the integrator state.
Figure 16.
Response of the integrator to the subthreshold inputs Iext < Δ̄ is asymmetric. After the ON saccade, the inputs in the same direction lead to no sustained changes in the activation function (A-C). The inputs in the opposite direction results in a sustained decrease in the eye position (D-F) shown by the gray arrow. The initial eye position and the moment of time are indicated by the full circle and the arrow in the inset.
5. Integration time-constants
In this section we will study the effect of spontaneous transitions in the bistable neurons on the stability of the integrator as a whole. So far we have assumed that the bistable or multistable neurons possess the property of perfect memory, i.e. there are no transitions between different states for these neurons. Thus, in the case of bistable neurons we assumed that the neuron will remain in the ON or OFF state for a very long time, even though a transition to the other state is possible. In the case of multistable neurons we assumed that the state of bistable dendritic compartments is preserved, which leads to the infinite in time retention of the value of the firing rate in the absence of external inputs. In this section we examine the effects of noise-driven transitions between different memory states. We will address the behavior of bistable neurons for definiteness. We will derive the connection between the decay time-constant of the bistable units and the integrator leak time.
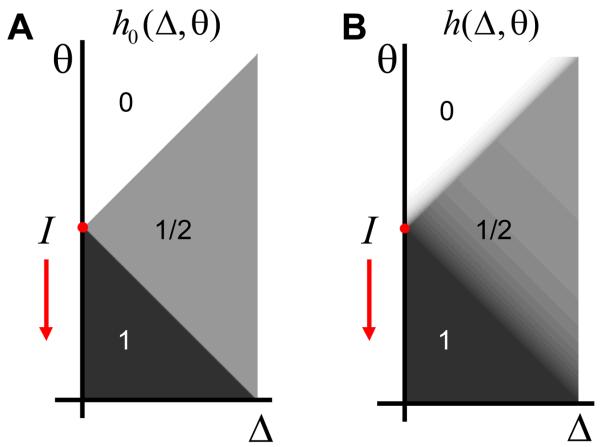
In case of perfect memory the activation function h(Δ, θ) can take two values, 1 and 0, corresponding to the ON and OFF states respectively. When the spontaneous noise-driven transitions are possible, the activation function may take values between 0 and 1. This is because the activation function defines the average state of neurons in the small neighborhood of a point in the parameter space. If spontaneous transitions are allowed, the average value can deviate from pure values of 0 and 1. The activation function h(Δ, θ) then describes the fraction of neurons in the ON state near point (Δ, θ). It is also equal to the conditional probability of finding a unit in the active state. The evolution of this function can be described by the relaxation equation
| (19) |
Here h0(Δ, θ) is the activation function in the equilibrium, while τ(Δ, θ) is the relaxation time-constant describing how fast this equilibrium is reached. The important feature of this equation is that both the equilibrium relaxation function and the time constant depend on the position in the parameter space. Indeed, in an area of unconditional stability [I and III in Figure 3C], the equilibrium function equals 0 and 1 respectively. No other values are permitted because there is no bistability in these regions. In the area of bistability [II in Figure 3C], the equilibrium function takes intermediate values that are determined by the fraction of units in the ON state in the equilibrium. Also, in areas I and III the equilibrium values are reached with a very fast time constant. We assume that the bistable units can be flipped essentially instantaneously. In the area of bistability [area II], the equilibrium is reached over much longer time-scales determined by the time of spontaneous transitions between two stable states of the neuron. Thus if one assumes that the transition from the ON state to OFF state (decay) is characterized by the time constant τ1→0 while the opposite transition (spontaneous activation) occurs with time-constant τ0→1, the equilibrium activation function and the time-constant of relaxation to the equilibrium value in area II is
| (20) |
| (21) |
To simplify subsequent equations we will make an assumption that τ0→1 = τ1→0, so that in area II h0 = 1/2 and τh = τ1→0 / 2. The important feature of the biological system is that the decay time-scale τh is substantially larger than synaptic time-constant τs. The ratio between τh and τs is usually exponential (Bialek, 2000; Koulakov, 2001).
To demonstrate that the seemingly simple (19) can lead to interesting results, we solved the equation for the case when τ(Δ, θ) = τh is constant everywhere in area II. A more complex case is considered in the Supplementary materials 2. Our goal is to understand how the decay of bistable neuronal units translates into the decay of integrator memory, or, in other words, how the integrator becomes leaky. That the integrator is leaky implies that the recurrent current changes with time. For example, if the recurrent connections are weak (α < 1) the current decays (dI / dt ≡ I is negative). The equilibrium activation function in this case is sliding down in the parameter space at a rate equal to İ as illustrated in Figure 17A. Note that the equilibrium activation function is the limit towards which the real activation function is moving at each moment in time, according to (19). The equilibrium activation function therefore can be non-stationary, in which case the final target for the activation function is dynamically changing. Thus, for İ < 0, the real activation function, lags behind the equilibrium values by the time constant τh (Figure 17). To solve (19) we notice that once a neuron enters area II its activation function will relax to the equilibrium value independently on other neurons with the time constant τh. As a result the solution for the activation function in area II becomes
| (22) |
Figure 17.
The activation function in the case of non-stationary recurrent current that decreases as a function of time. (A) The equilibrium activation function for the case τ0→1 = τ1→0 (B) The actual activation function is lagging behind the equilibrium values.
Here Δt is the time spent by the neurons in the area II. This time is given by the distance traveled in the area II divided by the speed of the movement of the area II border |İ|.
| (23) |
This equation implies that the speed is uniform and does not depend on time. This approximation is valid if the acceleration of the eye movement is negligible. More precise condition for the validity of this approximation is derived in Appendix C.
The number of active neurons can be easily calculated from (22) using (6). We obtain
| (24) |
In formulating this equation we again assumed similarly to the remainder of the study that I >> Δ̄ which allowed extending integration over Δ to infinity. Equation (24) is valid for an arbitrary sign of the time-derivative of the current İ : both positive and negative. Note that for İ < 0 the correction to the number of active neurons [second term in (24)] is positive. This is because the activation function ‘extends’ into area II due to a finite delay time introduced by hysteresis (gray “plume” in area II in Figure 17B).
To simplify analysis further we assume that the rate of change of the current is actually small. This is possible if the integrator is close to be perfectly tuned. The more exact condition for this assumption to be valid becomes clear in the following equations. Assume that τh|İ| is much smaller than Δ̄ in the denominator in (24). Under this condition we can write that
| (25) |
Since the recurrent current is proportional to the number of active neurons in this model
| (26) |
we then arrive at the equation describing the dynamics of input current to all units:
| (27) |
Here the tuning parameter α = I0CΔ̄ is the same as defined above. It is clear from this equation that the mistuning of the integrator should be small, i.e. (1 − α)I << Δ̄, for us to neglect the second term in the denominator of (24). Thus the leaky integrator equation is valid if the mistuning is not too large.
Equation (27) describes decay of the integrator current in the absence of the external inputs. Assuming α ≈ 1, the integrator time-constant that follows from this equation is
| (28) |
We conclude that the integrator leak time-constant is determined by the rate of decay of bistability in this model. This is in contrast to the models without substantial hysteresis in which the time-scale for the integrator leak is provided by the synaptic time-constant τs (Robinson, 1989; Seung et al., 2000a). This point suggests another interpretation for robustness of this model. Indeed, since observed τleak is about 30 sec, with the time-scale of the decay of hysteresis τh of a few seconds (Bialek, 2000; Koulakov, 2001), the parameter α has to be tuned to unity with the precision of about 10%. Thus the presence of hysteretic neurons allows putting a much weaker constraint on the integrator tuning to reach the same value of leak.
With the help of (24) one can derive a more general equation for the dynamics of the integrator:
| (29) |
This equation is valid for a constant external current. Equation (29) can be solved for dI / dt. The result is
| (30) |
where s = sign(Iext). This equation has the following limits for small and large values of the external current
| (31) |
and
| (32) |
In the limit when transitions between two states of bistable neurons can be neglected, i.e. τh → ∞ equation (30) yields solution (11) previously obtained.
Another point evident from the solutions of kinetic equation is that the rate of integration is determined by the synaptic time-scale τs [equation (32)], while the decay of delayed activity is proportional to the average time of spontaneous decay of the bistability τh [equation (28)]. The latter is an exponential function of the former (Bialek, 2000; Koulakov, 2001), and may significantly exceed the synaptic time-scale. Thus, the neural integrator described here is capable of integrating large external stimuli effectively due to a small time-constant τs while remaining robust due to the larger memory time-scale τh.
Finally, we note that according to (31) in the perfectly tuned case (α = 1) the current in the integrator is changing (dI / dt ≠ 0) even for infinitely small external current. This implies that the integrator with spontaneous transitions does not have the threshold for integration. The rate of integration of weak inputs is determined however by the hysteresis time-constant τh, which is a remnant of the threshold existing for perfectly bistable units without spontaneous transitions between the ON and OFF states (Figure 5).
6. Experimental predictions
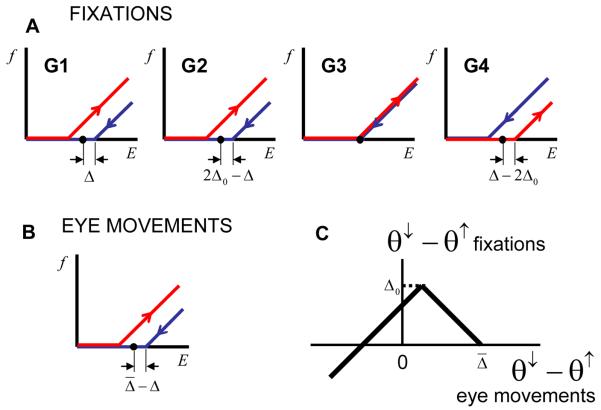
The main experimental prediction that follows from this model concerns the comparison between the firing rates during fixations and slow eye movements. The latter include both smooth pursuit and vestibule-ocular reflex (VOR) responses. We have shown that the model yields an inverted sign of hysteresis for some neurons in the ensemble, similarly to experiential observations. Thus ON responses are above OFF responses in Figures 9 and 14 for G1 and G2. We argue here that the responses of the same neurons are different during smooth eye movements, sometimes in a qualitative manner. For the purposes of this section we will use the multistable model with no decays (Section 2, Figure 14).
We first notice that the activation function is the same for the smooth eye movements as for the case when the neurons are not connected by global recurrent connections (compare Figures 4A and 5A). Thus, the firing rate as a function of eye position can be derived from the dependence with no recurrent connections by choosing the appropriate value of input current. The total value of input current is composed of the recurrent and external current. We have associated the former with the eye position (18). The external current has a minimum value that allows sustained integration |Iext| = Δ̄. We thus obtain for the smooth eye movements
| (33) |
Here we assume that external input is equal to the threshold value for sustained integration i.e. |Iext| = Δ̄. The firing rate as a function of eye position is obtained from the dependences with no feedback by shifting the ON dependence to the left by Δ̄ and the OFF dependence to the right by Δ̄. The dependence is shown in Figure 18B for the multistable neurons.
Figure 18.
The differences in responses between the case of eye fixations (A), and smooth movements (B), predicted by this model. Note that response depicted in (B) is predicted for all groups of cells G1 through G4. (C) The distance between OFF and ON thresholds for fixations versus small velocity eye movements that follows from (A) and (B).
As clear from Figure 18 the hysteresis during smooth eye movements is related to that during fixations. By plotting the width of hysteresis for individual cells the dependence could be mapped out experimentally. In particular, the neurons with small hysteresis during fixations will acquire history dependence in the response during smooth eye movements. This feature could be detected experimentally.
Discussion
We studied the recurrent networks built out of hysteretic units. We considered the case when neurons belonging to the same integrator network have different values of hysteresis. The properties of the integrators with differential hysteresis were first analyzed by (Goldman et al., 2003) (see discussion below). We analyzed the properties of such networks assuming a large number of neurons, which allowed treating the behavior of the system statistically, using distribution functions. To simplify our analysis we assumed that neurons are connected in the all-to-all fashion, i.e. each neuron makes synapses with the dendrites of all other neurons in the network. This assumption allowed us to study the properties of this network analytically, i.e. without the use of a computer. We expect however that many properties derived here will be valid in networks with sparse random connectivity. Because at the basis of our model lies the neuronal activation function that resembles in shape sand dunes (Figure 6C), we call our model the “sandpile” integrator.
One of the important properties derived here is that the hysteresis of the integrator neurons is strongly affected by the recurrent connections. Assume that before neurons are connected, their firing rate exhibited history dependence of a particular sign. For example, assume that the firing rate was always higher after the decrease in the external input into the neuron than after an increase. Such history dependence is often displayed by neurons with intracellular mechanisms of positive feedback, or in local strongly-connected clusters of neurons (Koulakov et al., 2002). We called, somewhat arbitrarily, this type of history dependence a regular native hysteresis or a hysteresis of positive sign. As follows from our consideration, the history dependence after these neurons are connected in the network is different. Many neurons actually change the sign or direction of hysteresis from positive (regular) to negative (anomalous). This implies that the firing rates after an increase in the external current (ON saccades) are higher than after a decrease in the current. This feature is acquired by the neurons when they are connected into the network, which is needed to maintain the memory about the eye position. Similarly, it is quite easy to show that the neurons with negative native hysteresis may reverse their sign to positive when connected into networks.
This phenomenon of the reversal of the direction of history dependence in the recurrent networks of hysteretic neurons could reconcile the observed direction with the possible mechanisms of generating hysteresis in the VPNI. Indeed, the observed sign of hysteresis is almost always negative (Pastor et al., 1991; Aksay et al., 2003). Simplistically, this may imply that the mechanisms other than those involving positive feedback are responsible for this sign of hysteresis, such as the mechanisms based on negative feedback. Our findings indicate that the neurons could have a positive feedback active inside the cells generating the regular direction of history dependence, which, after the neurons are connected into the network, becomes reversed. In a sense, two positive feedbacks, intracellular and extracellular, may manifest themselves in reversed hysteresis mimicking the negative feedback systems.
Similar phenomenon of the reversal of the hysteresis sign was obtained in the model of (Goldman et al., 2003). This study examined more complex network connectivity in which neurons targeted specific dendritic compartments. The number of bistable dendritic compartments was equal to the number of neurons in the network. In the simplest case when the dendritic compartments targeted by a single neuron have the same properties (network connectivity has an outer product form) their model was solved exactly without the use of computer. Their findings in this case indicate that the cells do not display hysteresis in the firing rate-to-eye position relationship. When the outer product form assumption was relaxed the neurons displayed the hysteresis in the firing rate similar to the one observed experimentally, including the sign. In the latter case the model of (Goldman et al., 2003) could not be solved exactly. (Goldman et al., 2003) demonstrated their findings computationally and using a qualitative argument. Here we presented a different view on a simpler system than discussed in (Goldman et al., 2003). Due to the simplicity of our networks (all-to-all connectivity) it was possible to demonstrate the hysteresis in the firing rate and provide an exact solution to our system without the use of computer. Perhaps, our method with the extended dimensionality of the parameter space could yield the exact solution to the model of (Goldman et al., 2003) in the non-outer product case.
Previous studies of the goldfish VPNI have failed to find substantial bistability at the level of individual neuron when these neurons were stimulated intracellularly (Aksay et al., 2001). These findings could be reconciled with our model if one assumes that the stimulations were applied to non-bistable neuronal compartments. This could occur if only a fraction of dendritic tree were actually bistable or if the bistability on the single-neuron level were conditional, i.e. existed only for a small range of eye positions near activation threshold. This possibility is discussed in our previous study (Koulakov et al., 2002). In particular it is possible that the bistability is created in part due to NMDA current in the recurrent synapses, which is dependent substantially on the eye position (Koulakov et al., 2002). The model with conditional bistability is beyond the scope of our present study, in which we considered simplest possible models. The models considered here are therefore not suitable to address the issue of single neuron bistability in the intracellular stimulation experiments (Aksay et al., 2001). At the same time experimental studies have clearly shown hysteresis in the response of integrator neurons, when they are stimulated endogenously as an ensemble (Aksay et al., 2003). These experiments are addressed in our present study. These points indicate that further investigation both theoretical and experimental of the response of individual neurons to external intracellular stimulation is warranted.
We studied the effect of spontaneous transitions in the bistable units on the dynamics of the integrator. We found that in the presence of such transitions the integrator becomes leaky. The leak time-constant is determined by the rate of spontaneous transitions, at least when the mistuning of the integrator is small. For the case of constant rate of spontaneous transitions we have derived the simple formula relating two time constants, those of integrator leak and of spontaneous transitions [see (1) and (28)]. The relationship is similar to the earlier derived formula for the connection between the fast synaptic time-constant and integrator leak for integrators with no hysteresis. A more complex case of non-constant rate of spontaneous transitions is considered in Supplementary material 2. Our findings also indicate that the integration rate for the hysteretic integrator is determined by the faster synaptic time-constant. This statement is valid for large inputs. Thus, hysteretic integrators are both robust and capable of responding quickly to the external stimuli.
The effects of noise on integrator networks was also addressed by (Goldman et al., 2003). They show that adding noise allowed small inputs to be integrated and caused slow decay. These conclusions are similar to our result. In our study the transitions caused by noise are treated qualitatively and are described by an analytical equation for the rates of decay [(29) and (1)]. Similarly to (Goldman et al., 2003) our equations show that the decay is fast for larger perturbations, while integration of very small smooth inputs will be governed by the slower time constant of spontaneous transitions in the bistable unit.
Our consideration of the dynamics of transitions in the hysteretic neurons was limited for two reasons. First, we assumed that the transition time-constant is the same for all units, independent of the width of hysteresis. Second, we assumed that the spontaneous transition rate is the same at all positions in the region of bistability. Our approach allows relaxing these assumptions at the expense of simplicity, as done in Supplementary material 2. We expect also that making small hysteresis units less robust to noise-driven transitions, as predicted by prior theoretical studies (Bialek, 2000; Koulakov et al., 2002), will allow integrating small amplitude inputs.
Our consideration of network dynamics was limited to the evolution of the distribution function in the two-dimensional parameter space (hysteresis width and position). Additional parameters could be included by making the coordinate space for the distribution function three, or more than three dimensional. Such variables would allow a study of network topologies more complex than all-to-all.
Conclusion
We studied an exactly solvable model for recurrent networks of hysteretic neurons. This model displays the reversal of the direction of hysteresis when the recurrent connections are included. The leak time-constant of the integrator with hysteretic neurons is determined by the rate of spontaneous noise-driven transitions in the individual neurons. We argue that experimental data are consistent with the positive feedback existing on both intracellular and network levels.
Supplementary Material
Appendix A
In this appendix we will show that slow dynamics of the integrator can be described by equations with synaptic delay. Similarly to the remainder of our study we assume here that recurrent synaptic current is a linear function of the number of active neurons n(t):
| (34) |
Here K(t) is the function that describes time-dependent synaptic transmission. This function can be associated with the postsynaptic current in response to a pulse of input, such as action potential. If the variations of the presynaptic variable n(t) are slow, one can approximate them by the first order Taylor series expansion
| (35) |
in equation (34) to obtain the following approximation
| (36) |
This expression describes approximately the variation of the current in case if the number of active neurons n(t) is changing slowly. In this expression we introduced the moments of the postsynaptic current defined as follows
| (37) |
Equation (36) can be transformed using the first order Taylor expansion
| (38) |
Where we have introduced the following time constant
| (39) |
Thus the slow dynamics of current is described by the delayed equation (38) that is similar to (7). According to (39) synaptic delay τs is determined by the average period over which synaptic current arrives in response to a pulsed input. The synaptic delay time is therefore weakly dependent on the onset of synaptic current.
Appendix B
Here we apply the stability condition (13) to some distributions of hysteresis widths ρ(Δ) and obtain the parameter of stable configuration Δ0 (Figure 6B). The boundary function in Figure 6B is
| (40) |
The goal is to find Δ0 using equation (13). Using (40), equation (13) can be rewritten as follows
| (41) |
We assumed here that the integral over Δ can be extended to infinity, which is valid for large values of I. For the exponential distribution ρ(Δ) given by equation (2) from (41) we obtain
| (42) |
For the delta-function distribution of hystereses (15), Δ0 = Δ̄/2, which can be verified by direct substitution to (41). This leads directly to (16).
Appendix C
Here we derive the condition at which the acceleration in the recurrent current can be neglected in the kinetic equation. The effect of acceleration are negligible if the variation of the current's velocity is small within the time-constant of the decay of bistability Δİ ~ τhİ = İ, so that the integral in (24) is not strongly affected. This results in the condition τh << τleak, i.e. |α−1| <<1 in view of equation (28).
References
- Aksay E, Baker R, Seung HS, Tank DW. Anatomy and discharge properties of pre-motor neurons in the goldfish medulla that have eye-position signals during fixations. J Neurophysiol. 2000;84:1035–1049. doi: 10.1152/jn.2000.84.2.1035. [DOI] [PubMed] [Google Scholar]
- Aksay E, Gamkrelidze G, Seung HS, Baker R, Tank DW. In vivo intracellular recording and perturbation of persistent activity in a neural integrator. Nat Neurosci. 2001;4:184–193. doi: 10.1038/84023. [DOI] [PubMed] [Google Scholar]
- Aksay E, Major G, Goldman MS, Baker R, Seung HS, Tank DW. History dependence of rate covariation between neurons during persistent activity in an oculomotor integrator. Cereb Cortex. 2003;13:1173–1184. doi: 10.1093/cercor/bhg099. [DOI] [PubMed] [Google Scholar]
- Bialek W. Stability and noise in biochemical switches. 2000 http://lanlarxivorg/abs/cond-mat/0005235
- Camperi M, Wang XJ. A model of visuospatial working memory in prefrontal cortex: recurrent network and cellular bistability. J Comput Neurosci. 1998;5:383–405. doi: 10.1023/a:1008837311948. [DOI] [PubMed] [Google Scholar]
- Fukushima K, Kaneko CR. Vestibular integrators in the oculomotor system. Neurosci Res. 1995;22:249–258. doi: 10.1016/0168-0102(95)00904-8. [DOI] [PubMed] [Google Scholar]
- Fuster JM. Memory in the cerebral cortex : an empirical approach to neural networks in the human and nonhuman primate. MIT Press; Cambridge, Mass: 1995. [Google Scholar]
- Goldman-Rakic PS. Cellular basis of working memory. Neuron. 1995;14:477–485. doi: 10.1016/0896-6273(95)90304-6. [DOI] [PubMed] [Google Scholar]
- Goldman MS, Levine JH, Major G, Tank DW, Seung HS. Robust persistent neural activity in a model integrator with multiple hysteretic dendrites per neuron. Cereb Cortex. 2003;13:1185–1195. doi: 10.1093/cercor/bhg095. [DOI] [PubMed] [Google Scholar]
- Koulakov AA. Properties of synaptic transmission and the global stability of delayed activity states. Network. 2001;12:47–74. [PubMed] [Google Scholar]
- Koulakov AA, Raghavachari S, Kepecs A, Lisman JE. Model for a robust neural integrator. Nat Neurosci. 2002;5:775–782. doi: 10.1038/nn893. [DOI] [PubMed] [Google Scholar]
- Lin Y, Skeberdis VA, Francesconi A, Bennett MV, Zukin RS. Postsynaptic density protein-95 regulates NMDA channel gating and surface expression. J Neurosci. 2004;24:10138–10148. doi: 10.1523/JNEUROSCI.3159-04.2004. [DOI] [PMC free article] [PubMed] [Google Scholar]
- Lisman JE, Fellous JM, Wang XJ. A role for NMDA-receptor channels in working memory. Nat Neurosci. 1998;1:273–275. doi: 10.1038/1086. [DOI] [PubMed] [Google Scholar]
- Machens CK, Romo R, Brody CD. Flexible control of mutual inhibition: a neural model of two-interval discrimination. Science. 2005;307:1121–1124. doi: 10.1126/science.1104171. [DOI] [PubMed] [Google Scholar]
- Major G, Tank D. Persistent neural activity: prevalence and mechanisms. Curr Opin Neurobiol. 2004;14:675–684. doi: 10.1016/j.conb.2004.10.017. [DOI] [PubMed] [Google Scholar]
- Mazurek ME, Roitman JD, Ditterich J, Shadlen MN. A role for neural integrators in perceptual decision making. Cereb Cortex. 2003;13:1257–1269. doi: 10.1093/cercor/bhg097. [DOI] [PubMed] [Google Scholar]
- Miller P, Brody CD, Romo R, Wang XJ. A recurrent network model of somatosensory parametric working memory in the prefrontal cortex. Cereb Cortex. 2003;13:1208–1218. doi: 10.1093/cercor/bhg101. [DOI] [PMC free article] [PubMed] [Google Scholar]
- Pastor AM, Torres B, Delgado-Garcia JM, Baker R. Discharge characteristics of medial rectus and abducens motoneurons in the goldfish. J Neurophysiol. 1991;66:2125–2140. doi: 10.1152/jn.1991.66.6.2125. [DOI] [PubMed] [Google Scholar]
- Robinson DA. The effect of cerebellectomy on the cat's bestibulo-ocular integrator. Brain Res. 1974;71:195–207. doi: 10.1016/0006-8993(74)90961-5. [DOI] [PubMed] [Google Scholar]
- Robinson DA. Integrating with neurons. Annu Rev Neurosci. 1989;12:33–45. doi: 10.1146/annurev.ne.12.030189.000341. [DOI] [PubMed] [Google Scholar]
- Romo R, Brody CD, Hernandez A, Lemus L. Neuronal correlates of parametric working memory in the prefrontal cortex. Nature. 1999;399:470–473. doi: 10.1038/20939. [DOI] [PubMed] [Google Scholar]
- Rosen MJA. A theoretical neural integrator. IEEE Trans Biomed Eng. 1972;19:362–367. doi: 10.1109/TBME.1972.324139. [DOI] [PubMed] [Google Scholar]
- Seung HS, Lee DD, Reis BY, Tank DW. Stability of the memory of eye position in a recurrent network of conductance-based model neurons. Neuron. 2000a;26:259–271. doi: 10.1016/s0896-6273(00)81155-1. [DOI] [PubMed] [Google Scholar]
- Seung HS, Lee DD, Reis BY, Tank DW. The autapse: a simple illustration of short-term analog memory storage by tuned synaptic feedback. J Comput Neurosci. 2000b;9:171–185. doi: 10.1023/a:1008971908649. [DOI] [PubMed] [Google Scholar]
- Shadlen MN, Newsome WT. Neural basis of a perceptual decision in the parietal cortex (area LIP) of the rhesus monkey. J Neurophysiol. 2001;86:1916–1936. doi: 10.1152/jn.2001.86.4.1916. [DOI] [PubMed] [Google Scholar]
- Wang XJ. Synaptic basis of cortical persistent activity: the importance of NMDA receptors to working memory. J Neurosci. 1999;19:9587–9603. doi: 10.1523/JNEUROSCI.19-21-09587.1999. [DOI] [PMC free article] [PubMed] [Google Scholar]
Associated Data
This section collects any data citations, data availability statements, or supplementary materials included in this article.


