

Abstract
We investigate the dependence of fiber brightness on three-dimensional fiber orientation when imaging biopolymer networks with confocal reflection microscopy (CRM) and confocal fluorescence microscopy (CFM). We compare image data of fluorescently labeled type I collagen networks concurrently acquired using each imaging modality. For CRM, fiber brightness decreases for more vertically oriented fibers, leaving fibers above ∼50° from the imaging plane entirely undetected. As a result, the three-dimensional network structure appears aligned with the imaging plane. In contrast, CFM data exhibit little variation of fiber brightness with fiber angle, thus revealing an isotropic collagen network. Consequently, we find that CFM detects almost twice as many fibers as are visible with CRM, thereby yielding more complete structural information for three-dimensional fiber networks. We offer a simple explanation that predicts the detected fiber brightness as a function of fiber orientation in CRM.
Main Text
Collagen is a ubiquitous protein in mammals that forms the primary component of connective tissue in the interstitial space between cells. The majority of collagen is type I and, therefore, reconstituted collagen type I gels often serve as a model environment for in vitro cell experiments in fields ranging from cancer research to tissue engineering. On the length scale of a cell, collagen type I appears as a branched network of fibers, each of which can be resolved with confocal microscopy allowing both the network and individual cells to be imaged (1). This enables the effects of cell migration, cell contraction, and force exertion to be directly visualized (1–3). However, to understand how cell-matrix interaction depends on the local environment, it is crucial to image the exact three-dimensional fiber environment of the cell (1–3). The commonly used and well-accepted technique for imaging collagen networks is confocal reflection microscopy (CRM) (1–3), which uses back-scattered light to form an image (4,5). This method has been used to obtain quantitative information about the morphology of collagen networks, such as mesh size, location, and orientation of the fibers (1,3–11). Some of these studies report surprising structural properties of reconstituted in vitro collagen networks; perhaps most surprising is that the gels are anisotropic and composed of fibers primarily aligned with the imaging plane (3,4,6). This behavior may arise from intrinsic properties of the sample. Alternatively, it is possible that it results from the imaging method itself. To determine the origin of this effect, it is essential to use an alternative imaging modality to independently examine the structure of collagen networks. One possible technique is confocal fluorescence microscopy (CFM), which uses laser light to excite fluorophores in an imaging sample and forms an image from the emitted light. Many other biopolymers are often fluorescently tagged and imaged with CFM (12). However, it is rarely applied to collagen and has never been used to study the detailed fiber structure of type I networks.
In this letter, we evaluate CFM for imaging three-dimensional collagen networks. We simultaneously collect data using CRM and CFM on fluorescently labeled reconstituted collagen type I networks and analyze the average orientations of detected fibers as well as their relative individual brightness. We find that fiber brightness decreases in CRM with increasing fiber angle, leaving fibers that are above an angle of ∼50° from the imaging plane entirely undetected. Thus, the collagen structure appears aligned with the imaging plane. In contrast, CFM detects fibers with similar brightness, independent of their orientation, thereby exposing almost twice as many fibers and revealing an isotropic network. Comparing the two imaging modalities, we find CFM yields a more complete representation of the network structure. We also offer a simple explanation that accurately predicts the detected fiber brightness as a function of fiber orientation in CRM.
We reconstitute collagen gels (0.4 mg/mL) from a 1:10 mixture of TAMRA-labeled collagen and unlabeled collagen in square borosilicate capillary tubes. We collect stacks of optical image sections with a model No. SP5 confocal microscope (63×/NA1.2 water immersion objective; Leica, Solms, Germany) using reflection and fluorescence confocal microscopy, concurrently. We generate three-dimensional data sets and analyze these with two different approaches: First, we apply a grayscale moments analysis to quantify the average alignment of objects throughout the sample. Second, we quantify the origin of anisotropy by measuring individual fiber brightness for varying three-dimensional fiber orientations.
The difference between CFM and CRM can be qualitatively illustrated by examining typical confocal images (x-y planes). The fluorescent images show small regions of high intensity (Fig. 1 B, red circles) that are not present in the reflection images (Fig. 1 A, Movie S1 in the Supporting Material). These regions occur when the imaging plane bisects vertically oriented fibers. A maximum intensity projection of planes oriented perpendicular to the focal plane (x-z planes) for CFM shows a large number of fibers with no preferential direction (Fig. 1 E). In contrast, the same region imaged using CRM shows only a fraction of the fibers present; in particular, only the subset of fibers aligned with the (horizontal) imaging plane (Fig. 1 D). This indicates that CFM detects a more complete network structure, whereas CRM only detects an aligned subset.
Figure 1.
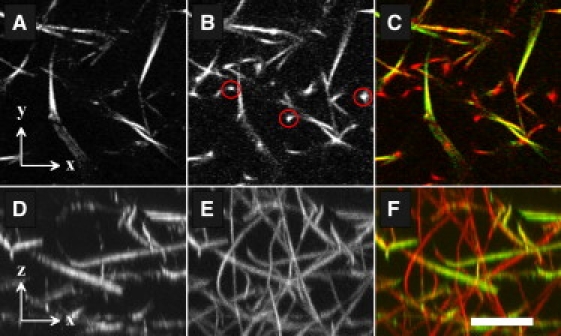
The same area of a collagen network is simultaneously imaged using CRM and CFM. (A) A typical confocal image from CRM. (B) The corresponding image as determined by CFM. The red circles indicate some fibers present in the fluorescence data that do not appear in the reflection image. (C) An overlay of panels A (green) and B (red). (D) A projection of 50 x,z slices along the y axis using CRM image data. (E) Equivalent projection of CFM data illustrating the abundance of fibers in the z direction. (F) An overlay of panels D (green) and E (red). Scale bar: 10 μm.
To quantify the degree of alignment in the data sets, we characterize the average three-dimensional orientations of the detected fibers from both CRM and CFM using a grayscale moments analysis of the raw data. The principal axis of the second moment of the intensity distribution is calculated on small boxes covering the data set. This yields a histogram of orientations of all objects throughout the sample. We characterize the alignment using the azimuthal angle ϕ defined within the imaging plane (x-y plane) and the polar angle θ defined with respect to the perpendicular axis (z axis). The area of a surface element for a unit sphere is sinθdθdϕ; therefore, an isotropic network will show a sine distribution for θ-values and a uniform distribution for ϕ-values. We find the distribution of ϕ using both imaging modalities to be flat, indicating that the fibers appear isotropic within the focal plane (Fig. 2 inset, open symbols). In contrast, the corresponding θ distributions show stark discrepancies. Whereas the fluorescence data follows the sine distribution expected for an isotropic network (Fig. 2, open triangles and light-shaded line), the reflection data deviate strongly from this expectation (Fig. 2, open circles). The CRM results suggest that the network is anisotropic.
Figure 2.
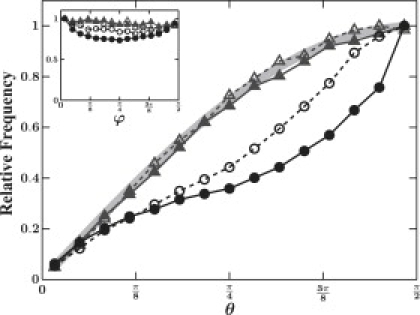
Relative frequency of the moment angle θ for CFM data (triangles) and CRM data (circles) in both rotated (solid) and nonrotated (open) samples. (Light-shaded line) Sine distribution expected for an isotropic sample. A θ-value of π/2 corresponds to a fiber oriented in the imaging plane. The inset shows the corresponding ϕ distributions.
To unambiguously assess whether the apparent anisotropy seen in CRM is an imaging artifact and not an intrinsic sample property, we rotate the sample by 90°. For both imaging modalities, the data from the rotated case closely match those of the original sample before reorientation (Fig. 2, solid symbols). Because the anisotropy in the CRM data does not similarly rotate, the apparent alignment must arise from a bias in the CRM imaging technique itself.
To determine the origin of the anisotropy, we quantify individual fiber brightness as a function of its orientation. We identify individual fibers, their orientations, and their corresponding intensities using both imaging techniques. A careful examination by eye reveals that whenever a fiber is present in CRM it is also detected in CFM; in contrast, not all fibers seen with CFM are visible with CRM (Fig. 1, A–F, Movie S1). Therefore, we use the CFM data to find a central line through each fiber and build a three-dimensional line representation of the network structure (13). We find a median intensity for each fiber from both CFM and CRM data by evaluating the intensity values of the corresponding raw data at the positions given by the line representation segments. In the CRM case, we find fibers parallel to the imaging plane have the highest intensity with a decrease to background levels for θ smaller than ∼40° (Fig. 3, circles). This shows that below a certain angle, entire fibers are not seen using CRM. In contrast, fiber intensities in CFM only show a slight increase as θ approaches 0 (Fig. 3, triangles). We attribute this slight increase to the anisotropic imaging volume of the confocal system; thus, for more vertically oriented fibers, a larger number of fluorophores contributes to the detected intensity. As a result, for an isotropic three-dimensional network, CFM will detect almost twice as many fibers as CRM, revealing much more complete structural information.
Figure 3.
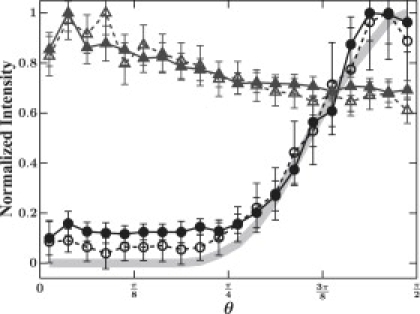
The background-corrected, normalized intensity of individual fibers as a function of their θ-angle for CFM (triangles) and CRM (circles) in both the rotated (open) and nonrotated (solid) cases. The shaded line shows the expected values from theory, using the measured laser light intensity profile. Error bars correspond to the standard error of the mean.
To account for the decrease in intensity as a function of fiber angle in CRM, we treat a fiber as a flat reflective plane tilted about an angle θ from the axis perpendicular to the imaging plane. This plane is illuminated by an upright cone of focused laser light; the reflected light forms another cone with the same opening angle as the incoming light cone, but oriented toward the direction of 2θ (see Fig. S1). The light that is collected by the confocal system is determined by the numerical aperture of the objective and the refractive index of the immersion medium. By accounting for the spatial intensity distribution of the excitation light, we can predict the relative amount of light collected for a given fiber angle; we calculate the intersection between the cone of deflected light and the detectable volume. The results of this analysis, using the known numerical aperture of the objective and the measured intensity profile (see Supporting Material) of the excitation laser, are shown in Fig. 3 (light-shaded line). The prediction shows excellent agreement with the measured intensity values.
Previous investigations of the three-dimensional orientation of collagen fibers imaged using CRM show an apparent fiber alignment consistent with our observations (3,4,6). Our CRM results also suggest that measurements of the shape and size of the pores may be biased toward larger fiber spacing due to the missing fibers in the images. This will also affect measurements of the mesh size, including those obtained from two-dimensional images. In fact, measurements of pore size that compare CRM images with diffusion measurements of probe particles suggest that the CRM images overestimate pore size (3,7,8). Finally, our explanation for the loss of fiber brightness in CRM is not limited to collagen networks; it also predicts a similar loss of vertical fibers in other biopolymer networks. Some previous studies on fibrin have coated the fibers with 5-nm gold particles before imaging with CRM (14). This intriguing label might enhance the reflective properties of the sample making CRM more accurate; however, further investigations are necessary to confirm this. Our findings suggest measurements obtained with CRM must be reviewed with care. During this process, our simple explanation may be useful in developing tools to reverse, or at least account for, the apparent anisotropy seen in CRM data.
Supporting Material
One figure and one movie are available at http://www.biophysj.org/biophysj/supplemental/S0006-3495(09)01631-2.
Supporting Material
Acknowledgments
This work was supported by the National Science Foundation (contracts No. DMR-0602684 and CTS-0505929) and the Harvard Materials Research Science and Engineering Center (contract No. DMR-0820484). L.M.J. was supported by the National Science Foundation Integrative Graduate Education and Research Traineeship grant (DGE No. 0221682). S.M. received travel funding from Deutscher Akademischer Austausch Dienst and Studienstiftung des Deutschen Volkes.
References and Footnotes
- 1.Pedersen J.A., Swartz M.A. Mechanobiology in the third dimension. Ann. Biomed. Eng. 2005;33:1469–1490. doi: 10.1007/s10439-005-8159-4. [DOI] [PubMed] [Google Scholar]
- 2.Friedl P., Wolf K. Tumor-cell invasion and migration: diversity and escape mechanisms. Nat. Rev. Cancer. 2003;3:362–374. doi: 10.1038/nrc1075. [DOI] [PubMed] [Google Scholar]
- 3.Friedl P., Maaser K., Zänker K.S. Migration of highly aggressive MV3 melanoma cells in 3-dimensional collagen lattices results in local matrix reorganization and shedding of α2 and β1 integrins and CD44. Cancer Res. 1997;57:2061–2070. [PubMed] [Google Scholar]
- 4.Friedl P., Bröcker E.-B. Biological confocal reflection microscopy. In: Häder Donat P., editor. Image Analysis: Methods and Applications. CRC Press; Boca Raton, FL: 2000. [Google Scholar]
- 5.Voytik-Harbin S.L., Rajwa B., Robinson J.P. Three-dimensional imaging of extracellular matrix and extracellular matrix-cell interactions. In: Darzynkiewicz Z., editor. Methods in Cell Biology. Vol. 63. Academic Press; New York: 2001. [DOI] [PubMed] [Google Scholar]
- 6.Wu J., Rajwa B., Robinson J.P. Analysis of orientations of collagen fibers by novel fiber-tracking software. Microsc. Microanal. 2003;9:574–580. doi: 10.1017/S1431927603030277. [DOI] [PubMed] [Google Scholar]
- 7.Erikson A., Andersen H.N., Davies Cde. L. Physical and chemical modifications of collagen gels: impact on diffusion. Biopolymers. 2008;89:135–143. doi: 10.1002/bip.20874. [DOI] [PubMed] [Google Scholar]
- 8.Ramanujan S., Pluen A., Jain R.K. Diffusion and convection in collagen gels: implications for transport in the tumor interstitium. Biophys. J. 2002;83:1650–1660. doi: 10.1016/S0006-3495(02)73933-7. [DOI] [PMC free article] [PubMed] [Google Scholar]
- 9.Roeder B.A., Kokini K., Voytik-Harbin S.L. Tensile mechanical properties of three-dimensional type I collagen extracellular matrices with varied microstructure. J. Biomech. Eng. 2002;124:214–222. doi: 10.1115/1.1449904. [DOI] [PubMed] [Google Scholar]
- 10.Brightman A.O., Rajwa B.P., Voytik-Harbin S.L. Time-lapse confocal reflection microscopy of collagen fibrillogenesis and extracellular matrix assembly in vitro. Biopolymers. 2000;54:222–234. doi: 10.1002/1097-0282(200009)54:3<222::AID-BIP80>3.0.CO;2-K. [DOI] [PubMed] [Google Scholar]
- 11.Petroll W.M. Differential interference contrast and confocal reflectance imaging of collagen organization in three-dimensional matrices. Scanning. 2006;28:305–310. doi: 10.1002/sca.4950280602. [DOI] [PubMed] [Google Scholar]
- 12.Goldman R.D., Spector D.L. Cold Spring Harbor Laboratory Press; Cold Spring Harbor, New York: 2005. Live Cell Imaging: A Laboratory Manual. [Google Scholar]
- 13.Mickel W., Münster S., Schröder-Turk G.E. Robust pore size analysis of filamentous networks from three-dimensional confocal microscopy. Biophys. J. 2008;95:6072–6080. doi: 10.1529/biophysj.108.135939. [DOI] [PMC free article] [PubMed] [Google Scholar]
- 14.Collet J.P., Park D., Weisel J.W. Influence of fibrin network conformation and fibrin fiber diameter on fibrinolysis speed: dynamic and structural approaches by confocal microscopy. Arterioscler. Thromb. Vasc. Biol. 2000;20:1354–1361. doi: 10.1161/01.atv.20.5.1354. [DOI] [PubMed] [Google Scholar]
Associated Data
This section collects any data citations, data availability statements, or supplementary materials included in this article.