

Abstract
Four x-ray crystal structures of prokaryotic homologs of ligand-gated ion channels have recently been determined: ELIC from Erwinia chrysanthemi, two structures of a proton-activated channel from Gloebacter violaceus (GLIC1 and GLIC2) and that of the E221A mutant (GLIC1M). The availability of numerous structures of channels in this family allows for aspects of channel gating and ion conduction to be examined. Here, we determine the likely conduction states of the four structures as well as IV curves, ion selectivity, and steps involved in ion permeation by performing extensive Brownian dynamics simulations. Our results show that the ELIC structure is indeed nonconductive, but that GLIC1 and GLIC1M are both conductive of ions with properties different from those seen in experimental studies of the channel. GLIC2 appears to reflect an open state of the channel with a predicted conductance of 10.8–12.4 pS in 140 mM NaCl solution, which is comparable to the experimental value 8 ± 2 pS. The extracellular domain of the channel is shown to have an important influence on the channel current, but a less significant role in ion selectivity.
Introduction
Ligand-gated ion channels (LGICs) are a family of transmembrane ion channels that are triggered to open or close by the binding of small molecular ligands such as acetylcholine, serotonin, γ-aminobutyric acid, and glycine. They are fast-responding channels that play a critical role in the transmission of electrical signals between nerve cells as well as between nerve and muscle cells (1–5). Knowledge of their structure, gating, and selectivity properties is, therefore, important for understanding how they carry out their function as well as how malfunction can lead to diseases such as myasthenia and epilepsy (6). The nicotinic acetylcholine receptor (nAChR), a typical LGIC found at the neuromuscular junction, is the best characterized member of the family and has attracted much attention in recent years. Until recently, it was the only member of the family for which we had near-atomic resolution structural data, courtesy of electron microscopy images of a closed state nAChR from the Torpedo electric ray obtained at 4.0 Å resolution (7,8). Consequently, this has been the focus of extensive simulation studies aimed at explaining the conformational changes and steps involved in channel gating, the process of ion conduction, and the basis of the channels' cation selectivity (9–17). However, such studies have been hindered by the absence of an unambiguous high resolution structure, especially one of a channel in its open state.
To overcome this, attention has recently focused on homologous proteins from bacteria (prokaryotic LGICs) that have many similarities with the eukaryotic channels (4,18). Detailed analysis of these channel has obvious implications for the eukaryotic proteins, and it is generally easier to express, purify, and crystallize the bacterial channels. To this end, two groups have recently obtained a series of atomic resolution structures of prokaryotic pentameric LGIC which display similar topology and structural features to nAChR (1–3). Each is composed of five homologous subunits forming two distinct domains, the extracellular (EC) domain analogous to the ligand-binding domain in eukaryotic channels, and the transmembrane (TM) domain, which spans the cell membrane forming the narrowest part of the pore (Fig. 1).
Figure 1.
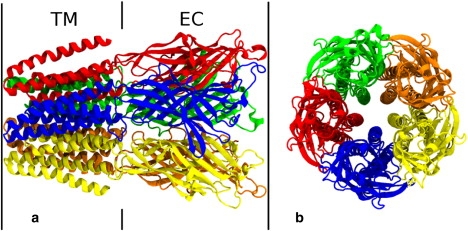
Side (a) and top (b) views of the crystal structure of GLIC2. Protein subunits are individually colored, and the transmembrane (TM) and extracellular (EC) domains are noted.
Although similar in many respects, the four crystal structures that have been determined differ in important ways, one of which is the pore radius as seen in Fig. 2. The first structure, from Erwinia chrysanthemi and known as ELIC (1), has a minimum radius of 1.2 Å located near the extracellular side of the membrane, as also shown in Fig. 3 a. Because ELIC has such a small radius and is lined with many nonpolar residues, it is expected to be nonconductive, representing a closed state structure—although many differences are apparent to the supposed closed state structures of nAChR. The remaining three structures are all of a homologous proton activated channel isolated from Gloebacter violaceus (4), crystallized at low pH, and differing from the ELIC structure in important ways. GLIC1 (2) has a narrow constriction of <0.5 Å radius near the intracellular end of the channel formed by five glutamate residues pointing into the pore (see Figs. 2 and 3). Despite its narrow dimensions it is suspected that the channel may still be conductive to small ions such as Na+. Mutation of the five glutamates to alanine (E221A) produces a wider pore (GLIC1M) with a minimum radius of 2.3 Å (2), although the mutation of five ionizable residues must no doubt have an influence on ion permeation. The final structure, GLIC2, is suspected to be an open state of the channel due to its wider pore, with a minimum radius of 2.7 Å also near the intracellular end of the channel (3). Whereas the conductance of the GLIC channel has been previously determined from single channel patch-clamp recordings to be 8 ± 2 pS (4), there is no clear indication other than the radius of the pores whether any of the crystallized structures represent the open state of the protein. Theoretical studies hold the potential for addressing this issue.
Figure 3.
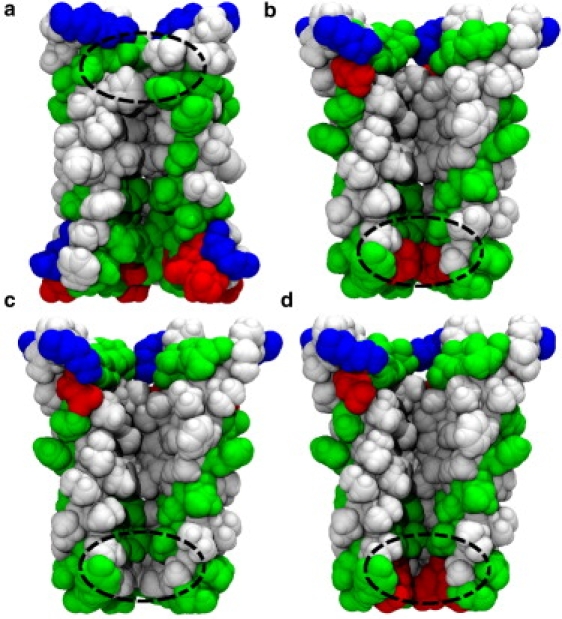
The α2 helices forming the pore of the TM-domain for (a) ELIC, (b) GLIC1, (c) GLIC1M, and (d) GLIC2. The front subunit is removed for clarity. The protein is colored according to the residue type: nonpolar in white, polar in green (online) or gray (print), basic in blue (online) or dark (print), and acidic in red (online) or dark (print). The constricted regions of the pore are marked with a dashed ellipse.
Figure 2.
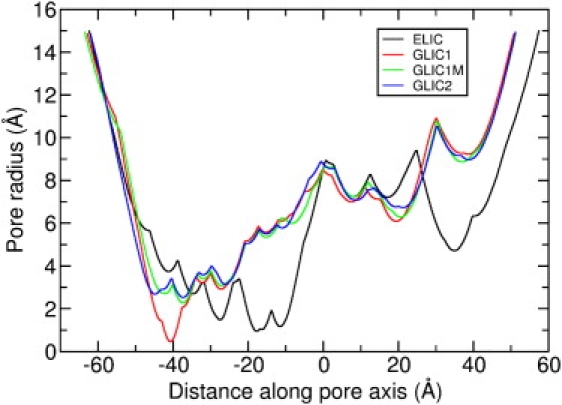
Pore radius for each crystal structure as a function of position along the channel axis.
Cheng et al. (19) performed molecular dynamics simulation studies on the ELIC structure. They found that the pore is completely dehydrated from the channel center to the extracellular end throughout their simulation, implying that it is probably nonconductive due to the large dehydration barrier that would be faced by ions passing through this region—the so-called hydrophobic gating mechanism (15,17,20,21). Despite this study, it would be desirable to have stronger evidence of the state of this channel by directly determining its conductance. In addition, knowledge of the conduction states and features of conduction events for the other three structures is still absent. To address these issues, we performed Brownian dynamics (BD) simulations to determine the likely current that would pass through each of the crystallized structures. The Brownian dynamics method is particularly suited to this purpose, because it allows for microsecond simulation times to be easily obtained, allowing for direct determination of the channel conductance under physiological conditions yet still maintaining microscopic physical details of the system. In addition, we are able to witness the steps involved in ion conduction in GLIC2 and examine the influence of the extracellular domain on the current and selectivity.
Methods
Brownian dynamics simulations
In BD, the motion of individual ions is traced explicitly, but the water and protein atoms are treated as continuous dielectric media (22,23), an approach that has been successfully applied to determine channel currents in the nAChR and other channels (11,15,24). In these simulations, the channel is taken to be a rigid structure during the simulation, and partial charges are assigned to the protein using the CHARMM27 all-atom parameter set (25). Therefore, the flexibility of the protein cannot be included in the current BD simulations. The pore is centered on the z axis and a smooth water-protein boundary of the channel is defined by rolling a 1.4 Å sphere (representing the water molecule) along the surface. The boundary is symmetrized by taking only the minimum radius at each z-coordinate, and then the curve is rotated by 360° to obtain a three-dimensional channel structure with radial symmetry. A number of Na+ and Cl− ions are placed in cylindrical reservoirs of radius 30 Å at each end of the channel which mimic the intra- and extracellular solution, and the height of the cylinder is adjusted to bring the solution to the desired concentration. The motion of these ions under the influence of electric and random forces is then traced using the Langevin equation. The total force acting on each ion in the assembly is calculated and then new positions are determined for the ions a short time later. Electrostatic forces are calculated by assigning dielectric constants to the protein, channel interior, and bulk water and solving Poisson's equation using an iterative method (26). Although the dielectric constant in the channel is uncertain, we follow previous studies that have shown the best results in channels of this dimension are obtained assuming dielectric constants of 2 for the protein and 60 for the channel interior (27–30). Our previous tests have shown that this choice is appropriate for nAChR as well (11). It should be noted that the discrete water behavior, such as partial or transient hydration of ions, is not considered explicitly, but in an approximate and average manner by assigning the dielectric constant in the channel. This is an intrinsic limitation of the method, and a detailed analysis of this will require MD simulations. Diffusion coefficients are taken to be 1.33 × 10⁻⁹ m2/s for Na+ and 2.03 × 10⁻⁹ m2/s for Cl−, respectively, and are reduced to half of the values in the pore region, following our previous simulation studies (11). We also did test simulations for GLIC2, setting the diffusion coefficient in the channel to 0.2- or 0.8-times of the bulk value. The resulting conductances are within 30% of the value found using a diffusion coefficient of half the bulk value, which is consistent with the earlier systematic study of Chung et al. (27). In addition, the same steps in conduction are observed in these cases. Therefore, we believe the choice of the diffusion coefficients is appropriate in our production BD simulations. The current is determined directly from the number of ions passing through the channel. The membrane potential is achieved by applying a uniform electric field to the system and is incorporated into the solution of Poisson's equation. More details about the BD simulation methodology can be found in previous studies (15,22,23).
Because the EC-domain of each channel is wide and negatively charged, a number of ions can be expected to enter this region, influencing the local electrostatic environment and current as shown in our previous studies (11). This can also act to deplete ions from the reservoirs during the simulations if a fixed number of ions is used. The best way to avoid this is to perform grand canonical Monte Carlo BD simulations, in which the desired ion concentrations in the reservoirs are maintained by creating or destroying ions near the edge of the reservoirs in a random manner that is dependent on the local electrochemical potential (31). A downside of these simulations is that they increase the computational time required to conduct each simulation and prevent the ion trajectories from being easily visualized. As an alternative, we used grand canonical Monte Carlo simulations to determine the equilibrium ion concentrations, and then fixed the ion numbers for future simulations. The ion distribution reached equilibrium within 100 ns for each structure, and a large number of ions was found to reside in the EC-domain of each: 18 Na+ and 5 Cl− for ELIC; 26 Na+ and 4 Cl− for GLIC1; 23 Na+ and 5 Cl− for GLIC1M; and 24 Na+ and 4 Cl− for GLIC2, respectively. Further simulations were run with the above numbers of ions in the upper reservoir in addition to 16 Na+ and Cl− pairs in both the extracellular reservoir and intracellular reservoir. Once the additional ions enter the EC domain, the reservoirs are left with 300 mM NaCl. To determine the current at each membrane potential, we used a 1.4-μs simulation.
Results and Discussion
I/V curves for each structure
One advantage of the BD method over MD simulation is that simulations can be run for long enough to witness many conduction events at physiological conditions, directly yielding I/V curves and enabling the conductance of each channel to be determined. I/V curves for ELIC, GLIC1, GLIC1M, and GLIC2 in 300 mM NaCl solution are shown in Fig. 4. To obtain this we applied a series of electric field values, which correspond to the transmembrane potential ranging from −295 to 295 mV. Within this potential range, ELIC is indeed nonconductive, as shown in Fig. 4 (circles). This is reasonable considering the narrowness and nature of the TM section of the pore. As can be seen from Fig. 3 a, there is a hydrophobic region ranging from the center to the extracellular entrance of the TM-domain, and the radius of this region is very narrow according to Fig. 2 (black line). The minimum radius of the channel, 1.17 Å, is also located in the hydrophobic region, around the extracellular entrance. Therefore, the channel can be expected to be nonconductive according to the hydrophobic gating mechanism, despite being just wide enough for Na+ to pass. To show where ions move within the pore, we divide the ELIC channel into 100 layers and plot the average ion numbers in each in Fig. 5 a. As can be seen, although many ions are able to reside within the EC domain, there is a big gap in the ion distribution ranging from z = −17 to z = −2 Å, which is just the narrow hydrophobic region in the upper part of the TM domain. This region is indeed closed to ions, as also supported by the MD simulations of Cheng et al. (19). The nonconductive nature of the ELIC structure is confirmed by our BD simulations.
Figure 4.
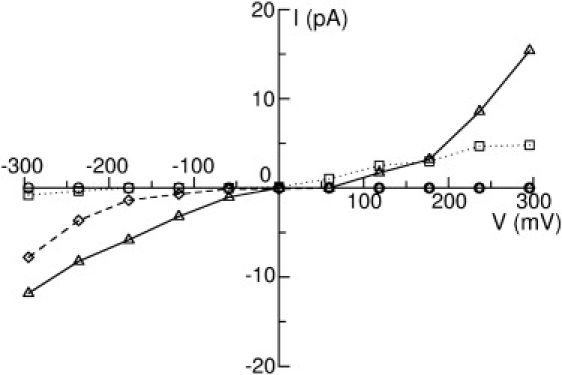
I/V curves of the four crystal structures in 300 mM NaCl solution: (circles) for ELIC, (dotted line with squares) for GLIC1, (dashed line with diamond) for GLIC1M, and (solid line with triangles) for GLIC2. The error bars are smaller than the size of the symbols, and therefore not shown here.
Figure 5.
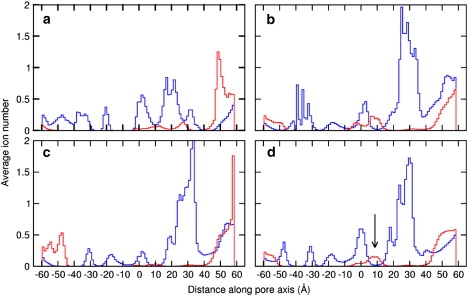
Na+ (solid blue) and Cl− (dashed red) distribution in the (a) ELIC, (b) GLIC1, (c) GLIC1M, and (d) GLIC2 channel interior. The location of Cl− in the EC domain of GLIC2 is highlighted by the arrow.
Although GLIC1 also has a very small minimum radius (0.46 Å), the shape of the pore is distinctly different to ELIC. GLIC1 shows a funnel-shaped channel with a linearly decreasing diameter narrowing to the intracellular entry of the TM-domain (2). As a consequence, the hydrophobic region from the center of the pore to the extracellular entry of the TM-domain has a relatively wider radius than in ELIC (>3 Å), which might allow the permeation of the ions. Polar or charged residues line the narrowest sections of the pore, which may assist the permeation of partially hydrated ions through the narrow portion of the pore. For this reason, Hilf and Dutzler (2) suspect the channel to be conductive. Our simulation results (dotted line with squares in Fig. 4) show that it is indeed conductive when under positive transmembrane potentials. The conductance within the biological potentials (0–100 mV) is ∼21 pS, but the channel has a very low conductance when a negative transmembrane potential is applied.
The E221A mutant, GLIC1M, maintains a funnel shape but is wider than GLIC1 and has also been suspected to be conductive. Surprisingly, our simulation results indicate that it is also strongly rectifying but in a manner opposite to that of the wild-type structure, conducting only under a negative transmembrane potential, as shown in Fig. 4 (dashed line with diamonds). This rectification most likely arises due to the extremely low concentration of Na+ at the intracellular end of the channel, as evidenced in Fig. 5 c. This low concentration on one side of the rate-limiting barrier (see below) makes the movement of Na+ outward through the channel unlikely. A similar low concentration of Cl− at the other end of the TM pore also makes the inward permeation of Cl− rare. The conductance of GLIC1M with negative transmembrane potentials is ∼5.8 pS.
The shape and pore radius of GLIC2 are very similar to those of GLIC1M; however, the presence of the glutamate residues at the intracellular end of the pore could influence ion permeation. Interestingly, our simulation results show that GLIC2 conducts ions under both positive and negative transmembrane potentials, as shown in Fig. 4 (solid line with triangles). The conductance in 300 mM NaCl solution is ∼27 pS.
Bocquet et al. (4) have measured the ion conductance of GLIC with single channel patch-clamp recordings, finding it to be 8 ± 2 pS in 140 mM NaCl solution. To examine whether our model and simulation method can generate comparable results to experimental values, we performed additional BD simulations for GLIC2 in 140 mM NaCl solution. The I/V curve for this case is shown in Fig. 6 (solid line with circles). As can be seen, GLIC2 is still conductive under these conditions and the conductance is found to be between 10.8 and 12.4 pS under negative biological transmembrane potential, which is quite close to the experimental value. As expected, the conductance in 140 mM NaCl solution is smaller than that in 300 mM NaCl solution. As in previous studies, the current can be expected to increase with increasing concentration before reaching a saturation value.
Figure 6.
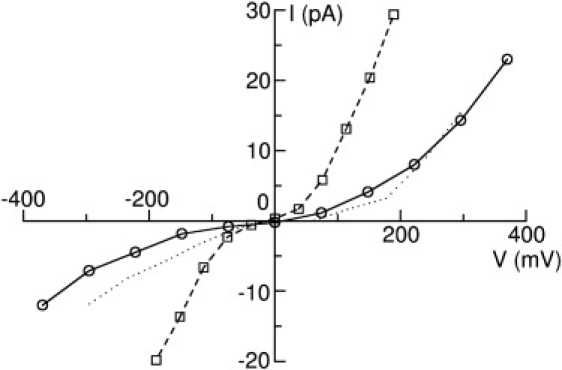
I/V curves for GLIC2 in 140 mM NaCl solution (solid line with circles), and for TM-domain alone for GLIC2 in 300 mM NaCl solution (dashed line with squares). The I/V curve for GLIC2 in 300 mM NaCl solution is also shown with the dotted line for comparison.
Combining these results, we suspect that the ELIC structure represents a closed state of the channel, whereas GLIC2 is likely to be an open conformation. Comparison of these two structures is, therefore, likely to yield information on the conformational changes the channels undergo upon activation. It seems likely that the channel gate is located in the extracellular half of the TM domain in the regions lined by nonpolar residues. We agree with Bocquet et al. (3) and Hilf and Dutzler (2) that the opening of the pore probably involves the tilting of the α-helices to the funnel shape, widening the upper nonpolar part of the TM domain and allowing the permeation of ions. The status of GLIC1 is less clear. Although ions do permeate through the pore, the conductance is significantly less than seen experimentally, and it is likely that the position of the glutamic acid residue E221 has been influenced by the low intracellular pH during crystallization. And although GLIC1M is wider, it can be expected to have differing conductance properties due to the significantly altered charge on the pore lining.
As GLIC is known to be proton-dependent and our studies show different permeation behavior after the E221A mutation, it is of interest to see how changing the charge of the E221 residue (such as caused by protonation of some of the residues) will affect the channel current. To do this we performed additional BD simulations on GLIC2 in which the charge on E221 is manually changed from 1.0 e to 0, as shown in Fig. 7. Under a positive potential a reduction in the charges on E221 leads to a uniform decrease in conductance from 52 pS to 0.8 pS (blue line with circles). In contrast, when a negative potential is applied, the conductance first decreases and then increases, with reducing charge in E221 (red line with squares). When the charge on E221 is zero, the GLIC2 channel is only conductive under a negative transmembrane potential, which is consistent with the results of GLIC1M. It seems that the charges on E221 play a very important role in determining the conductance and rectification behavior of the GLIC channel, as discussed further below. This also implies that the protonation state of E221 might contribute to the gating behavior and pH sensitivity of the pore, a point that needs further study in the future.
Figure 7.
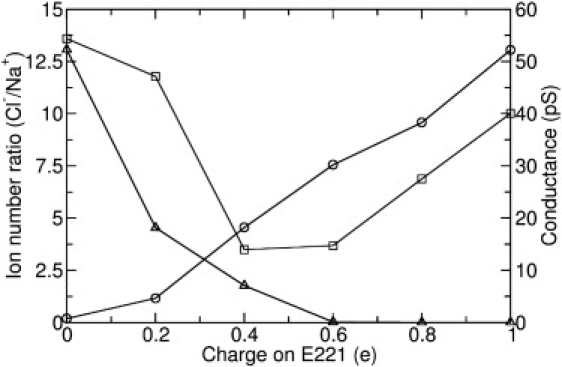
The effect of E221 charge on the channel conductance and selectivity. (circles) Conductance of GLIC2 under 295 mV potential in 300 mM NaCl solution (right-hand axis). (squares) Conductance of GLIC2 under −295 mV potential. (Left-hand axis, triangles) Ratio of the numbers of Cl− and Na+ that conducted through the channel.
Ion selectivity
To examine the ion selectivity of the channel, we counted the number of Na+ and Cl− that translocated through each channel. When 118 mV transmembrane potential is applied, GLIC1 is found to be extremely selective; indeed, no anions pass through the pore during the simulations. A similar scenario is found for GLIC2, which is 100% cation-selective under either positive or negative potentials. When −118 mV is applied to GLIC1M, however, the Na+/Cl− selectivity is only 2:1. Obviously, the E221A mutation significantly reduces the cation selectivity of the pore. This is understandable, as five ionizable (and probably negatively charged) residues have been removed from the narrow part of the pore (see Fig. 3, b and c). The cation selectivity of GLIC2 is consistent with experimental results.
We have also examined the effect of charges on E221 on the property of selectivity. The results are shown in Fig. 7 (black line with triangles). As can be seen, when the charges on E221 is >0.6 e, the channel is absolutely cation-selective, because the ratio of Cl−/Na+ ions conducted is close to 0. However, when the charges on E221 are decreasing from 0.6 e to 0, the selectivity of GLIC changes from cation-selective to anion-selective. For example, when the charges on E221 are zero, the ratio of Cl−/Na+ passing through the pore is ∼13:1 and the channel is anion-selective. This provides theoretical evidence that point mutations in the TM domain can possibly change the selectivity property of the channel, as shown by previous experimental studies (32–35). Therefore, we believe that the local electrostatic environment in the TM domain is the key determinator of the ion selectivity.
Conduction event in GLIC2
As GLIC2 likely represents an open state of the channel, we conducted further analysis on the distribution of ions in the pore and the steps involved in conduction. The distribution of ions in the pore shown in Fig. 5 d, shows interesting features. One is that two rate-limiting steps are apparent as regions of low concentration in the channel at ∼z = −40 Å and z = −27 Å. The implications of this on the steps in conduction are discussed below. The second feature is that there are ∼2 Cl− located at ∼z = 8 Å in the EC-domain, as indicated with an arrow in Fig. 5 d. This is consistent with our previous studies on nAChR (11), which show that anions can enter the EC domain, despite the large negative charge on this part of the protein. In actual fact, a number of basic residues line the central section of the EC pore, and the Na+ concentration in this region is very low. The presence of anions is likely to assist cations in moving rapidly through the pore. From our previous studies, we know that the anions in the EC-domain can play a role in ion selectivity and conduction (11).
Fig. 8 a shows a typical ion distribution snapshot in the GLIC2 interior when a negative transmembrane potential is applied. As can be seen, corresponding to Fig. 5 d, there are a number of Na+s accumulating in the EC-domain (20 < z < 50 Å), 2 Cl− at ∼z = 8 Å, and 4 Na+ around the extracellular entry of the TM-domain (z = 0 Å). It appears that the two Cl− in the EC-domain act as a bridge for the two Na+ groups around them to translocate past the positively charged basic residues. The majority presence of Na+ in EC-domain compared to Cl− is not surprising, because the EC-domain overall is highly negatively charged, similar to nAChR.
Figure 8.
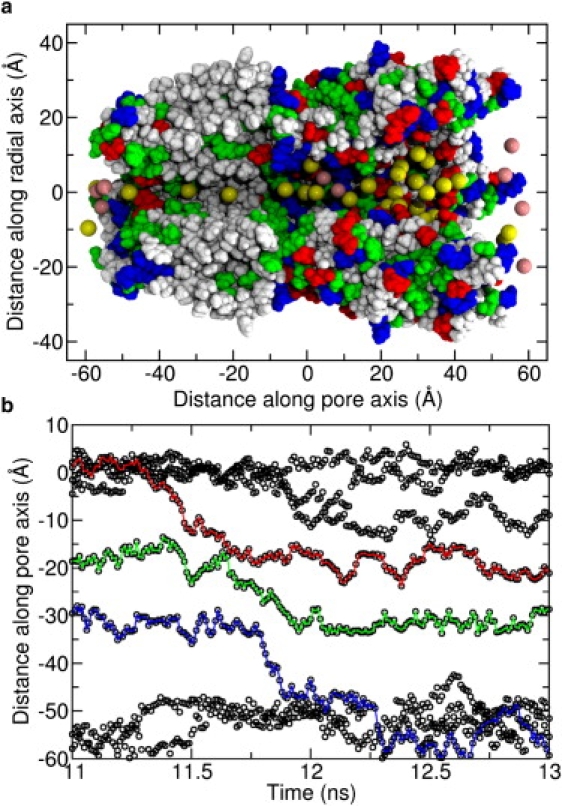
(a) A typical snapshot of ion distribution in GLIC2. The front subunit is removed for clarity. Na+ is shown with yellow spheres, Cl− is shown with pink spheres, and the protein is colored according to the residue types as in Fig. 3. (b) The z coordinates of all the Na+ residing from z = −60 to z = 10 Å at simulation time between 11 ns and 13 ns, drawn with black circles. The motions of the three ions that involved in the conduction event are marked with colored lines, in red, green, and blue, respectively.
Two Na+ are seen to reside almost permanently in the TM portion of the pore. One is in the wider hydrophobic region (z = −18), which is close to the extracellular entry. The other is in the hydrophilic region (z = −32), which is just before the narrowest part of the pore (z = −40) and closer to the intracellular exit. As described above, there are two regions of the pore that can act as gates: one is ∼z = −27 Å, corresponding to the narrow nonpolar part of the pore (hydrophobic gate), and the other is the narrowest part of the entire TM-domain, which is also the location of the negatively charged ring at the intracellular entry. The low concentration of ions at these points suggests that it is difficult for ions to pass these points, and therefore there are two free energy barriers to Na+ permeation. One of these is a consequence of the hydrophobic (dehydration) effect, and the other is due to the narrow size of the pore.
These energy barriers also dictate the steps involved in ion conduction. An examination of the ion trajectories shows that the motion of at least three ions is coordinated and that they translocate together: the two ions in the pore of TM-domain and a third one at the extracellular entrance. It appears that ions occupy these three positions for some time before all three ion move downward together in a correlated manner. To examine the detailed conduction steps, we analyzed a conduction event by tracing the z coordinates of all the Na+ ranging from −60 to 10 Å during 2 ns of simulation, as shown in Fig. 8 b. In this panel, the z coordinates of all the ions in the region are drawn with black circles. One ion conduction event occurs in this time involving the motions of three Na+ marked with colored lines. We can see that the first Na+ to move is the outermost ion at the EC entrance. It moves toward the TM domain (red line), knocking the next ion across the first energy barrier (green line), and following the ion across the second barrier (blue line). It is also notable that innermost Na+ does not leave the pore immediately, but instead fluctuates around the intracellular exit for some time before leaving, probably due to the attraction from the negatively charged rings nearby (see the peak in the ion concentration at z = −50 Å). However, no connection between the innermost Na+ and the other Na+ at the intracellular exit is found. We also examined other conduction events using the same method and found quite similar behavior. Therefore, we believe that the conduction of Na+ through GLIC2 is also a multi-ion process; at least three ions are directly involved in one conduction events, and they translocate by adopting the knock-on mechanism.
The role of EC-domain
Whereas the obvious role of the EC domain in LGICs is in the binding of ligands, previous studies have shown that EC-domain may affect the ion conduction and selectivity (7,10). It is a highly negatively charged cylinder-shaped domain, and therefore can accumulate many more Na+ than Cl−, as shown in Figs. 5 and 8. The ion concentrations in this region will then affect the ion conduction and selectivity. Due to the previous absence of an open state structure, it has been impossible to show how important the EC-domain is in determining the current and selectivity of the channel. One way to do this would be to calculate the current passing through the channel with and without the EC-domain. Because we have already determined the GLIC2 structure to be conductive, we calculated the conductance in the absence of the EC domain. To do this, we performed BD simulations on the TM-domain alone in 300 mM NaCl solution. The results are shown in Fig. 6 (dashed line with squares). We can see that, after removing the EC-domain, the ion conductance is obviously enhanced from 27.1 pS to 58.4 pS—more than twice that found with the EC-domain. Evidently the EC-domain does have an important role in modulating the ion conductance of the channel, which is consistent with recent experimental results (36).
Meanwhile, the EC-domain also affects the ion selectivity property, but not as significantly as suspected. After removing the EC-domain, the ratio of Na+/Cl− that pass through the pore is ∼57:1. Although it is less cation-selective compared to the entire structure of GLIC2, the TM domain alone still can discriminate cations from anions. This highlights the role of the TM domain in determining the channel selectivity, as previously suggested from our study of nAChR (11). This also explains how point mutations in the TM domain can convert nAChR from being cation- to anion-selective without changing the charge in the EC domain (33,32). Some anions can enter the EC domain, and thus pass through the TM section of the pore if the correct mutations have been made. Although it was suspected that the EC-domain could help to discriminate ions by maintaining a high concentration of cations at the mouth of the pore, our study shows that the EC domain of GLIC has only a small influence on the channel selectivity.
Summary
In this study, we utilized the newly obtained crystal structures of prokaryotic homologs of the pentameric ligand-gated ion channels ELIC, GLIC1, GLIC1M, and GLIC2 in BD simulations. The results show that ELIC is a closed state structure. GLIC1 and GLIC1M are partly open, but do not have the experimentally determined single channel conductance, whereas GLIC2 most likely represents an open state structure. The conductance of GLIC2 found in the BD simulations is between 10.8 and 12.4 pS in 140 mM NaCl solution, which is comparable to the experimentally measured value 8 ± 2 pS under similar conditions. It is interesting to note that the difference of the glutamate ring (E221) between GLIC1 and GLIC2 appears to play a key role in determining the conduction properties, because all the other features of the two structures, such as radii (except for the ring region), hydrophobic characters along the pore, and ion distributions, are extremely similar. The opening of the glutamate ring might be the final step of the conformational change involved in the opening of the channel.
We have shown that there are two rate-limiting steps that control permeation in the GLIC2 structure—one is ∼z = −27 Å, due to the hydrophobic effect, and the other one is around the intracellular exit (z = −40), due to the narrow size of the pore. Ion conduction involves at least three ions that translocate in a coordinated fashion. GLIC2 is totally cation-selective, but Cl− are still able to enter the EC-domain and act as a bridge assisting Na+ between the upper part of EC-domain and the extracellular entrance of the TM-domain.
The effect of the EC-domain of GLIC2 on ion conductance is very obvious. The conductance is twice the normal value when the EC-domain is removed. In contrast, although the EC-domain also has some effect on ion selectivity, the TM-domain alone can still discriminate cations from anions with a ratio of 57:1. Therefore, it appears that the EC-domain has only a minor role in determining ion selectivity. The local electrostatic environment of the TM pore probably plays a major role in discriminating among ion types.
Acknowledgments
This work is supported by funding from the National Health and Medical Research Council of Australia, an award under the merit allocation scheme on the National Computational Infrastructure and the Australian National University, and additional computer time from iVEC.
References
- 1.Hilf R.J.C., Dutzler R. X-ray structure of a prokaryotic pentameric ligand-gated ion channel. Nature. 2008;452:375–379. doi: 10.1038/nature06717. [DOI] [PubMed] [Google Scholar]
- 2.Hilf R.J.C., Dutzler R. Structure of a potentially open state of a proton-activated pentameric ligand-gated ion channel. Nature. 2009;457:115–118. doi: 10.1038/nature07461. [DOI] [PubMed] [Google Scholar]
- 3.Bocquet N., Nury H., Corringer P.J. X-ray structure of a pentameric ligand-gated ion channel in an apparently open conformation. Nature. 2009;457:111–114. doi: 10.1038/nature07462. [DOI] [PubMed] [Google Scholar]
- 4.Bocquet N., Prado de Carvalho L., Corringer P.J. A prokaryotic proton-gated ion channel from the nicotinic acetylcholine receptor family. Nature. 2007;445:116–119. doi: 10.1038/nature05371. [DOI] [PubMed] [Google Scholar]
- 5.Barry P.H., Lynch J.W. Ligand-gated channels. IEEE T. NanoBioscience. 2005;4:70–80. doi: 10.1109/tnb.2004.842497. [DOI] [PubMed] [Google Scholar]
- 6.Ashcroft F.M. From molecule to malady. Nature. 2006;440:440–447. doi: 10.1038/nature04707. [DOI] [PubMed] [Google Scholar]
- 7.Unwin N. Refined structure of the nicotinic acetylcholine receptor at 4Å resolution. J. Mol. Biol. 2005;346:967–989. doi: 10.1016/j.jmb.2004.12.031. [DOI] [PubMed] [Google Scholar]
- 8.Unwin N. Structure and action of the nicotinic acetylcholine receptor explored by electron microscopy. FEBS Lett. 2003;555:91–95. doi: 10.1016/s0014-5793(03)01084-6. [DOI] [PubMed] [Google Scholar]
- 9.Zhang D., Gullingsrud J., McCammon J.A. Potentials of mean force for acetylcholine unbinding from the α7 nicotinic acetylcholine receptor ligand-binding domain. J. Am. Chem. Soc. 2006;128:3019–3026. doi: 10.1021/ja057292u. [DOI] [PMC free article] [PubMed] [Google Scholar]
- 10.Wang H.-L., Cheng X., Sine S.M. Control of cation permeation through the nicotinic receptor channel. PLOS Comput. Biol. 2008;4:e41. doi: 10.1371/journal.pcbi.0040041. [DOI] [PMC free article] [PubMed] [Google Scholar]
- 11.Song C., Corry B. Role of acetylcholine receptor domains in ion selectivity. Biochim. Biophys. Acta. 2009;1788:1466–1473. doi: 10.1016/j.bbamem.2009.04.015. [DOI] [PubMed] [Google Scholar]
- 12.Song C., Corry B. Computational study of the transmembrane domain of the acetylcholine receptor. Eur. Biophys. J. 2009;38:961–970. doi: 10.1007/s00249-009-0476-3. [DOI] [PubMed] [Google Scholar]
- 13.Law R.J., Henchman R.H., McCammon J.A. A gating mechanism proposed from a simulation of a human α7 nicotinic acetylcholine receptor. Proc. Natl. Acad. Sci. USA. 2005;102:6813–6818. doi: 10.1073/pnas.0407739102. [DOI] [PMC free article] [PubMed] [Google Scholar]
- 14.Ivanov I., Cheng X., McCammon J.A. Barriers to ion translocation in cationic and anionic receptors from the Cys-loop family. J. Am. Chem. Soc. 2007;129:8217–8224. doi: 10.1021/ja070778l. [DOI] [PubMed] [Google Scholar]
- 15.Corry B. An energy-efficient gating mechanism in the acetylcholine receptor channel suggested by molecular and Brownian dynamics. Biophys. J. 2006;90:799–810. doi: 10.1529/biophysj.105.067868. [DOI] [PMC free article] [PubMed] [Google Scholar]
- 16.Cheng X., Wang H., McCammon J.A. Targeted molecular dynamics study of C-loop closure and channel gating in nicotinic receptors. PLOS Comput. Biol. 2006;2:1173–1184. doi: 10.1371/journal.pcbi.0020134. [DOI] [PMC free article] [PubMed] [Google Scholar]
- 17.Beckstein O., Sansom M.S.P. A hydrophobic gate in an ion channel: the closed state of the nicotinic acetylcholine receptor. Phys. Biol. 2006;3:147–159. doi: 10.1088/1478-3975/3/2/007. [DOI] [PubMed] [Google Scholar]
- 18.Tasneem A., Iyer L.M., Aravind L. Identification of the prokaryotic ligand-gated ion channels and their implications for the mechanisms and origins of animal Cys-loop ion channels. Genome Biol. 2005;6:R4. doi: 10.1186/gb-2004-6-1-r4. [DOI] [PMC free article] [PubMed] [Google Scholar]
- 19.Cheng X., Ivanov I., McCammon J.A. Molecular-dynamics simulations of ELIC-a prokaryotic homologue of the nicotinic acetylcholine receptor. Biophys. J. 2009;96:4502–4513. doi: 10.1016/j.bpj.2009.03.018. [DOI] [PMC free article] [PubMed] [Google Scholar]
- 20.Beckstein O., Biggin P., Sansom M. A hydrophobic gating mechanism for nanopores. J. Phys. Chem. B. 2001;105:12902–12905. [Google Scholar]
- 21.Beckstein O., Biggin P.C., Sansom M.S. Ion channel gating: insights via molecular simulations. FEBS Lett. 2003;555:85–90. doi: 10.1016/s0014-5793(03)01151-7. [DOI] [PubMed] [Google Scholar]
- 22.Li S.C., Hoyles M., Chung S.H. Brownian dynamics study of ion transport in the vestibule of membrane channels. Biophys. J. 1998;74:37–47. doi: 10.1016/S0006-3495(98)77764-1. [DOI] [PMC free article] [PubMed] [Google Scholar]
- 23.Chung S.H., Allen T.W., Kuyucak S. Conducting-state properties of the KcsA potassium channel from molecular and Brownian dynamics simulations. Biophys. J. 2002;82:628–645. doi: 10.1016/S0006-3495(02)75427-1. [DOI] [PMC free article] [PubMed] [Google Scholar]
- 24.Corry B., Allen T.W., Chung S.H. Mechanisms of permeation and selectivity in calcium channels. Biophys. J. 2001;80:195–214. doi: 10.1016/S0006-3495(01)76007-9. [DOI] [PMC free article] [PubMed] [Google Scholar]
- 25.MacKerell A.D., Bashford D., Karplus M. All-atom empirical potential for molecular modeling and dynamics studies of proteins. J. Phys. Chem. B. 1998;102:3586–3616. doi: 10.1021/jp973084f. [DOI] [PubMed] [Google Scholar]
- 26.Hoyles M., Kuyucak S., Chung S.H. Solutions of Poisson's equation in channel-like geometries. Comput. Phys. Commun. 1998;115:45–68. [Google Scholar]
- 27.Chung S.H., Allen T.W., Kuyucak S. Permeation of ions across the potassium channel: Brownian dynamics studies. Biophys. J. 1999;77:2517–2533. doi: 10.1016/S0006-3495(99)77087-6. [DOI] [PMC free article] [PubMed] [Google Scholar]
- 28.Corry B., O'Mara M., Chung S.-H. Conduction mechanisms of chloride ions in ClC-type channels. Biophys. J. 2004;86:846–860. doi: 10.1016/S0006-3495(04)74160-0. [DOI] [PMC free article] [PubMed] [Google Scholar]
- 29.O'Mara M., Cromer B., Chung S.H. Homology model of the GABAA receptor examined using Brownian dynamics. Biophys. J. 2005;88:3286–3299. doi: 10.1529/biophysj.104.051664. [DOI] [PMC free article] [PubMed] [Google Scholar]
- 30.Ng J.A., Vora T., Chung S.H. Estimating the dielectric constant of the channel protein and pore. Eur. Biophys. J. 2008;37:213–222. doi: 10.1007/s00249-007-0218-3. [DOI] [PubMed] [Google Scholar]
- 31.Corry B., Hoyles M., Chung S.H. Reservoir boundaries in Brownian dynamics simulations of ion channels. Biophys. J. 2002;82:1975–1984. doi: 10.1016/S0006-3495(02)75546-X. [DOI] [PMC free article] [PubMed] [Google Scholar]
- 32.Corringer P.-J., Bertrand S., Bertrand D. Mutational analysis of the charge selectivity filter of the α7 nicotinic acetylcholine receptor. Neuron. 1999;22:831–843. doi: 10.1016/s0896-6273(00)80741-2. [DOI] [PubMed] [Google Scholar]
- 33.Galzi J.-L., Devillers-Thiéry A., Bertrand D. Mutations in the channel domain of a neuronal nicotinic receptor convert ion selectivity from cationic to anionic. Nature. 1992;359:500–505. doi: 10.1038/359500a0. [DOI] [PubMed] [Google Scholar]
- 34.Gunthorpe M.J., Lummis S.C.R. Conversion of the ion selectivity of the 5-HT3A receptor from cationic to anionic reveals a conserved feature of the ligand-gated ion channel superfamily. J. Biol. Chem. 2001;276:10977–10983. [PubMed] [Google Scholar]
- 35.Keramidas A., Moorhouse A.J., Barry P.H. M2 pore mutations convert the glycine receptor channel from being anion- to cation-selective. Biophys. J. 2000;79:247–259. doi: 10.1016/S0006-3495(00)76287-4. [DOI] [PMC free article] [PubMed] [Google Scholar]
- 36.Hansen S.B., Wang H.-L., Sine S.M. An ion selectivity filter in the extracellular domain of Cys-loop receptors reveals determinants for ion conductance. J. Biol. Chem. 2008;283:36066–36070. doi: 10.1074/jbc.C800194200. [DOI] [PMC free article] [PubMed] [Google Scholar]