Abstract
Chemical modifications of nanoparticle (NP) surface are likely to regulate their activities, remove their toxic effects, and enable them to perform desired functions. It is urgent to develop analytical strategies for acquiring structural and quantitative information on small molecules linked to the surface of NP. Recent progresses on characterizing nanoparticle’s surface chemistry using nuclear magnetic resonance spectroscopy (NMR), Fourier transform infrared absorbance spectroscopy (FTIR), liquid chromatography-mass spectroscopy (LC-MS), X-Ray photoelectron spectroscopy (XPS), and combustion elemental analysis are reviewed.
Keywords: nanoparticle, NMR, FTIR, MS, XPS, combustion elemental analysis
Large surface areas of nanomaterials control their biological activities. Early studies suggested that cellular responses to nanomaterials modified by surface coating molecules reflect the adsorbed molecular layer, rather than the material itself [1–3]. Chemical modifications of nanoparticle (NP) surface are likely to regulate their activities, remove their toxic effects, and enable them to perform desired functions [4]. Two recent reports used parallel chemical modifications [5] of magnetic NPs and combinatorial chemical modifications [6] of multi-walled carbon nanotubes (MWNTs) and showed that careful design and modification of surface chemistry of NPs can control their biological activity and improve their biocompatibility.
Modified NPs need to be characterized rigorously regarding the integrity of the chemistry. However, identification and quantification of small molecules linked to the surface of NPs are very challenging due to the fact that they are solid-phase samples and they are coated with only a small amount of small molecules. This has become a roadblock limiting our ability to do chemical modifications of nanomaterials. For this technical difficulty, many previous publications did not thoroughly characterize modified NPs before doing biological testing. On the other hand, biological experiments require precise quantity/ concentration information to obtain dose-response relationship. The lack of accurate concentration information makes the biological studies qualitative at best.
Recently, efforts have been made to fill this gap. In this review, we focus on recent development of multiple analytical techniques, such as nuclear magnetic resonance spectroscopy (NMR), Fourier transform infrared absorbance spectroscopy (FTIR), liquid chromatography-mass spectroscopy (LC-MS), X-Ray photoelectron spectroscopy (XPS), and combustion elemental analysis and explain how these techniques help identify and quantify molecules attached to NP’s surface. The continued efforts in this field will pave the way to make the wider biomedical application of nanomaterials possible.
1. Nuclear Magnetic Resonance Spectroscopy (NMR)
1.1 Solution 1H NMR of nanomaterials attached molecules
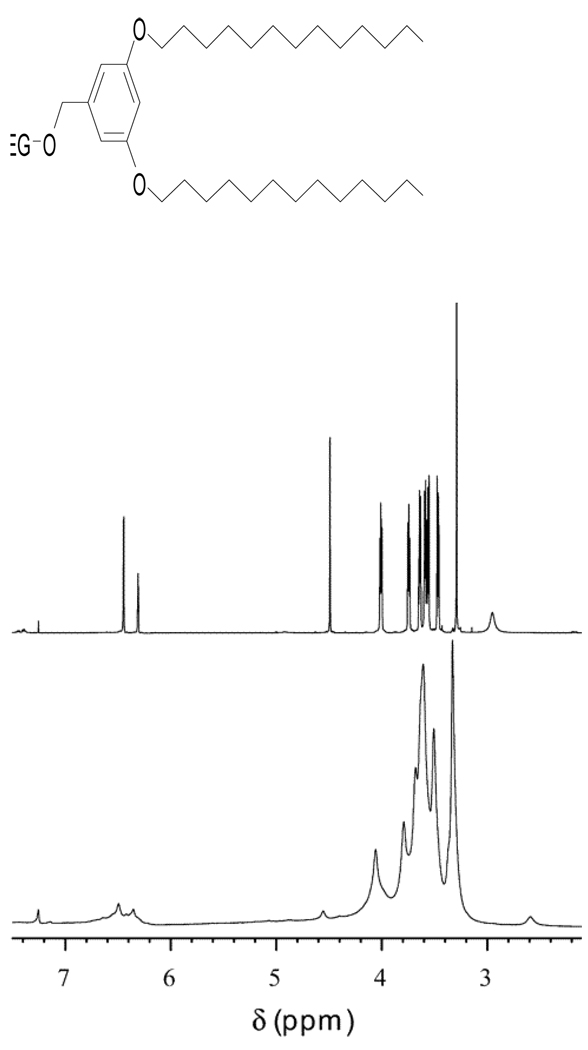
NMR has been used as a gold standard for structural characterization of organic molecules. For NPs with good solubility, it is possible to study the surface-bound molecules directly using solution 1H NMR technique. Studies of thiophenol-coated cadmium sulfide (CdS) QDs [7–11], 2-carboxyethanephosphonic acid coated SnO2 NPs [12] and oleic acid coated iron-oxide NPs [13] have been reported. However, the power of solution NMR is often negated by nanomaterials’ low solubility and inhomogeneity. When attached to a solid particle, the individual molecules cannot tumble rapidly to average the signal to give sharp NMR signals as in solution [14–23]. Such a phenomenon was well illustrated in Figure 1, in which the solution 1H NMR signals of molecule bound to single-walled carbon nanotubes (SWNTs) were broad [17], and not all protons’ signals were detected (Figure 1 bottom) compared with NMR signals of molecule alone in solution (Figure 1 top).
Figure 1.
1H NMR spectra of the compound shown (top) and its SWNT-bound analog (bottom) in CDCl3. (Reprinted with permission from [17], © 2002 American Chemical Society)
Coupling molecules to NPs through a long, flexible, solvable linker can enhance NPs’ solubility and thus can generally improve their NMR spectra. However, in reality, building such structures into the desired molecules is a synthetic challenge. Therefore, we found that routine NMR spectroscopy can monitor reaction and the product formation, but is not an ideal method for full structure elucidation of organic molecules on the surface of NPs [24].
1. 2 Indirect quantitative assessment of surface-bound ligands on Au NP by 1H NMR
Although solution 1H NMR spectroscopy of the Au NPs could be used to follow the extent of reaction on their monolayers, quantification of ligand exchange can be difficult due to the NMR peaks’ significant broadening by attachment to particle surfaces [25]. An alternative strategy is to cleave the alkanethiols from the Au NPs by oxidation with iodine and to subsequently analyze the relative quantities of the solution phase ligands using 1H NMR spectroscopy [26]. Comparison of the peak integrations from the NMR spectra as a function of reaction enables an estimation of the percentages of surface-bound ligands per Au NP. Assuming that (a) no ligands are destroyed through side reactions and (b) all ligands are completely cleaved from the surface upon reaction with I2, the intensities of the peaks in the NMR spectra are proportional to their relative concentrations on the Au NPs’ surfaces [27]. This indirect assessment of cleaved products by 1H NMR can be not only used to obtain purity and structure information of surface-bound ligands on Au NP, but also can be used to monitor conversions during multi-step modifications. The drawbacks of this method are that it is time consuming and destructive [28,29].
1.3 Magic-angle spinning (MAS) NMR spectroscopy
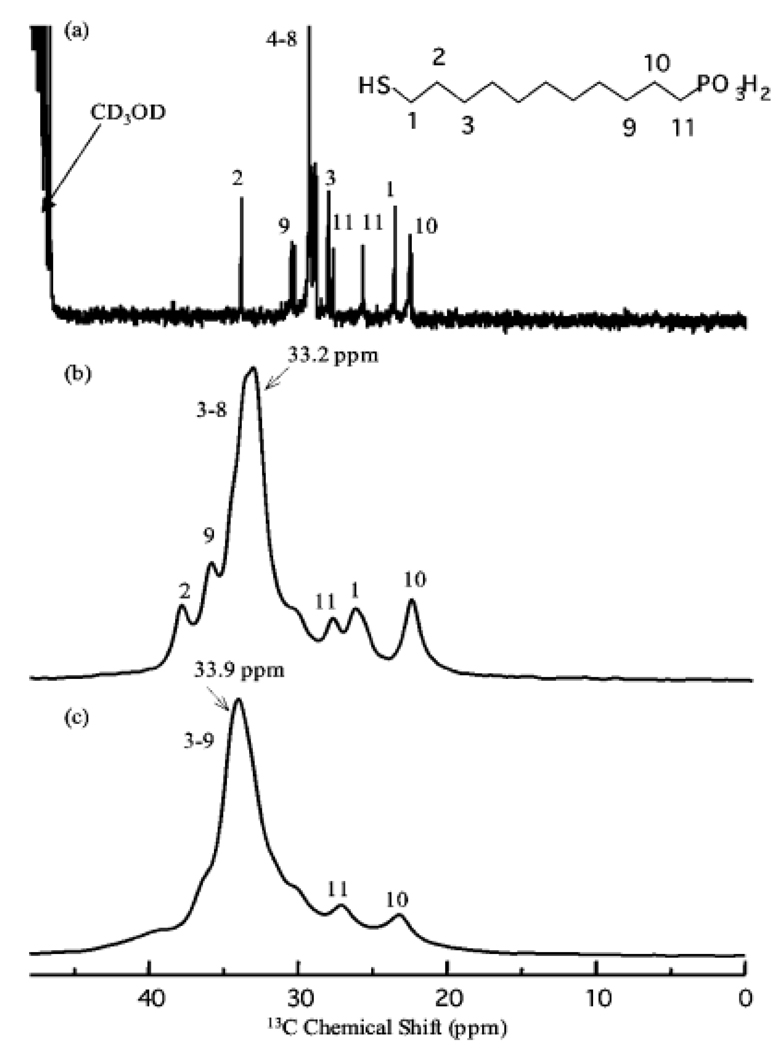
MAS NMR spectroscopy is reported to characterize the structural and dynamic properties of NPs, whereas 13C NMRspectroscopy gives information about the alkyl chain conformation and mobility, and 31P NMR spectroscopy is a sensitive probe of the local environment of phosphorus-containing functional groups. 13C and 31P NMR has been used to study the attached small molecules on gold clusters [27, 30–34], carbon nanotubes (CNTs) [35,36], and quantum dots [37]. Gold NPs capped with 11-mercaptoundecanylphosphonic acid (MUP) were synthesized and characterized by MAS NMR spectroscopy [33]. The solution 1H NMR spectrum of the gold colloids showed no signal. At pH 10, where the phosphonate groups are expected to be deprotonated, the chain mobility is sufficiently restricted to completely broaden the NMR resonances. A similar phenomenon was observed for carboxylic acid- and hydroxyl-functionalized gold NPs [32,33]. The 13C CP/MAS NMR spectrum of MUP adsorbed on gold NPs is shown in Figure 2c along with the solution (Figure 2a) and the MAS (Figure 2b) 13C NMR spectra of the unbound MUP. Small peaks can also be shadowed by the adjacent large peaks. These drawbacks prevent a full structural characterization.
Figure 2.
13C CP-NMR spectra of MUP (a) in methanol-d4, (b) in the solid state, and (c) on colloidal gold in the solid state. (Reprinted with permission from [34], © 2007 American Chemical Society)
Proton high-resolution magic-angle spinning 1H (HRMAS) NMR technique, successfully used in late 1990s for applications in combinatorial chemistry [38–45], has evolved to be a method to characterize samples with limited amount or semisolid biological samples such as whole cells and tissues [46–49]. By spinning the sample at the magic angle (54.7° relative to the direction of main magnetic field), line broading contributions from magnetic susceptibility and chemical shift anisotropy to the NMR spectra are significantly reduced [50]. An efficient method was developed to make carbohydrate- and protein-coated MNPs via a surface diazo transfer/azide-alkyne click chemistry. Well-resolved 1H NMR signals at 8.0 ppm for all modified MNPs confirmed the presence of triazole protons [51].
A multi-walled carbon nanotubes (MWNTs)-combinatorial library was synthesized. 1H HRMAS NMR was used for structural confirmation [6]. Different MWNTs sharing the same benzenesulfonyl group had similar aromatic proton signals at 7.29–7.94 ppm. MWNTs sharing the same 3-nitro-benzenesulfonyl group had NMR peaks at 7.64–7.81 ppm due to the reduced electron density by nitro group substitution.
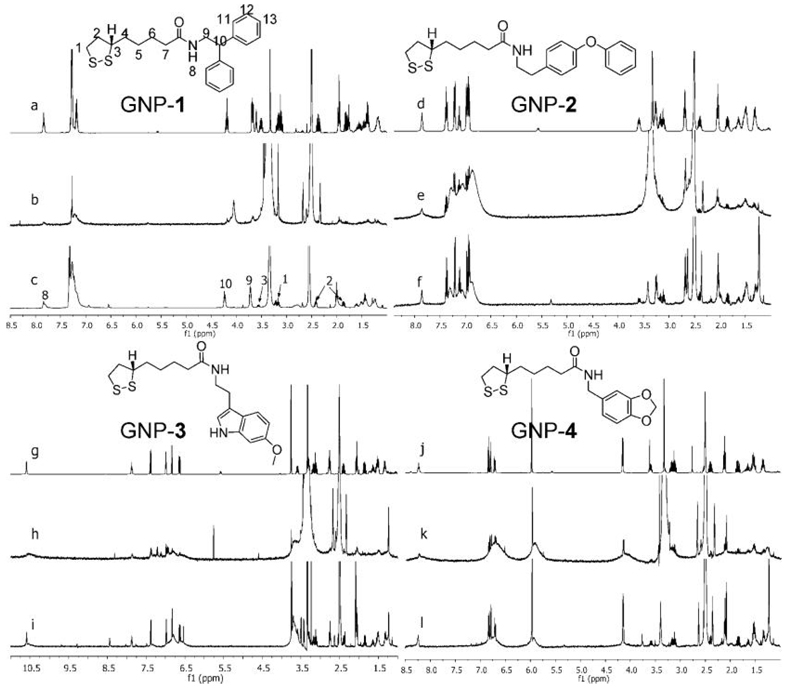
13C, 29Si, and 31P MAS NMR were also reported to show distinct resonances for siloxane and other organic moieties on silica [52,53] and gold NPs [54–57]. However, these reports were mainly about identification of special functional groups, instead of full structural elucidation. The 1H MAS NMR spectra of GNPs using 40 µL nanoprobe with water suppression can provide nearly solution-like quality. By effectively optimizing 1H high resolution MAS NMR conditions and applying one- and two-dimensional techniques (1-D and 2-D NMR), ligand structures on surfaces of gold NPs (GNPs) were fully characterized [58]. Significant differences were also found in detection sensitivity depending on the distance between the surface of GNP and protons in the ligand molecule, with the loss of sensitivity for protons closer to the NPs consistent with other report [59]. Figure 3 shows the 1H NMR spectra for the free ligands (spectra a, d, g, j), 1H NMR spectra of GNPs (b, e, h, k), and 1H HRMAS NMR spectra of GNPs 1–4 (c, f, i, l) [58].
Figure 3.
1H NMR spectra of free ligands 1–4 and GNP-1-4 in DMSO-d6. In each group, the top spectra (a, d, g, j) are the solution 1H NMR spectra of free ligands (structures shown), the middle ones (b, e, h, k) are solution 1H NMR spectra of corresponding GNPs and the bottom ones (c, f, i, l) are 1H HRMAS NMR spectra. (Reprinted with permission from [58], © 2008 American Chemical Society)
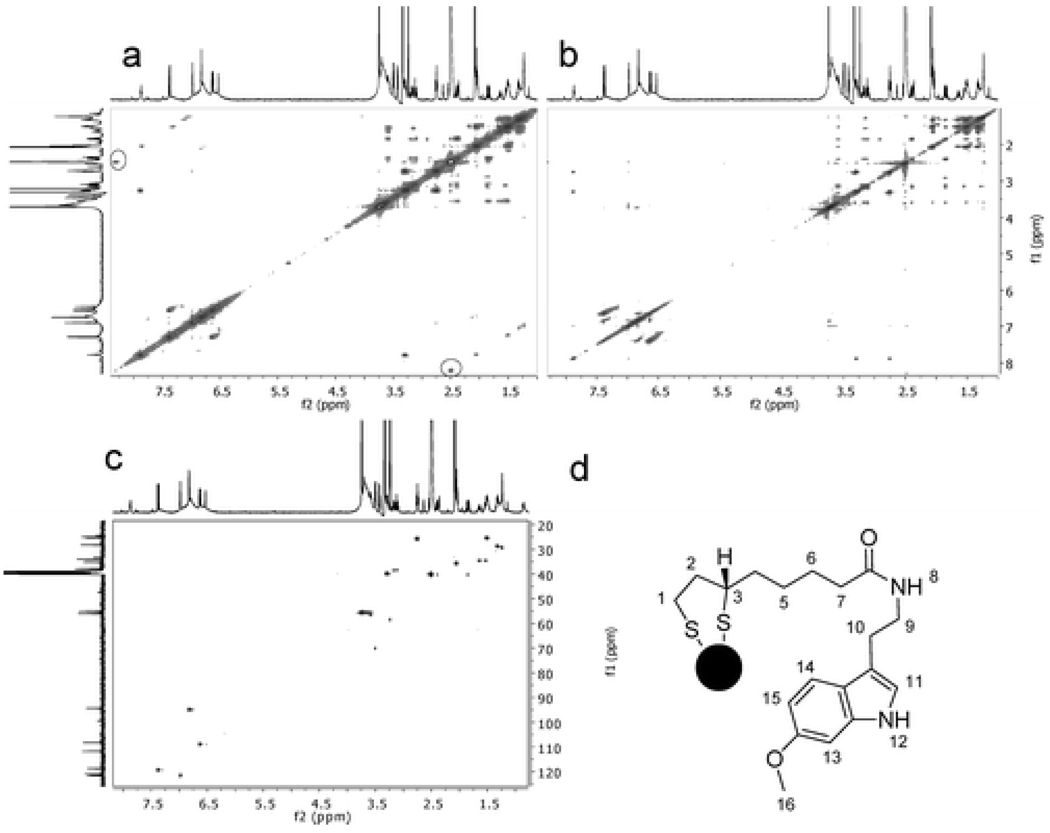
2-D HRMAS NMR was also performed to elucidate ligands structures on these GNPs’ surface. Correlation spectroscopy (COSY), total correlation spectroscopy (TOCSY) and heteronuclear single quantum coherence (HSQC) spectra for GNP 3 were shown in Figure 4. Molecules attached on GNP 3 can be elucidated on the basis of COSY, TOCSY, HSQC and 1-D NMR data [58]. These results demonstrated that 1H HRMAS NMR is an irreplaceable method for a full characterization of molecules bound to NP’s surface.
Figure 4.
HRMAS COSY (a), TOCSY (b), and HSQC (c) of GNP 3. 13C NMR spectrum shown vertically is from the free ligand because the 13C HRMAS NMR spectra of GNPs were not able to obtain using nanoprobe (an inverse probe). Peaks inside the circled areas and those adjacent peaks in parallel to the diagonal line in panel a (upper left and lower right corners) are artifacts from spinning side bands. (Reprinted with permission from [58], © 2008 American Chemical Society)
Furthermore, the investigation showed that NMR spectra of aromatic protons in ligands attached to GNP seem to have a broad base compared with aliphatic ligands, indicating the π-π stacking effects.
2. Fourier Transform Infrared Absorbance Spectroscopy (FTIR)
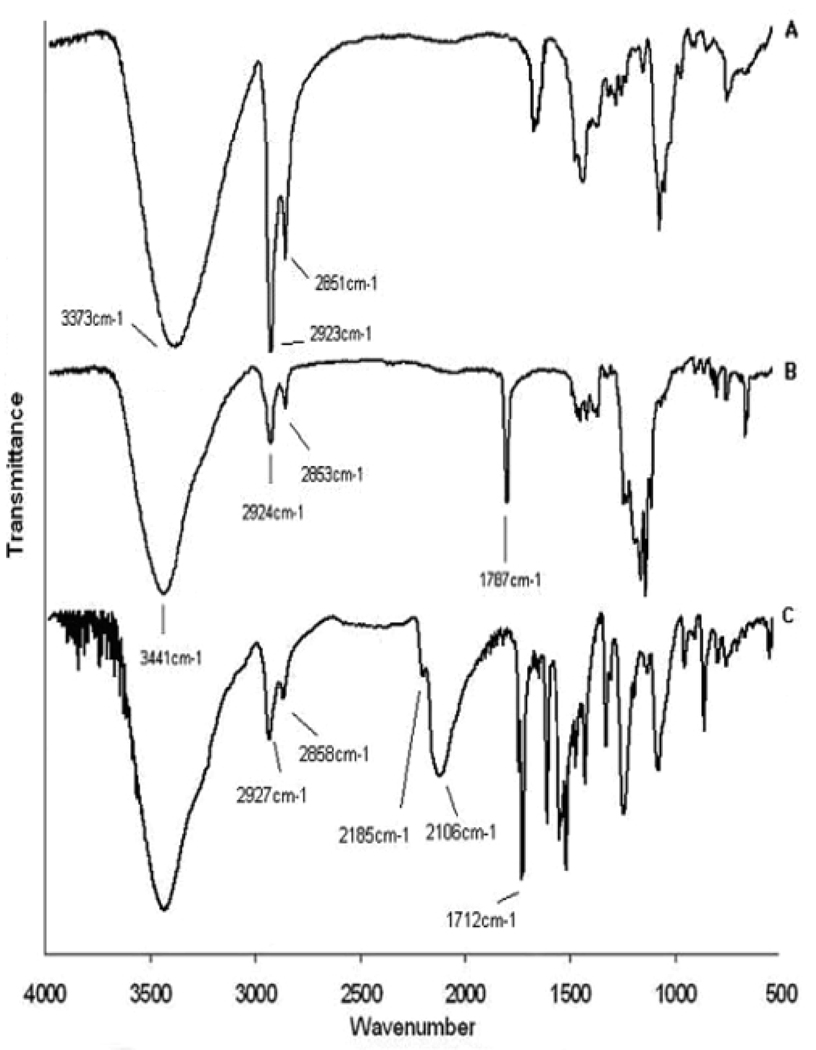
FTIR has been used to identify functional groups on molecules that are attached to NPs [6,60–62]. Au-MCH (MCH = 6-mercapto-1-hexanol, HS-(CH2)6-OH) nanoclusters were synthesized [63]. The OH terminal group of the MCH ligand has been directly functionalized through chemical reactions to generate products such as ester or carbamate, as monitered by FTIR spectroscopy. The FTIR spectrum of solid Au-MCH in Figure 5A shows similarity to that obtained for the pure MCH molecule except that the SH vibrational band at 2550 cm−1 has disappeared after binding to Au surface. The FTIR spectrum of the Au NPs after esterification with CF3COOH (Figure 5B) contains a new intense vibrational band at 1787 cm−1. This is assigned to the CO stretch of the -COO ester group. Peak at 2106 cm−1 (Figure 5C) belongs to the characteristic peak of N=C=S stretch (at 2143 cm−1 for pure NCO-C6H4-NCS solid).
Figure 5.
Solid-state FTIR spectra of (A) Au-MCH nanoclusters and Au nanoclusters after derivatization with (B) CF3COOH and (C) SCN-C6H4-NCO. (Reprinted with permission from [63], © 2006 American Chemical Society)
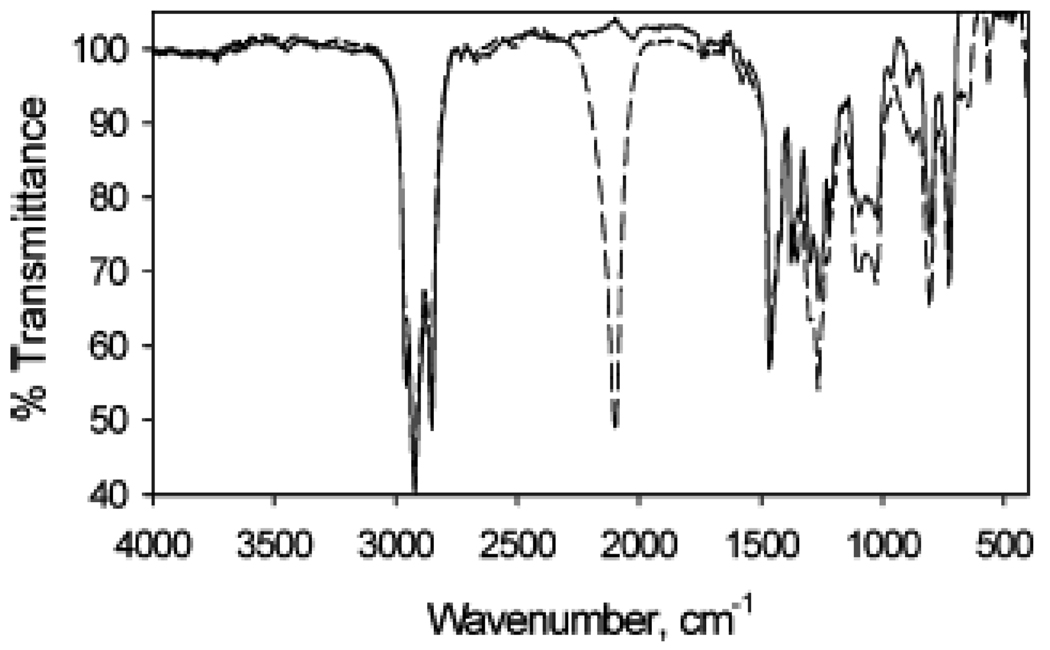
In another report [27], the surface of Au NPs was modified with triazole cycloaddition through “click” chemistry. Azide-functionalized Au NPs were reacted with a series of alkynyl molecules. Au particle samples were first synthesized through standard procedures, the methyl-terminated chains partially exchanged with ω-bromo-functionalized thiol, and the Br termini converted to azides by reaction with NaN3 (Scheme 1). The FTIR spectrum of the alkanethiol stabilized particles (Figure 6, solid line) is relatively featureless and contains characteristic alkyl stretching vibrations between 2800 and 3000 cm−1, and indicate that the alkyl chains are well-ordered. In comparison, the FTIR spectrum of the Au NPs that have reacted with NaN3 (Figure 6, dashed line) contains a strong, new vibrational band at 2094 cm−1 that is attributed to the cumulated double bonds of the terminal azide moiety. The characteristic alkyl stretching vibrations are not significantly affected (versus the methyl-terminated particles), suggesting that ligand exchange and N3 substitution do not perturb the structure of the monolayer.
Scheme 1.
“Click” functionalization of Au NP surfaces.
Figure 6.
FTIR spectra of the as-synthesized C10H21SH-modified Au particle (solid line) compared to azide-functionalized Au nanoparticles (dashed line). (Reprinted with permission from [27], © 2006 American Chemical Society)
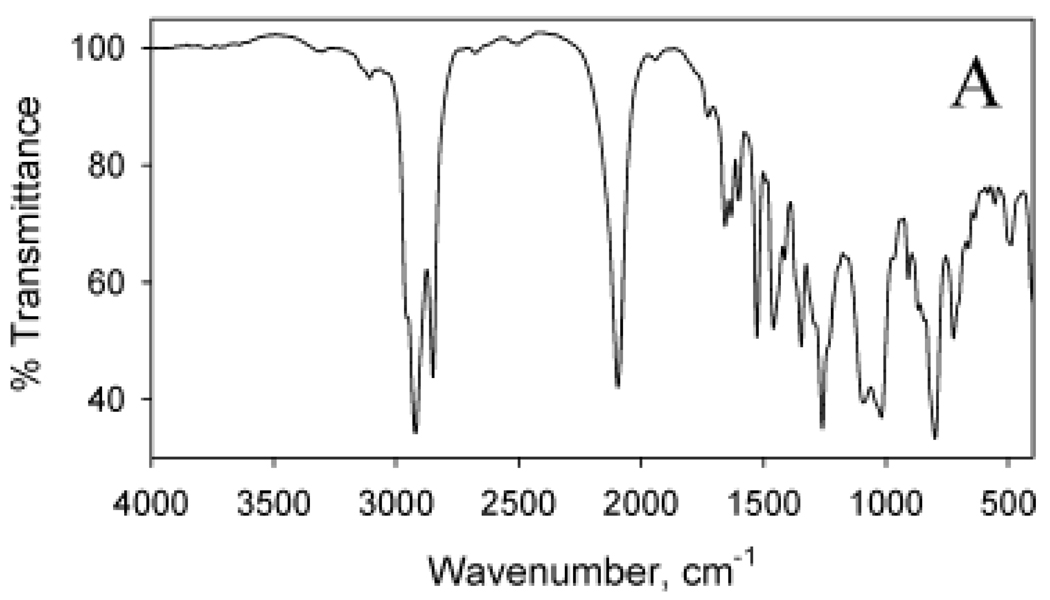
Cycloaddition reactions can also be utilized to prepare multifunctional Au NPs by simultaneously stirring the N3-terminated NPs with several acetylenic small molecules. To demonstrate this, N3-containing Au NPs was reacted with a solution containing both the ferrocene (Fc) and the nitrobenzene (NB) propyn-1-one species. The FTIR spectrum of the resultant particles (Figure 7) contains vibrations between 1500 and 1700 cm−1 due to C=O and triazole ring stretching modes. Although it is complex, the spectrum indicates the existence of a multifunctional Au NP containing both Fc and NB species linked through triazole ring formation.
Figure 7.
FTIR spectra of Au nanoparticles following reaction with both Fc and NB alkynyl derivatives. (Reprinted with permission from [27], © 2006 American Chemical Society)
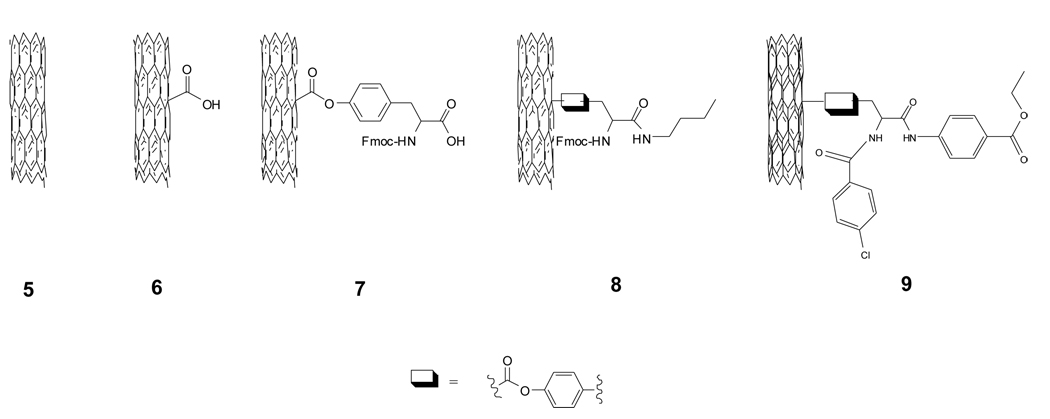
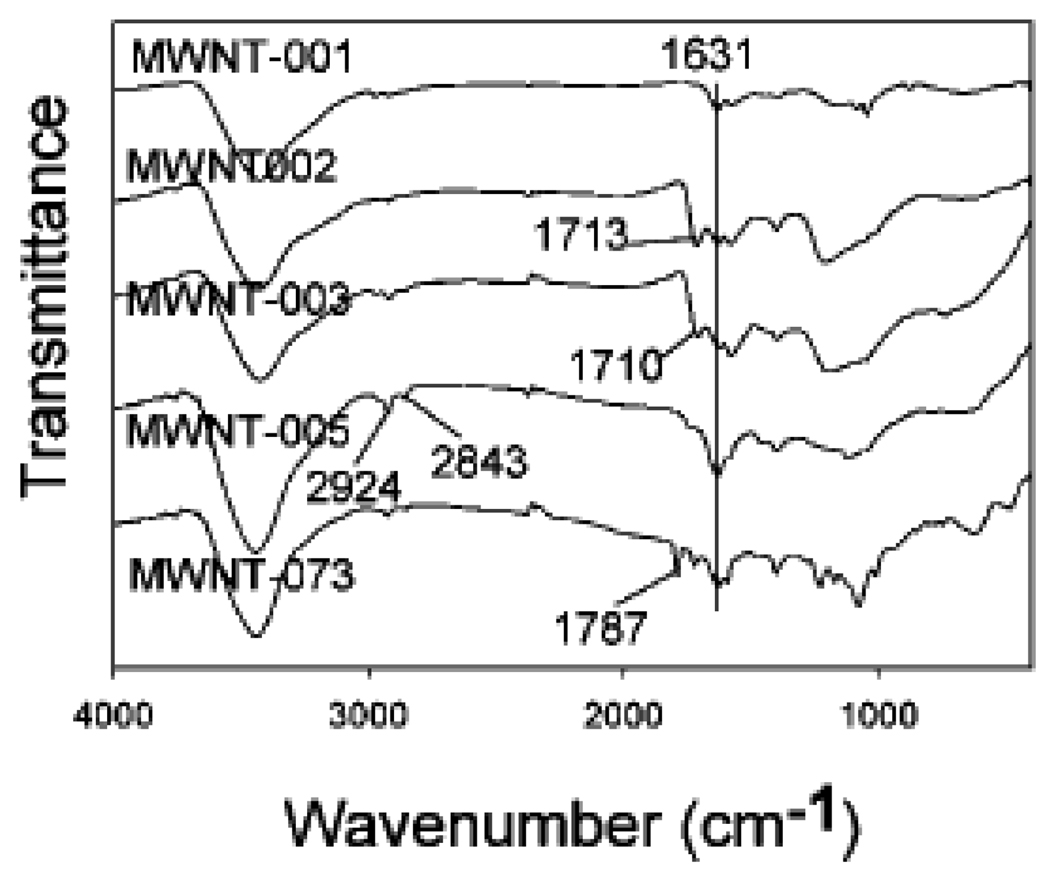
Utilizing a nano-combinatorial library strategy, we [6] have constructed a novel surface-modified MWNTs library containing 80 members (Scheme 2), and aimed to discover novel f-MWNTs with reduced protein binding, cytotoxicity, and immune responses through multiple biological screenings. Surface chemistry structures of all the members from the library were characterized by FTIR. Figure 8 is FTIR spectra of f-MWNTs 5, 6, 7, 8, and 9. When pristine MWNT was oxidized, an IR band at 1713 cm−1 appeared indicating the formation of carboxylic acid groups. MWNT 6 reacted with Fmoc-tyrosine and the IR bands of phenol ester carbonyl and carboxylic acid of tyrosine overlapped at ~ 1710 cm−1. The amidation of 7 produced 8, which was characterized by disappearance of an acid carbonyl band at 1710 and the formation of bands at 2843 and 2924 cm−1. Final product synthesis induced further IR changes. In the case of f-MWNT 9, an ester carbonyl band at 1787 cm−1 emerged due to an ester group on its building blocks.
Scheme 2.
Structures of prinstine and four surface-modified MWNTs used in Figure 7.
Figure 8.
is FTIR spectra of f-MWNTs 5, 6, 7, 8, and 9. (Reprinted with permission from [6], © 2008 American Chemical Society)
3. Mass Spectroscopy (MS)
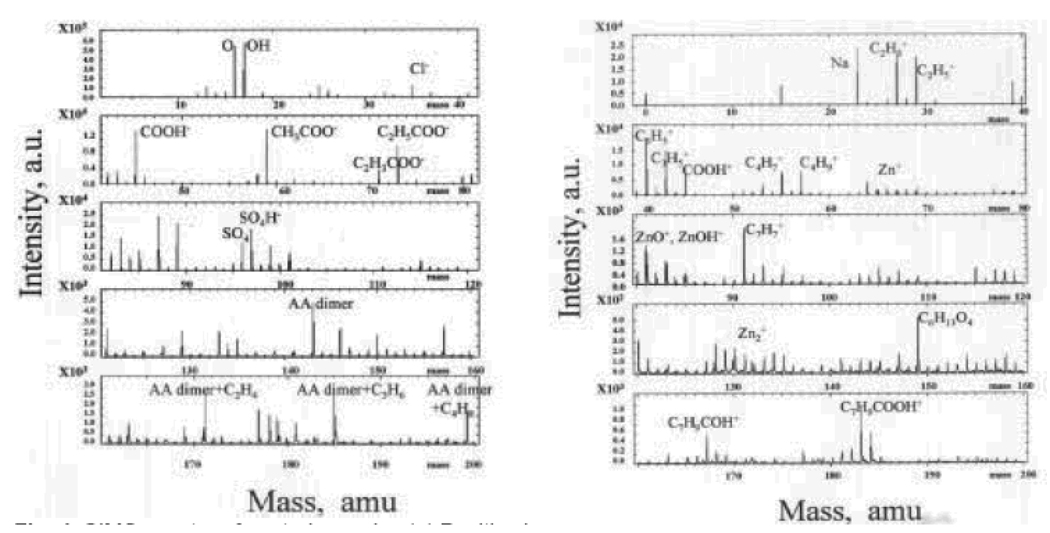
A MS approach was reported to chracterize ZnO NPs modified with Acrylic acid (AA) by plasma polymerization [64]. Figure 9a shows the positive and negative time of flight secondary ion mass spectroscopy (TOFSIMS) of coated ZnO NPs. The spectra in the positive ion mode show strong peaks related to molecular fragments such as C4H7+, C4H9+, C6H13O4, C7H9COH+, and C7H9COOH+. The spectra in the negative ion mode show the existence of the AA (acrylic acid) monomer, AA dimer, AA dimmer + C2H4 and AA dimmer + C3H6.
Figure 9.
TOFSIMS spectra of ZnO NPs coated with Acrylic acid (AA). (a) Positive image, (b) Negative image. (Reprinted with permission from [64], © 2004 Advanced Study Center Co., Ltd.)
Functionalized CNTs have been used as the MALDI matrix [65–68] for the study of small molecules and macromolecules. CNTs was derivatized with iminodiacetic acid (IDA), which could chelate Cu2+ [69]. These Cu2+ loaded CNTs was used as biomarkers for the selective binding of biomolecules from a complex sample such as serum. Peptides and proteins, bound to the surface of the derivatized CNTs, were then directly analyzed by matrix assisted laser desorption ionisation/time of flight mass spectrometry (MALDI/TOFMS). The protein mass fingerprinting are the characteristic for every serum sample that may be utilized as disease markers.
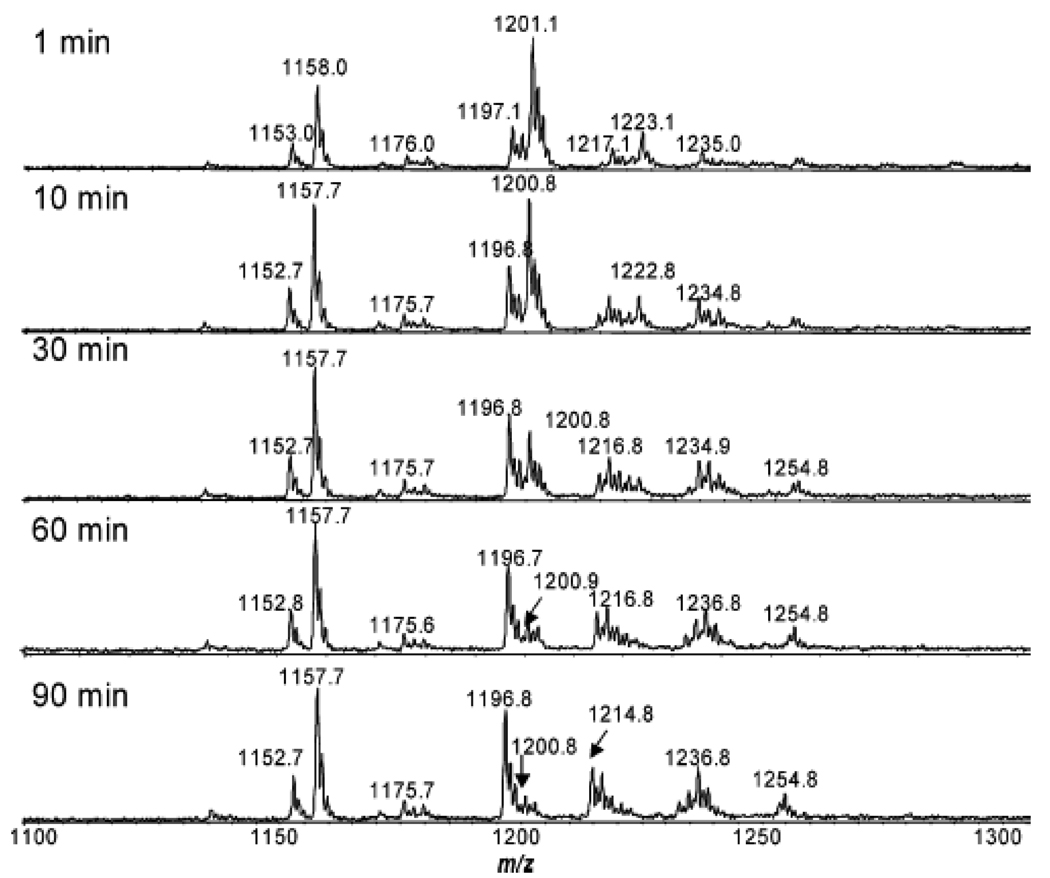
Mass spectroscopy could also be used to monitor the synthesis of gold NPs (GNPs). GNPs with diameter of 5–6 nm was synthesized through the reduction reaction using sodium borohydride (SBH) in the presence of mono-6-deoxy-6-pyridinium-β-cyclodextrin chloride (p-βCD) [70]. A reaction intermediate was detected during the reaction process by MS. After 1 min, the p-βCD was already converted to its reduced form, as confirmed by the presence of protonated ion at m/z 1201 and its corresponding sodium adduct at m/z 1223 (Figure 10). As the reaction proceeded, the relative intensities of ions at m/z 1201 vs 1197 decreased. After 90 min, the ion at m/z 1201 almost disappeared. Such data confirmed that the oxidized p-βCD was reduced by SBH as an intermediate (m/z 1201), which was slowly reoxidized to its original form.
Figure 10.
Mass spectrum of p-βCD-SBH-HAuCl4 reaction with time (1–90 min). (Reprinted with permission from [70], © 2008 American Chemical Society)
We have used thioctic acid and its derivatives for chemical modification of GNPs. When the GNPs are oxidized in the presence of I2, the free ligand can be cleaved from the surface of GNPs. The loading of multiple ligands can be quantified by LC/MS/UV/CLND to analyze the ratio of ligands in multiple functionalized GNPs (manuscript submitted).
4. X-Ray Photoelectron Spectroscopy (XPS)
XPS can provide information on elemental composition [71,72]. In an early study [73], XPS was used to elucidate the chemical species of acid-oxidized MWNTs. C1s XPS spectra indicated that peaks with higher binding energies located at 286.2, 287.5, and 288.9 eV are assigned to carbon atoms bound to one, two, and three oxygen atoms, respectively. Hence, they can be assigned as >CH-O- (e.g., alcohol, ether), >C=O (ketone, aldehyde), and -COO- (carboxylic acid, ester) species, respectively.
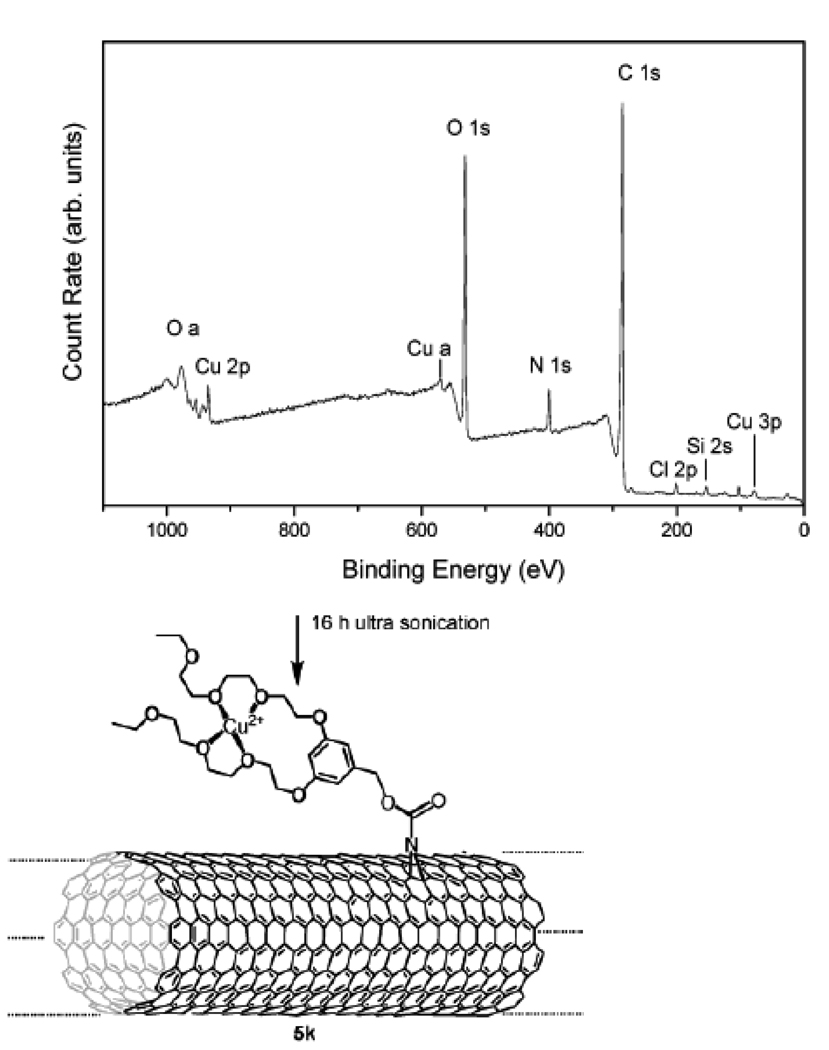
SWNT was functionalized by the addition of (R-)-oxycarbonyl nitrenes which allows for the covalent binding of a variety of different groups such as alkyl chains, aromatic groups, dendrimers, crown ethers, and oligoethylene glycol units [74]. XPS was used to determine the elemental composition of the functionalized SWNT. From the comparison between the spectra of the SWNT starting material and reaction products, characteristic conversions can be confirmed. A detailed analysis of various reaction products was made through the spectrum of C1s and O1s (Figure 11), and the amount of nitrogen and carbon in the sample.
Figure 11.
XPS survey spectrum of 5k (structure see below). Composition: 69.1% C, 1.4% Si, 0.7% Cl, 4.4% N, 23% O, 1.4% Cu. (Reprinted with permission from [74], © 2003 American Chemical Society)
In another report [75], interaction between surface-bound alkylamines and gold NPs were studied using XPS. From the presence of two chemically distinct Cl 2p components it was concluded that both AuCl4− and AuCl2− ions existed on the surface of gold NPs. Results lead to a conclusion that two modes of binding between alkylamines and the gold surface was confirmed. The loosely bound component is attributed to the formation of an electrostatic complex between protonated amine molecules and surface-bound AuCl4−/AuCl2− ions, while species with stronger binding was tentatively assigned to [AuCl(NH2R)].
5. Combustion Elemental Analysis
Combustion elemental analysis has been used in the quantitative analysis of chemical modification of NPs [6,35,58,76,77]. By analyzing the percentage of C, N, S and H elements in modified and unmodified NPs, one can get the quantitative information on the surface composition of NPs.
Surface modification of silica-coated magnetite NPs with (aminopropyl) triethoxysilane (APTS) was analyzed by elemental analysis to optimize the reaction conditions such as solvent, reaction temperature and reaction time [76]. The effect of reaction variables on the final product was quantified in terms of C, H and N elemental analysis of the loaded molecules. Relative high percentage of C, H and N content was found if the reaction was performed in THF indicating that more APTS molecules were bound to the NP’s surface. An IR band at 790 cm−1 corresponding to NH2 bending modes of the APTS molecule also confirmed such reactions.
A method for the modification of amine groups onto the surface of magnetite and silica-coated magnetite NPs was developed based on the condensation of aminopropyltriethoxysilane [77]. From the elemental analysis results, the organic content of the starting material is very low. After modification, a higher percentage of N was detected in all NPs. The amine density determined by this method lies between 42 to 78 µmol g−1 depending on the conditions used for the synthesis.
We have designed and synthesized a functionalized MWNTs library using carboxylated MWNT as starting material. We have used several analytical methods to characterize the starting material and the f-MWNT library. By derivatizing carboxylic acid group into amide and performing elemental analysis, we determined that the loading of carboxyl group is 0.45 mmol g−1 [6].
6. Concluding Remarks
Analytical strategies for identification and quantification of NP’s surface chemistry are crucial for modulating NP’s biological activities and toxicity. NMR and FTIR play important roles in the structure confirmation of functional group bound to NPs. Although Solution NMR, MAS NMR and HR MAS NMR can be used to identify structural components of different functionalized NPs, 1-D and 2-D HRMAS NMR measurements are irreplaceable methods for structure elucidation of NP’s surface-bound molecules. Furthermore, NMR and FTIR techniques can be also used to monitor the reaction conversions for the multi-step modifications. XPS and elemental analysis are techniques for determining the chemical compositions of molecules bound to NPs. LC/MS analysis after ligand cleavage is the only method for qualitative and quantitative analysis of multiple functionalized NPs, when a quantitative detector such as CLND is used.
It is highly promising that NPs may have more and more applications in therapy, medicine delivery, and diagnosis. The unusual large surface area of NPs suggests that surface chemical modification would play a critical role in modulating their toxicity and biological specificity both in vitro and in vivo. It is not surprising to witness more focused and diverse chemical modifications of nanomaterial surface in future research. However, reliable characterization on the identity and quantity of surface attached molecules for different nanomaterials remain a bottleneck. Although significant progresses have been made on analytical strategies for nanomaterials surface chemistry, identifying the attached molecules and quantifying their loading still require our continued dedication and efforts.
Acknowledgments
This work was supported by Shandong University, St. Jude Children’s Research Hospital and the American Lebanese Syrian Associated Charities (ALSAC).
References
- 1.Lynch I, Dawson KA, Linse S. Sci STKE. 2006;327:14–19. doi: 10.1126/stke.3272006pe14. [DOI] [PubMed] [Google Scholar]
- 2.Norde W, Lyklema J. J Biomater Sci Polym Ed. 1991;2:183. doi: 10.1080/09205063.1991.9756659. [DOI] [PubMed] [Google Scholar]
- 3.Gray JJ. Curr Opin Struct Biol. 2004;14:110–115. doi: 10.1016/j.sbi.2003.12.001. [DOI] [PubMed] [Google Scholar]
- 4.Hong R, Fischer NO, Verma A, Goodman CM, Emrick T, Rotello VM. J Am Chem Soc. 2004;126:739–743. doi: 10.1021/ja037470o. [DOI] [PubMed] [Google Scholar]
- 5.Weissleder R, Kelly K, Sun EY, Shtatland T, Josephson L. Nat Biotechnol. 2005;23:1418–1423. doi: 10.1038/nbt1159. [DOI] [PubMed] [Google Scholar]
- 6.Zhou HY, Mu QX, Gao NN, Liu AF, Xing YH, Gao SL, Zhang Q, Qu GB, Chen YY, Liu G, Zhang B, Yan B. Nano Lett. 2008;8:859–865. doi: 10.1021/nl0730155. [DOI] [PubMed] [Google Scholar]
- 7.Sachleben JR, Wooten EW, Emsley L, Pines A, Colvin VL, Alivisatos AP. Chem Phys Lett. 1992;198:431–436. [Google Scholar]
- 8.Sachleben JR, Colvin V, Emsley L, Wooten EW, Alivisatos AP. J Phys Chem B. 1998;102:10117–10128. [Google Scholar]
- 9.Lippens PE, Lannoo M. Phys Rev B: Condens Matter. 1989;39:10935–10942. doi: 10.1103/physrevb.39.10935. [DOI] [PubMed] [Google Scholar]
- 10.Majetich SA, Carter AC, Belot J, McCullough RD. J Phys Chem. 1994;98:13705–13710. [Google Scholar]
- 11.Diaz D, Rivera M, Ni T, Rodriguez JC, Gastillo-Blum SE, Nagesha D, Robles J, Alvarez-Fregoso OJ, Kotov NA. J Phys Chem B. 1999;103:9854–9858. [Google Scholar]
- 12.Holland GP, Sharma R, Agola JO, Amin S, Solomon VC, Singh P, Buttry DA, Yarger JL. Chem Mater. 2007;19:2519–2526. [Google Scholar]
- 13.Willis AL, Turro NJ, O’Brien S. Chem Mater. 2005;17:5970–5975. [Google Scholar]
- 14.Wang Z, Liu Q, Zhu H, Liu H, Chen Y, Yang M. Carbon. 2007;45:285–292. [Google Scholar]
- 15.Lin Y, Rao AM, Sadanadan B, Kenik EA, Sun Y-P. J Phys Chem B. 2002;106:1294–1298. [Google Scholar]
- 16.Hong C-Y, You Y-Z, Pan C-Y. Polymer. 2006;47:4300–4309. [Google Scholar]
- 17.Sun Y-P, Fu K, Lin Y, Huang W. Acc Chem Res. 2002;35:1096–1104. doi: 10.1021/ar010160v. [DOI] [PubMed] [Google Scholar]
- 18.Barrientos AG, de la Fuente JM, Rojas TC, Fernάndez A, Penadés S. Chem Eur J. 2003;9:1909–1921. doi: 10.1002/chem.200204544. [DOI] [PubMed] [Google Scholar]
- 19.Alvaro M, Aprile C, Ferrer B, Garcia H. J Am Chem Soc. 2007;129:5647–5655. doi: 10.1021/ja0690520. [DOI] [PubMed] [Google Scholar]
- 20.Gibson JD, Khanal BP, Zubarev ER. J Am Chem Soc. 2007;129:11653–11661. doi: 10.1021/ja075181k. [DOI] [PubMed] [Google Scholar]
- 21.Zhang Y, Zhang J. J Colloid Interf Sci. 2005;283:352–357. doi: 10.1016/j.jcis.2004.09.042. [DOI] [PubMed] [Google Scholar]
- 22.Murakami Y, Konishi K. J Am Chem Soc. 2007;129:14401–14407. doi: 10.1021/ja075051b. [DOI] [PubMed] [Google Scholar]
- 23.Foos EE, Snow AW, Twigg ME, Ancona MG. Chem Mater. 2002;14:2401–2408. [Google Scholar]
- 24.Du FF, Zhou HY, Chen LX, Zhang B, Yan B. Trends in Anal Chem. 2009;28:88–95. [Google Scholar]
- 25.Terrill RH, Postlethwaite TA, Chen C, Poon CD, Terzis A, Chen A, Hutchison JE, Clark MR, Wignall G, Londono JD, Superfine R, Falvo M, Johnson CS, Samulski ET, Murray RW. J Am Chem Soc. 1995;117:12537–12548. [Google Scholar]
- 26.Templeton AC, Hostetler MJ, Kraft CT, Murray RW. J Am Chem Soc. 1998;120:1906–19911. [Google Scholar]
- 27.Fleming DA, Thode CJ, Williams ME. Chem Mater. 2006;18:2327–2334. [Google Scholar]
- 28.Rowe MP, Plass KE, Kim K, Kurdak C, Zellers ET, Matzger AJ. Chem Mater. 2004;16:3513–3517. [Google Scholar]
- 29.Tan H, Zhan T, Fan WY. J Phys Chem B. 2006;110:21690–21693. doi: 10.1021/jp065652+. [DOI] [PubMed] [Google Scholar]
- 30.Song Y, Harper AS, Murray RW. Langmuir. 2005;21:5492–5500. doi: 10.1021/la0503606. [DOI] [PubMed] [Google Scholar]
- 31.Zelakiewicz BS, de Dios AC, Tong YY. J Am Chem Soc. 2003;125:18–19. doi: 10.1021/ja028302j. [DOI] [PubMed] [Google Scholar]
- 32.Badia A, Gao W, Singh S, Demers L, Cuccia L, Reven L. Langmuir. 1996;12:1262–1269. [Google Scholar]
- 33.Schmitt H, Badia A, Dickinson L, Reven L, Lennox RB. Adv Mater. 1998;10:475–480. doi: 10.1002/(SICI)1521-4095(199804)10:6<475::AID-ADMA475>3.0.CO;2-I. [DOI] [PubMed] [Google Scholar]
- 34.Fiurasek P, Reven L. Langmuir. 2007;23:2857–2866. doi: 10.1021/la0629781. [DOI] [PubMed] [Google Scholar]
- 35.Zhu Y, Peng AT, Carpenter K, Maguire JA, Hosmane NS, Takagaki M. J Am Chem Soc. 2005;127:9875–9880. doi: 10.1021/ja0517116. [DOI] [PubMed] [Google Scholar]
- 36.Xu M, Zhang T, Gu B, Wu JL, Chen Q. Macromolecules. 2006;39:3540–3545. [Google Scholar]
- 37.Berrettini MG, Braun G, Hu JG, Strouse GF. J Am Chem Soc. 2004;126:7063–7070. doi: 10.1021/ja037228h. [DOI] [PubMed] [Google Scholar]
- 38.Anderson RC, Jarema MA, Shapiro MJ, Stokes JP, Ziliox M. J Org Chem. 1995;60:2650–2651. [Google Scholar]
- 39.Anderson RC, Stokes JP, Shapiro MJ. Tetrahedron Lett. 1995;36:5311–5314. [Google Scholar]
- 40.Wehler T, Westman J. Tetrahedron Lett. 1996;37:4771–4774. [Google Scholar]
- 41.Keifer PA, Baltusis L, Rice DM, Tymiak AA, Shoolery JN. J Magn Reson, Ser A. 1996;119:65–75. [Google Scholar]
- 42.Shapiro MJ, Chin J, Marti RE, Jarosinski MA. Tetrahedron Lett. 1997;38:1333–1336. [Google Scholar]
- 43.Keifer PA. Drug Discovery Today. 1997;2:468–478. [Google Scholar]
- 44.Warrass R, Wieruszeski JM, Boutillon C, Lippens G. J Am Chem Soc. 2000;122:1789–1795. [Google Scholar]
- 45.Warrass R, Lippens G. J Org Chem. 2000;65:2946–2950. doi: 10.1021/jo9914824. [DOI] [PubMed] [Google Scholar]
- 46.Taylor JL, Wu CL, Cory D, Gonzalez RG, Bielecki A, Cheng LL. Magn Reson Med. 2003;50:627–632. doi: 10.1002/mrm.10562. [DOI] [PubMed] [Google Scholar]
- 47.Keshari KR, Zektzer AS, Swanson MG, Majumdar S, Lotz JC, Kurhanewicz J. Magn Reson Med. 2005;53:519–527. doi: 10.1002/mrm.20392. [DOI] [PubMed] [Google Scholar]
- 48.Li W, Lee REB, Lee RE, Li JH. Anal Chem. 2005;77:5785–5792. doi: 10.1021/ac050906t. [DOI] [PubMed] [Google Scholar]
- 49.Li W. Analyst. 2006;131:777–781. doi: 10.1039/b605110c. [DOI] [PubMed] [Google Scholar]
- 50.Weybright P, Millis K, Campbell N, Cory DG, Singer S. Magn Reson Med. 1998;39:337–345. doi: 10.1002/mrm.1910390302. [DOI] [PubMed] [Google Scholar]
- 51.Polito L, Monti D, Caneva E, Delnevo E, Russo G, Prosperi D. Chem Commun. 2008;5:621–623. doi: 10.1039/b716113a. [DOI] [PubMed] [Google Scholar]
- 52.Sadasivan S, Khushalani D, Mann SJ. Mater Chem. 2003;13:1023–1029. [Google Scholar]
- 53.Bauer F, Glasel HJ, Hartmann E, Bilz E, Mehnert R. Nucl Instrum Methods Phys Res B. 2003;208:267–270. [Google Scholar]
- 54.Badia A, Lennox RB, Reven L. Acc Chem Res. 2000;33:475–481. doi: 10.1021/ar9702841. [DOI] [PubMed] [Google Scholar]
- 55.Badia A, Demers L, Dickinson L, Morin FG, Lennox RB, Reven L. J Am Chem Soc. 1997;119:11104–11105. [Google Scholar]
- 56.Pawsey S, Yach K, Reven L. Langmuir. 2002;18:5205–5212. [Google Scholar]
- 57.Fiurasek P, Reven L. Langmuir. 2007;23:2857–2866. doi: 10.1021/la0629781. [DOI] [PubMed] [Google Scholar]
- 58.Zhou HY, Du FF, Li X, Zhang B, Li W, Yan B. J Phys Chem C. 2008;112:19360–19366. [Google Scholar]
- 59.Kohlmann O, Steinmetz WE, Mao XA, Wuelfing WP, Templeton AC, Murray RW, Johnson CS. J Phys Chem B. 2001;105:8801–8809. [Google Scholar]
- 60.Zhu YH, Peng AT, Carpenter K, Maguire JA, Hosmane NS, Takagaki M. J Am Chem Soc. 2005;127:9875–9880. doi: 10.1021/ja0517116. [DOI] [PubMed] [Google Scholar]
- 61.Nidumolu BG, Urbina MC, Hormes J, Kumar C, Monroe WT. Biotechnol Prog. 2006;22:91–95. doi: 10.1021/bp050165h. [DOI] [PubMed] [Google Scholar]
- 62.Yoo BK, Joo SW. J Colloid Interface Sci. 2007;311:491–496. doi: 10.1016/j.jcis.2007.02.036. [DOI] [PubMed] [Google Scholar]
- 63.Tan H, Zhan T, Fan WY. J Phys Chem B. 2006;110:21690–21693. doi: 10.1021/jp065652+. [DOI] [PubMed] [Google Scholar]
- 64.Shi D, He P. Rev Adv Mater Sci. 2004;7:97–107. [Google Scholar]
- 65.Ren SF, Zhang L, Cheng ZH, Guo YL. J Am Soc Mass Spectrom. 2005;16:333–339. doi: 10.1016/j.jasms.2004.11.017. [DOI] [PubMed] [Google Scholar]
- 66.Chen WY, Wang LS, Chiu HT, Chen YC, Lee CY. J Am Soc Mass Spectrom. 2004;15:1629–1635. doi: 10.1016/j.jasms.2004.08.001. [DOI] [PubMed] [Google Scholar]
- 67.Ugarov MV, Egan T, Khabashesku DV, Schultz JA, Peng H, Khabashesku VN, Furutani H, Prather KS, Wang H-WJ, Jackson SN, Woods AS. Anal Chem. 2004;76:6734–6742. doi: 10.1021/ac049192x. [DOI] [PubMed] [Google Scholar]
- 68.Xu S, Li Y, Zou H, Qiu J, Guo Z, Guo B. Anal Chem. 2003;75:6191–6195. doi: 10.1021/ac0345695. [DOI] [PubMed] [Google Scholar]
- 69.Najam-ul-Haq M, Rainer M, Schwarzenauer T, Huck CW, Bonn GK. Anal Chim Acta. 2006;561:32–39. [Google Scholar]
- 70.Male KB, Li J, Bun CC, Ng S-C, Luong JHT. J Phys Chem C. 2008;112:443–451. [Google Scholar]
- 71.Li J, Vergne MJ, Mowles ED, Zhong WH, Hercules DM, Lukehart CM. Carbon. 2005;43:2883–2893. [Google Scholar]
- 72.Lee J, Yang J, Ko H, Oh SJ, Kang J, Son JH, Lee K, Lee SW, Yoon HG, Suh JS, Huh YM, Haam S. Adv Funct Mater. 2008;18:258–264. [Google Scholar]
- 73.Ago H, Kugler T, Cacialli F, Salaneck WR, Shaffer MSP, Windle AH, Friend RH. J Phys Chem B. 1999;103:8116–8121. [Google Scholar]
- 74.Holzinger M, Abraham J, Whelan P, Graupner R, Ley L, Hennrich F, Kappes M, Hirsch A. J Am Chem Soc. 2003;125:8566–8580. doi: 10.1021/ja029931w. [DOI] [PubMed] [Google Scholar]
- 75.Kumar A, Mandal S, Selvakannan PR, Pasricha R, Mandale AB, Sastry M. Langmuir. 2003;19:6277–6282. doi: 10.1021/la034209c. [DOI] [PubMed] [Google Scholar]
- 76.Bruce IJ, Sen T. Langmuir. 2005;21:7029–7035. doi: 10.1021/la050553t. [DOI] [PubMed] [Google Scholar]
- 77.del Campo A, Sen T, Lellouche J-P, Bruce IJ. J Magn Mater. 2005;293:33–40. [Google Scholar]


