Abstract
Currently, there is need for laboratory based high-throughput and reliable point-of-care drug screening methodologies. We demonstrate here a chip-based label-free porous silicon (PSi) photonic sensor for detecting opiates in urine. This technique provides a cost-effective alternative to conventional labeled drug screening immunoassays with potential for translation to multiplexed analysis. Important effects of surface chemistry and competitive binding assay protocol on the sensitivity of opiate detection are revealed. Capability to tune sensitivity and detection range over ∼3 orders of magnitude (18.0 nM – 10.8 μM) was achieved by varying the applied urine specimen volume (100 – 5 μl), which results in systematic shifts in the competitive binding response curve. A detection range (0.36 – 4.02 μM) of morphine in urine (15 μl) was designed to span the current positive cut-off value (1.05 μM morphine) in medical opiate urine screening. Desirable high cross-reactivity to oxycodone, in addition to other common opiates: morphine, morphine-3-glucuronide, 6-acetyl morphine demonstrates an advantage over current commercial screening assays, while low interference with cocaine metabolite was maintained. This study uniquely displays PSi sensor technology as an inexpensive, rapid, and reliable drug screening technology. Furthermore, the versatile surface chemistry developed can be implemented on a range of solid-supported sensors to conduct competitive inhibition assays.
1. Introduction
Drug testing in the clinical toxicology laboratory has shifted in recent years from mainly supporting the emergency department to meeting the demands of various clinical services for managing the medical consequences of drug abuse.1 This includes testing of: newborns in pediatrics, organ transplant candidates, compliance of patients for pain management, and patients in psychiatry and addiction medicine programs. In addition, forensic testing demands the highest standards of analysis for drug testing in the workplace, in rehabilitation clinics, and for law enforcement. Protocols exist to test patient specimens for various drug classes (e.g. opiates, amphetamines, cocaine, marijuana) above a predetermined cut-off concentration using screening immunoassays (Table S1). Urine remains to be the preferred drug-screening medium, although alternate specimens (e.g. oral fluid, sweat, hair) provide unique advantages in specific testing situations.1,2 Advantages of urinalysis include non-invasive collection, stability of specimens, and relatively higher concentration and longer detection period for most drugs of abuse (DOA) allowing detection and quantitation with relatively inexpensive instrumentation. As is the case with all immunoassays, the probe antibody dictates specificity. Due to the similarity of chemical structures within drug classes (e.g. opiates, Table 1) commercially available antibodies tend to exhibit high cross-reactivity in immunoassays. Hence, confirmatory chemical analysis (e.g. gas chromatography - mass spectrometry, GC-MS) in a laboratory setting is required for all specimens that are screened positive. However, it is important to note that immunoassays serve a practical means to analyze high quantities of specimens when the majority will test negative.
Table 1.
Chemical Data for Drug Analytes Tested
| Drug Class | Opiates | Cocaine Metabolite | |||
|---|---|---|---|---|---|
| Compound | Morphine | Morphine-3βd-glucuronide | 6-Acetyl Morphine | Oxycodone | Benzoylecgonine |
| Chemical Structure | 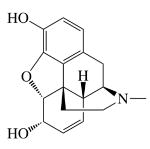 |
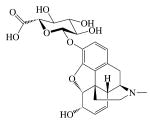 |
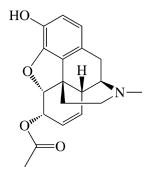 |
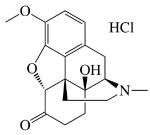 |
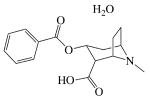 |
| MW (g mol-1) | 285.34 | 461.462 | 327.37 | 351.82 | 292.34 |
Most commercial screening tests utilize a competitive immunoassay in which free target analyte in a specimen competes with a labeled target analogue for binding to an antibody raised against the target analyte. The label may be a radioisotope,3 fluorophore,4 or most commonly an enzyme that produces changes in light absorbance.5,6 Label-free sensor technologies, such as surface plasmon resonance (SPR), are also currently being investigated for DOA detection.7 However, the development of high-throughput systems to reduce the operational costs and long result turn around times associated with existing drug testing procedures continues to pose a substantial challenge to toxicology laboratories. Recent interest has also focused on developing reliable point-of-care (POC) drug screening tests for a variety of settings including emergency departments, drug and/or pain treatment clinics, workplace, and enforcement of traffic laws.1,2,8,9
We propose that PSi optical sensors can simplify and provide a cost advantage to current screening detection methodologies due to their simple fabrication process and versatility in assay protocol with direct label-free detection that minimizes stability concerns associated with labels or enzymes. To meet high demands of drug testing the PSi biosensing technique has shown potential for cost-effective high-throughput analysis through the use of on-chip spotted arrays10 and random distributions of encoded beads.11 Moreover, the capability for specific detection in complex biological specimens such as whole blood and serum12 and visual colorimetric readout13-15 highlights the potential to use PSi sensors in POC applications.
PSi is fabricated by electrochemical etching of doped crystalline silicon in an electrolyte solution containing hydrofluoric acid. Changes in the characteristics of the silicon wafer starting material and etching process parameters (e.g. applied current density and electrolyte solution constituents) control the resulting porous film morphology and can be tuned to optimize interactions with biomolecules in sensing applications.16 Various PSi photonic architectures including single and double layered Fabry-Pérot films17,18 and more complex multilayer Bragg mirrors,19 rugate filters11, and microcavities20,21 have been used as biochemical sensors. The white light reflectivity spectra of these PSi optical transducers are used to monitor changes in effective optical thickness (EOT) due to addition or loss of material from within the pores. EOT is a function of the refractive index (η) and thickness of the material filling the porous volume.16 Sensitive and specific capture of target molecules within a heterogeneous solution has been achieved through direct binding to complementary probe molecules attached to the pore surface area.17,21. The volume-surface area ratio of the PSi transducer and spatial distribution of biomolecular probes play major roles in PSi affinity-based immunoassay sensitivity.20,22 Detection of small molecules inherently suffers using the direct binding assay as their small size produces EOT changes that are difficult to measure with typical PSi transducers. This leads us towards investigating the use of a competitive binding assay to indirectly detect small molecular weight molecules with high sensitivity.
Use of competitive binding assays have demonstrated improved detection sensitivity of small molecules in other refractive index-based sensing techniques such as surface plasmon resonance biosensors.23 In 2005, Tinsley-Bown et al. demonstrated proof-of-concept detection of a small molecule 2, 4, 6 trinitrotoluene (TNT, 227 Da) at 10 μg ml-1 (44 μM) in buffer with a PSi sensor using a competitive binding assay.24 Investigation of how competitive binding assays can further improve small molecule detection sensitivity in PSi while maintaining high specificity in complex biological solution is needed to meet clinical application goals and is the focus of the study reported here.
We incorporate a competitive inhibition assay into a PSi Bragg mirror transducer and investigate how surface chemistry, assay protocol, and solution volume effect specificity and sensitivity of small molecule detection. Opiates are detected in urine to demonstrate PSi as a feasible screening immunoassay technique over clinically relevant detection ranges spanning the current positive cut-off value (300 ng ml-1, 1.05 μM) used for opiate medical testing in urine. In our assay, morphine 3-β-D-glucuronide (M3G, urinary metabolite of morphine/codeine) is used as an opiate analogue and covalently attached to a BSA-blocked PSi surface. The test urine specimen is added to the sensor chip directly followed by a fixed amount of antibody. Target opiate analyte in the test specimen competes with the surface-attached opiate analogue for binding sites on the antibody. The amount of antibody bound to the immobilized opiate analogue is therefore proportional to the target opiate analyte concentration in the test specimen. Increases in EOT due to antibody binding to the opiate analogue covered PSi surface is monitored as red wavelength shifts in the characteristic reflectance peak of the PSi Bragg mirror.
Specificity is essential for reliable results as the sensor wavelength shift response reflects competitive binding of all molecules that express affinity toward the probe antibody and any non-specific binding of interferent species in the test specimen. Cross-reactivity to four common opiates that have similar chemical structures was also quantified in our system. Here, in the case of a blanket-screening assay, similar reactivity for all opiates is desirable. Interference of the urinary metabolite of cocaine (benzoylecgonine) was also quantified as a negative control small molecule. This sensing technique is appealing for clinical and POC applications as PSi sensor fabrication is inexpensive, straightforward optical detection does not require any secondary label amplification, and fully derivatized sensors do not have sensitive antibody immobilized to the transducer surface allowing for more robust storage prior to testing patient specimens.
2. Experimental Section
2.1. Preparation of PSi Sensors
Methods employed to produce PSi Bragg mirrors have been described elsewhere.16 Briefly, PSi was etched into n+ <100> silicon wafers (Sb doped, 0.01-0.03 Ω-cm) in electrolyte containing Pluronic L31 (0.1%) and hydrofluoric acid (5%). The Bragg mirror architecture consisted of 16 alternating layers of porosity (78 and 92%) with a total thickness (∼2.88 μm) measured by scanning electron microscopy (SEM). The average pore diameters for high and low porosity layers (106 and 73 nm respectively) measured by SEM have previously been shown to allow sufficient infiltration of proteins in an immunoassay.22 The wavelength shift sensitivity (WSS = 231.5 nm RIU-1) was determined by tracking the infiltration of liquids with known η values. After dry thermal oxidation (900 °C, 3 min) all PSi sensors were amino-silanized with (3-aminopropyl)triethoxysilane (APTES, 2 wt%) in methanol (50%) for 15 min, then rinsed with methanol and water, dried with nitrogen gas, and kept at 100°C for 20 min to cross-link the silane layer and evaporate any remaining solvent.
2.2. Attachment of Opiate Analogue to PSi Surface
Scheme 1 illustrates three different surface chemistries investigated to attach two different opiate analogues to the PSi sensor surface. The first procedure (Scheme 1a) used carbodiimide chemistry to covalently attach M3G as an opiate analogue to the amino-silanized PSi surface. M3G solid compound was received as a generous gift from the National Institute on Drug Abuse (Maryland, USA). Briefly, the 1-(3-Dimethylaminopropyl)-3-ethylcarbodiimidehydrochloride (EDC) coupling reagent forms a stable amide bond between the carboxyl group present in the glucuronide side chain on the M3G (Table 1) and an amine group on the PSi surface. M3G (8.67 mM), EDC (0.2 M) and N-hydroxysuccinimide (NHS, 0.05 M) were diluted in phosphate buffered saline buffer (PBS pH 5.4) and mixed for 15 min to activate the M3G carboxyl group. The M3G/EDC/NHS solution (15 μl) was then added to the amino-silanized PSi chip in a humidified enclosure. After (1 hr) incubation at RT the PSi sensors were rinsed three times with PBS (pH 7.4). The remaining surface of the M3G-functionalized sensors was then blocked with bovine serum albumin (BSA, 1 wt% in PBS, pH 7.4). The sensors were then rinsed three times with PBS (pH 7.4) and once with 1 wt% trehalose sugar in PBS and dried with nitrogen gas. The trehalose buffer was added prior to drying, because it has been previously shown to maintain stability of proteins after rehydration.25,26
Scheme 1.
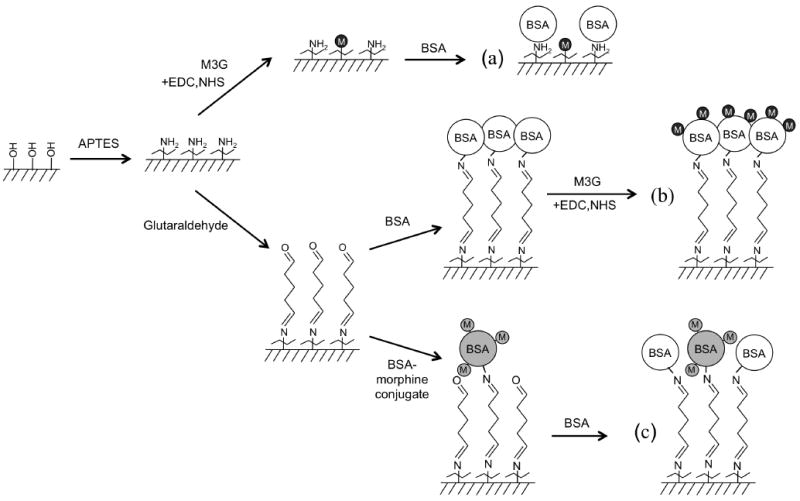
Surface chemistry to attach opiate analogue to PSi substrate for opiate competitive inhibition assay.
For Schemes 1 b and 1 c, the amino-silanized PSi sensors were treated with glutaraldehyde (2% in water, 30 min at RT) in a humidified chamber and subsequently rinsed with water and dried in nitrogen gas to form an aldehyde-terminated surface layer. In the second procedure (Scheme 1b), the aldehyde-functional PSi surface was exposed to BSA (1 wt% in phosphate buffered saline buffer, PBS, pH 7.4). Imine bonds form between the aldehyde surface groups and amines on the BSA (45 min at RT). Carbodiimide chemistry was subsequently used to covalently attach M3G as an opiate analogue to the BSA-blocked PSi surface using the same protocol discussed for Scheme 1a. Briefly, the EDC coupling reagent forms a stable amide bond between the carboxyl group present in the glucuronide side chains on M3G molecules (Table 1) and amine groups present on a surface-bound BSA molecule. After EDC coupling was completed and chips were rinsed three times with PBS (pH 8.5) ethanolamine (15 μl, 1M in PBS, pH 8.5) was added (30 min, RT) to deactivate any activated carboxylic acid groups present on the surface-bound BSA. The M3G-functionalized sensors were then rinsed three times with PBS (pH 7.4) and once with 1 wt% trehalose in PBS and dried with nitrogen gas. A dilution series study (0.02 – 8.67 mM M3G) showed that subsequent binding of anti-morphine antibody (α-M Ab) increased with increased concentration of M3G applied to the sensor, achieving near saturation at the M3G solubility limit (Fig. S1). Therefore, the aqueous solubility limit of M3G (8.67 mM) was used for assay development to facilitate maximum α-M Ab binding signal.
Finally in Scheme 1c a commercial morphine-BSA conjugate (M-BSA, MyBiosource, San Diego, USA) was attached to the aldehyde-functional PSi sensor via reaction with amines on the M-BSA. The sensors were rinsed three times with PBS (pH 7.4). After coupling the sensor was blocked with BSA (1 wt% in PBS, pH 7.4), rinsed three times with PBS (pH 7.4) and once with 1 wt% trehalose sugar (Scheme 1 c). The commercial M-BSA is specified to contain a 123:1 molar ratio of carboxymethyl morphine precursor to BSA. Unfortunately, it is difficult to quantify the number of M3G that bind to the BSA-blocked PSi sensor in Scheme 1 b as M3G (MW 461.46 g mol-1) is a small molecule and the sensitivity of the PSi transducer is insufficient to detect its direct binding. Nonetheless, the presence of active EDC-coupled M3G is validated by the systematic increase in subsequent α-M Ab binding with proportional increases in applied M3G concentration (Fig. S1). Dose response studies show that a chosen concentration of M-BSA (0.07 mg ml-1) also attained near saturation of subsequent α-M Ab binding and produced a similar sensor response level as was measured for the M3G surface attachment chemistry (Fig. 1a).
Figure 1.
Investigation of M3G and M-BSA analogue attachment chemistries (refer to Scheme 1) effect on PSi immunosensor response. (a) Specific binding of fixed aliquot of α-M Ab (15 μl, 1.83 μM) and (b) Non-specific binding of a fixed aliquot of unrelated protein (15 μl, 6.67 μM Rabbit IgG) to different PSi surface-bound analogue chemistries. (c) PSi competitive inhibition assay response to varying applied morphine concentrations (0.035 – 35 μM) with M3G (Scheme 1b) and M-BSA (Scheme 1c) attachment chemistries. Each curve was fit to a four-parameter logistic equation and corresponding curve steepness values were found to be 1.67 ± 0.30 and 2.22 ± 0.42 and the EC50 values were found to be 1.35 ± 0.15 and 0.82 ± 0.08 for the M3G and M-BSA chemistries respectively.
2.3. Opiate PSi Immunosensor Assay Protocol
Sensor performance and opiate detection was investigated employing four protocols as depicted in Scheme 2. Protocol II is the main competitive inhibition assay used to investigate sensor performance in these studies. Here, drug-free urine was collected from healthy volunteers. Various concentrations of opiates (∼3.5 nM – 300 μM) were spiked into the drug-free urine samples and added to the analogue-functional PSi sensors prepared above. The volume of the spiked urine specimens added to the sensors was varied in different experiments (5 - 200 μl). Immediately after (< 60 s) a fixed aliquot (15 μl) of monoclonal mouse anti-morphine IgG1 (α-M Ab, 1.83 μM, MyBiosource, MBS318578, San Diego, USA) diluted in 0.05 wt% Tween 20 in PBS (PBS-T, pH 7.4) was added and mixed thoroughly with a pipette. This monoclonal mouse antibody, raised against a morphine-bovine thyroglobulin conjugate, was chosen based on its broad reactivity to various opiates as desired for a screening assay. After reaction in a humidity chamber (1 hr at RT) sensors were rinsed three times with PBS-T and soaked for 5 min in PBS-T before drying with nitrogen gas and optical readout.
Scheme 2.
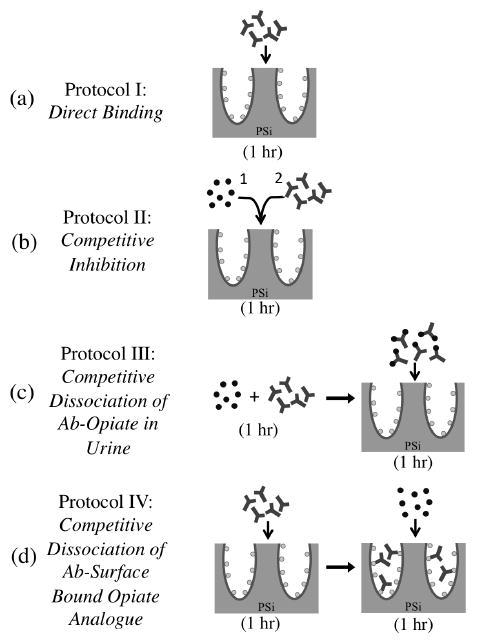
Different assay protocols investigated on the M3G opiate-analogue derivatized PSi sensor with varying the temporal addition of α-M Ab and morphine-spiked urine specimen. (Not drawn to scale.)
To compare detection sensitivity using protocols I-IV a fixed concentration of morphine was spiked into the drug-free urine samples (15μl, 1.05 μM) and a fixed concentration of α-M Ab (15 μl of 1.83 μM) was diluted in PBS-T (pH 7.4). For protocol I (Scheme 2a), only α-M Ab was added to the analogue-functional PSi sensors prepared above. After reaction in a humidity chamber (1 hr at RT) the sensors were rinsed three times with PBS-T and soaked 5 min in PBS-T before drying with nitrogen gas and optical readout. Procedures for protocol II (Scheme 2b) are described above. Protocol III (Scheme 2c) involved prior equilibration of the morphine spiked urine and α-M Ab solution (1 hr. at RT) in an eppendorf tube prior to sensor application. The equilibrated solution was then added to the analogue-functional PSi sensors prepared above and incubated in a humidity chamber (1 hr at RT). The sensors were subsequently washed as described for protocol I, dried with nitrogen gas, and optically evaluated.
A competitive dissociation assay was developed in protocol IV (Scheme 2d) where the α-M Ab solution was first applied to the analogue-functional PSi sensors prepared above and incubated in a humidity chamber under static conditions (1 hr at RT). Sensors were rinsed three times with PBS-T and kept wet while the morphine spiked urine specimen was added to the sensor in a humidity chamber (1 hr at RT). The sensors were subsequently washed as described for protocol I, dried with nitrogen gas, and optically evaluated.
2.4. Optical Detection of PSi Sensor Reflectance Spectra
The PSi sensors were held within a custom fixture and exposed to a normal incident beam of white light (spot size ∼1.3 mm2). Reflectance spectra normal to the surface were measured using an Advantes 3648-USB2 spectrophotometer (optical resolution of 0.06 nm pixel-1). All measurements were taken on dry samples following exposure and wash procedures as described above. Error bars in plots represent the interday standard deviation of each data point taken with a minimum of n=2 for inter-day experiment trials and 3 measurement locations per sensor (intra-assay n=3). Nonlinear least squares curve fitting was performed with Origin 7.0.
2.5. Stability of PSi Sensors in Urine Specimens
The pH of all urine specimens tested in this study were measured to be within the normal physiologic range (4.5 – 8.0).[2] Each day new negative control urine specimens were attained and stored in 4° C until use; therefore standard deviations shown in all plots also include variation in urine pH over multiple days. Stability control studies of BSA-blocked PSi sensors showed negligible drift in signal while soaked in urine for a 4 hr period (data not shown). This is consistent with literature in that thermally oxidized macroporous Si (especially with further surface chemistry such as silane) is stable under these conditions.27
2.6. Opiate Competitive Binding Assay in Enzyme-Linked Immunoassay (ELISA)
To compare the PSi sensor response to a gold standard technique we conducted a competitive inhibition ELISA using similar M3G opiate analogue surface chemistry (Scheme 1b) and assay protocol II (Scheme 2b). A 96 well microplate was blocked with 1 wt% BSA at RT (30 min). EDC coupling chemistry was utilized to attach M3G opiate analogue to the BSA-blocked well surface as described for the PSi sensor. Briefly, M3G (0.06 mM), EDC (0.2 M) and NHS (0.05 M) were mixed in PBS (pH 5.4) for 15 min to activate carboxyl groups in the M3G and the solution (50 μl) was added to each well in the BSA blocked plate. After 2 hr incubation at RT, to allow covalent attachment of M3G to the surface bound BSA, the plate was washed twice with PBS-T (pH 7.4) and once with PBS (pH 8.5). Ethanolamine (50 ml, 1M) was added to deactivate any EDC activated carboxylic acid groups present in the surface-bound BSA molecules. Opiates were spiked into drug free urine specimens in a dilution series (0.002 – 35 μM, 50 μl) and added to the M3G-derivitized plate. A urine specimen with no M3G (50 μl PBS only) was used as a negative control. A fixed concentration of mouse α-M Ab (0.13 μM) was immediately mixed with the test urine specimens in each well and incubated at RT for 1 hour. The plate was washed 3 times with KPL wash solution (part # 50-63-00, 0.002 M imidazole, 0.02% Tween 20, 0.5 mM EDTA, 160 mM NaCl) before a secondary antibody (goat anti-mouse IgG conjugated with alkaline phosphatase) was applied (100 μl of 1 μg ml-1). After washing three times and soaking for 5 min in KPL wash solution, alkaline phosphatase substrate (100 μl Blue Phos, KPL) was added. Absorbance intensity at 492 nm wavelength was detected after 30 min with a microplate reader (Fininstruments) to determine the amount of bound mouse α-M Ab as a function of opiate concentration. Experiments were repeated twice on two separate days and dilutions were run in duplicate. Error bars present in ELISA graphed results indicate standard deviation of these measurements.
3. Results and Discussion
3.1. Investigation of Target Analogue Surface Attachment Chemistry
The sensitivity and specificity of the PSi immunosensor was evaluated for sensors functionalized using three different chemistries to attach two different surface-bound opiate analogues: M3G and commercially available M-BSA conjugate (Scheme 1) according to procedures described above. The wavelength shift response of the PSi sensor was employed to monitor direct binding of complementary α-M Ab (Fig. 1a) and non-specific binding of Rabbit IgG (Fig. 1b) to each opiate analogue-functional surface. In Figure 1a, a fixed concentration of a α-M Ab (1.83 μM) resulted in similar wavelength shifts for commercial M-BSA reagent (Scheme 1 c) and when M3G analogue was attached to surface-bound BSA (Scheme 1 b). In comparison less α-M Ab was observed to bind to the M3G analogue when it was attached to the aminosilanized PSi surface (Scheme 1a). This suggests that more M3G binding sites may be available on the surface-bound BSA molecules (via carbodiimide coupling to the various surface amine groups) than are present on the aminosilanized PSi surface. However, due to the large internal surface area of PSi allowing for numerous surface M3G attachment sites, a more plausible cause is that after M3G surface attachment the subsequent BSA blocking step (MW=68,000 g mol-1) induces steric hindrance of the α-M Ab (MW = 150,000 g mol-1) interacting with the small surface-bound opiate analogue (M3G, MW = 461.462 g mol-1). Evidence that BSA is bound to the PSi surface during the BSA blocking step is provided by a wavelength shift (3.63 ± 0.13 nm). As expected, this value is significantly lower than the wavelength shift (11.40 ± 0.55 nm) measured for BSA directly binding to an aminosilanized surface with no surface-attached M3G analogue.
In Figure 1b the developed M3G/BSA surface chemistry illustrated less non-specific binding of an unrelated protein (Rabbit IgG, 6.67 μM) suggesting an advantage over the commercial M-BSA product. Some spurious background signal remains with use of the M-BSA surface analogue chemistry in comparison to the negligible wavelength shift observed for M3G/BSA chemistry (Fig. 1b). These results suggest that using carbodiimide coupling chemistry to covalently attach the M3G opiate analogue (Scheme 1b) to the BSA-blocked PSi sensor is the preferred choice. This linking chemistry is also versatile and can be used for site-oriented surface attachment of various target analogue molecules that contain a carboxyl group as described in detail in the Experimental Section.
The competitive inhibition assay response to increasing concentrations of morphine spiked into drug free urine (0.01 – 10 μg ml-1) from healthy volunteers was compared for M3G/BSA analogue surface chemistry (Scheme 1b) and for the commercial M-BSA reagent (Scheme 1c) and results show analogous trends (Fig. 1c). No obvious effect from urine pH is evident for the morphine-dose response curve compared to results attained in PBS (Fig. S2). Drug-free urine specimens with variable pH were used as negative controls. In Figure 1c an initial maximum wavelength shift plateau is observed, as α-M Ab binding to the PSi surface-bound opiate analogue is unaffected in the presence of morphine at low concentration (< 0.1 μM). As increasing concentrations of morphine are added to the system, the α-M Ab binding to the surface-bound analogue becomes inhibited and a corresponding decrease in wavelength shift magnitude is observed until no detectable α-M Ab binds to the PSi surface-bound analogue (second minimum plateau). Response curves for each of the target analogue attachment chemistries show comparable detection ranges (∼0.3 – 3.0 μM, ∼0.1 – 0.9 μg ml-1) with similar slopes (Fig. 1c). This indicates similar assay sensitivity over a clinically relevant range including the positive cut-off value for opiates in a urine screening immunoassay (0.3 μg ml-1). Comparable specificity is observed as no spurious background signal is observed at high concentrations of morphine in urine and the sensor signal returns to a zero baseline for both M-BSA and M3G/BSA surface chemistries (Fig. 1c). However, in anticipation of more large-scale screening the possibility for unhealthy patients including those with renal disease to secrete higher protein concentrations in urine28 drove us to choose M3G/BSA analogue attachment chemistry (Scheme 1b) as the more robust choice as it showed less non-specific binding of protein in Fig. 1b. The remaining results in this paper were achieved utilizing this M3G/BSA analogue attachment chemistry (Scheme 1b) and more extensive analysis of assay sensitivity and response curve fitting will be given.
3.2. Comparison of Protocols for Competitive Assay
In traditional solution-phase competitive binding assays the binding of a competitor molecule (e.g. target analog) to a receptor (e.g. Ab) is sensitive to the rate parameters of the ligand molecule (e.g. target) as well as the timing and order of addition of the competitor and ligand molecules.29 To achieve optimum PSi sensor performance we investigated variations in the assay protocol as illustrated in Scheme 2. In all cases the binding of a fixed aliquot of α-M Ab (15 μl, 1.83 μM) to the surface-attached M3G/BSA opiate analogue was measured as a red wavelength shift and the magnitude was compared for each assay protocol (Fig. 2). Protocol I yields the maximum wavelength shift that can be attained, for direct binding of the α-M Ab with no competition of added target opiates (Scheme 2a). Competitive binding assay protocols II, III, and IV all illustrate smaller wavelength shift values as competition with the morphine spiked into the urine specimen (1.05 μM) reduces α-M Ab binding to the M3G opiate analogue attached to the PSi surface (Fig. 2).
Figure 2.
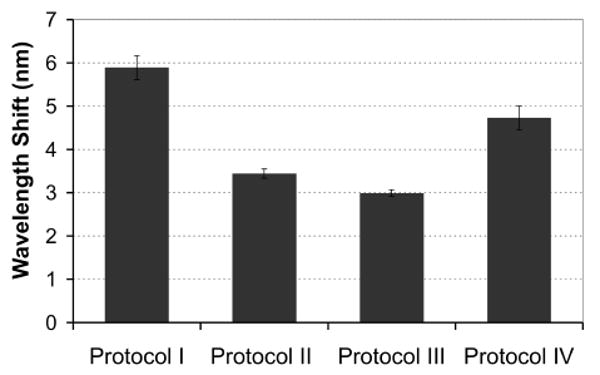
Comparison of different assay protocols effect on binding of a fixed amount of α-M Ab (15 μl, 1.83 μM) to the M3G opiate-analogue derivatized PSi sensor (interday n=2, with intrassay n=3 each day). Protocol I: direct binding of α-M Ab (positive control, no competition). Protocols II-IV introduce competition with addition of morphine spiked into urine specimens (15 μl, 1.05 μM). Protocol II: competitive inhibition assay created by morphine spiked urine specimen and α-M Ab solution being added at same time. Protocol III: dissociation assay as morphine spiked urine specimen and α-M Ab solution are equilibrated prior to adding to sensor. Protocol IV: dissociation assay as α-M Ab is pre-bound to the PSi sensor and morphine spiked urine is subsequently added.
The competitive inhibition assay used in protocol II (Scheme 2b, urine specimen and α-M Ab are added to PSi sensor together) is anticipated to be sensitive to the concentration of free opiates in the urine and the on-rate with the α-M Ab.29 In Protocol III we allow for a 1 hr pre-incubation of the morphine spiked urine specimen with the α-M Ab before addition to the sensor (Scheme 2c). If the on-rate is high (low Kd), as is expected for antibody binding, then we anticipate measuring similar results for both protocols II and III. Optical measurements in fact do show similar wavelength shifts for competitive assay protocols II and III after the 1 hr time test interval (Fig. 2). In protocol IV (Scheme 2d) α-M Ab was bound to the sensor prior to addition of the morphine spiked urine specimen. Although a reduction in wavelength shift relative to the direct binding (no competition Protocol I) was observed, a larger wavelength shift magnitude resulted compared to competitive binding assay protocols II and III (Fig. 2). This suggests that the α-M Ab has greater affinity (lower Kd) for the surface-bound M3G opiate analogue, as is also suggested by the cross-reactivity studies discussed below (Section 3.3). However, performing the assay in a nanostructured PSi template adds additional complexity (surface immobilization in a confined porous volume) to the competitive binding kinetics (refer to discussion of Figure 5 in section 3.4). Due to the additional equilibration times (+1 hr) implemented in protocols III and IV and the diminished response of protocol IV, the competitive inhibition assay format in protocol II was chosen for the remaining studies.
Figure 5.
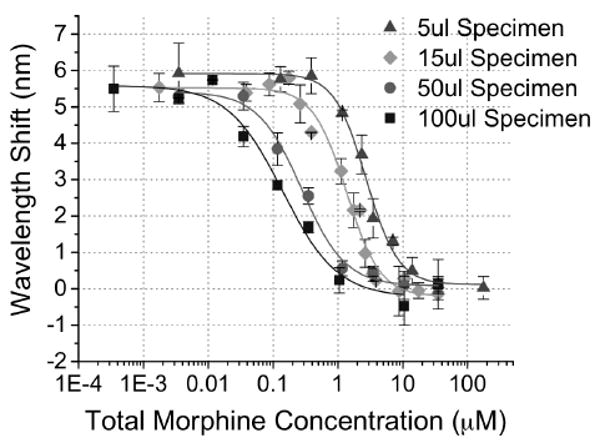
Solution Volume Effects on Sensitivity of PSi Competitive Inhibition Immunosensor Response. Sensor optical response to urine specimens of different volume (5, 15, 50, 100 μl) spiked with a range of morphine concentrations (3E-4 – 200 μM). The applied α-M Ab amount was kept fixed at 15 μl of 1.83 μM. (inter-day n ≥ 2 for each volume specimen tested with intra-assay n=3 each day.)
3.3. Study of Sensor Specificity: Assay Relative Reactivity to Common Drugs in Urine
The developed PSi competitive inhibition assay response to varying concentrations of common opiates including morphine, M3G (the urinary metabolite of morphine/codeine), 6-acetyl morphine (6-AM, heroine metabolite), and oxycodone spiked into 15 μl volume urine specimens was analyzed (Fig. 3a). Wavelength shift response was normalized to the maximum shift attained with antibody binding to the surface-attached opiate analogue in drug-free urine (5.55 ± 0.33 nm, n=7). Qualitatively the response curve for each opiate is similar in sensitivity and dynamic range. Quantitative fit parameters of these curves can be compared in Table S2. The cross-reactivity for each opiate was quantified at the positive opiate cut-off value for opiates in urine (0.3 μg ml-1) by calculating the relative assay response to each opiate in reference to the response attained for morphine (100%). Cross-reactivity values of 135% for M3G, 116% for oxycodone, and 124% for 6-AM indicate that the assay is slightly more sensitive to each of these opiates than to morphine under the specific test conditions. Negative control experiments showed minimal cross-reactivity of the sensor to cocaine metabolite (BE) spiked into urine (< 3%). Ideally a screening assay would show similar cross-reactivity values for all opiates; however in practice cross-reactivity profiles vary over a wide range depending upon the immunoassay techniques and in particular the choice of probe antibody. Therefore, knowledge of the sensor reactivity to different drugs within a class must be determined before designing the positive cutoff value for a particular immunoassay screening test.2, 5-7, 9 Here, the observed high reactivity towards oxycodone displays an advantage over the majority of currently available commercial opiate immunoassays which often show low cross-reactivity with oxycodone and its metabolites.1
Figure 3.
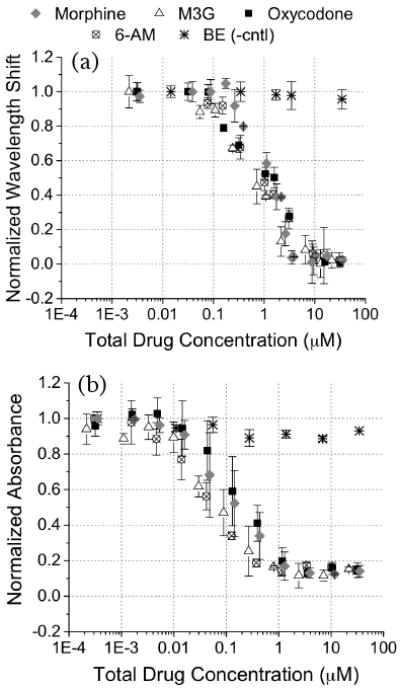
Comparison of specificity of developed competitive binding inhibition assay in (a) a PSi immunosensor (interday n=3 with intrassay n=3 each day) and (b) ELISA (interday n=2 with intrassay n=2 each day). The dose response to varying concentrations of opiates (morphine, M3G, oxycodone, and 6-AM) and a negative control cocaine metabolite (BE) spiked in drug-free urine specimens was analyzed.
For qualitative comparison of specificity, the results of the PSi opiate competitive inhibition assay were compared to ELISA as described in the Experimental section (Fig. 3 a and 3 b). We observe that that the effective concentration where 50% of signal response is attained (EC50) in ELISA is ∼10× lower than the PSi sensor and a slightly lower sensitivity (steepness of slope) results in a moderately larger dynamic range. Refer to supplementary data (Table S3) for quantitative logistic fit parameters. It is of interest to point out that for ELISA at high morphine concentrations a spurious background signal remains (∼12%) as the response curve does not return to zero and larger standard deviations (error bars) in measurement are observed. This is likely due to amplification of the non-specific binding along with the specific binding signal as ELISA is an enzyme-amplified technique. It may be possible that with proper optimization of blocking chemistry this spurious background signal could be diminished in ELISA30, however this was not the focus of the present work. Qualitative comparison of assay specificity revealed good agreement between the ELISA and the PSi sensor techniques thus validating the direct optical detection performance of the PSi transducer. Also the high reactivity observed for all four opiates tested in both the PSi sensor and ELISA suggests, as expected, that the probe antibody and analogue surface attachment chemistry dictate the specificity of the immunoassay. Use of a PSi sensor displays distinct advantages over the standard ELISA including less complicated label-free detection, reduced cost, and reduction in test time.
3.4. Investigation of Immunosensor Sensitivity
These studies focus on how further changes in the competitive inhibition assay protocol may control the detection sensitivity of analytes in the PSi immunosensor to meet needs of various clinical applications. It would be very appealing if a base sensor design with a defined surface-coverage of opiate analogue could be fabricated, stored until needed, and by simply varying aspects of the assay protocol (e.g. specimen volume) it would be possible to achieve a tunable detection sensitivity and dynamic range. This would permit sensitive measurements over a wide concentration range with minimal alterations in sensor manufacturing.31 Towards achieving these goals we explored how varying the antibody concentration and urine specimen volume could effect detection sensitivity.
Reducing the concentration of antibody used in the competitive inhibition assay is one way to effectively alter sensor response. PSi immunosensor response curves were generated for morphine (3.5 nM – 35 μM) spiked into drug-free urine with addition of two different antibody concentrations (1.83 and 0.73 μM, Fig. 4). It is observed that the lower antibody concentration results in a smaller magnitude of the initial plateau value. This is consistent with less total α-M Ab present to bind opiate analogue inside the PSi sensor, which has been demonstrated in direct binding assays (Figure S3). With a lower α-M Ab concentration, less morphine in solution is also required to inhibit α-M Ab binding. This has the desired effect of shifting the binding response curve toward lower morphine concentrations (Fig. 4). The empirical logistic equation was fit to each of the curves (Table S4). The effective concentration where 50% of signal response was attained (EC50) demonstrates the midpoint of the detection range for each curve. Lowering the α-M Ab concentration ∼2.51 fold (1.83 to 0.73 μM) resulted in a ∼2.53 fold downward shift in EC50 values (1.36 to 0.53 μM morphine respectively). This indicates a lower limit of detection can be attained using a lower α-M Ab concentration, however this also results in an undesirable reduction in signal to noise ratio (Fig. 4) that consequently could result in higher occurrence of false sensor readouts.
Figure 4.
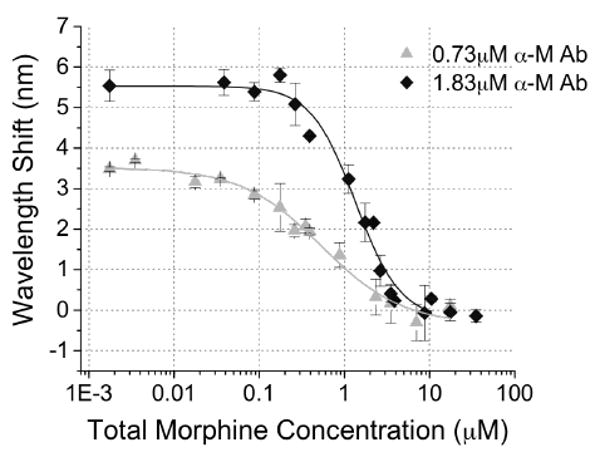
Effect of decreasing α-M Ab concentration from 1.83 μM (15 μl, inter-day n=7 with intra-assay n=3 each day) to 0.73 μM (15 μl, inter-day n=3 with intra-assay n=3 each day) on PSi competitive inhibition immunosensor response to varying morphine concentrations (0.002 – 35 μM) spiked into a fixed volume of urine specimen (15 μl).
Alternatively, the effect of urine specimen volume on PSi competitive inhibition immunosensor response was studied using a series of sensors with the same base opiate analogue surface-attachment chemistry. We observe that changes in detection sensitivity and range of detection can be achieved by varying the volume of morphine spiked urine specimens (Fig. 5). The empirical logistic equation was fit to each of the response curves and results are tabulated in Table 2. As urine specimen volume was increased from 5 – 100 μl, the EC50 value and linear detection range systematically shifts towards lower morphine concentrations while maintaining the same signal to noise ratio. These changes are consistent with an increase in molar ratio of morphine to α-M Ab with increasing urine specimen volumes. By changing assay specimen volume PSi sensors were capable of detecting morphine in urine over ∼3 orders of magnitude of concentration (17.5 nM – 10.8 μM, 0.005 – 3.077 μg ml-1).
Table 2.
Analysis of Morphine Response Calibration Curves with Varying Urine Specimen Volumes fit to a Four-Parameter Logistic Equation.
| Urine Specimen Volume (μl) | Goodness of Fit, R2 | Initial Plateau, A1 (nm) | Final Plateau, A2 (nm) | EC50, x0 (μM) | Curve Steepness (nm μM-1) | Detection Range (μM) |
|---|---|---|---|---|---|---|
| 5 | 0.9927 | 5.916 ± 0.166 | 0.115 ± 0.180 | 2.732 ± 0.236 | 1.773 ± 0.268 | 1.088 – 10.767 |
| 15 | 0.9832 | 5.521 ± 0.188 | -0.209 ± 0.218 | 1.356 ± 0.149 | 1.682 ± 0.299 | 0.359 – 4.023 |
| 50 | 0.9930 | 5.413 ± 0.233 | 0.079 ± 0.173 | 0.275 ± 0.043 | 1.291 ± 0.232 | 0.043 – 1.582 |
| 100 | 0.9841 | 5.587 ± 0.301 | -0.228 ± 0.297 | 0.141 ± 0.036 | 1.034 ± 0.240 | 0.018 – 0.819 |
It is of interest to note that the steepness of the response curves (Table 2) is observed to increase as the applied urine specimen volume decreases. This phenomenon is attributed to the fact that signal is generated from α-M Ab binding to the surface attached opiate analogue within the fixed internal volume of the porous sensor (∼52 nL based on geometrical approximations). Changing the applied specimen volume on top of the sensor does not alter the effective surface-attached analogue concentration inside the pore volume. However, the α-M Ab concentration applied on top of the porous sensor is diluted by the applied specimen volume. Previous studies, employing a competitive binding biosensor in a semi-permeable membrane, which fixed the concentration of receptor and competitor upon increasing specimen volume, showed similar changes in the steepness of the response curve slope. Changes in applied specimen volume was theorized to be analogous to changes in binding equilibrium constants.31 This interesting sensing system provides the capability to tune between higher precision testing over a smaller dynamic concentration range of target and lower detection sensitivity over a wider dynamic concentration range depending on the clinical application. In the case of opiate drug detection, the series of sensors as shown here (Fig. 5) also span the positive cutoff values of opiates in oral fluid (40 ng ml-1, Table S1) and physiological ranges in serum.32
4. Conclusions
We have demonstrated here the development of a label-free competitive inhibition assay in a PSi sensor to optically detect opiates in urine over a range of physiologically relevant concentrations. The developed competitive inhibition assay format facilitates improved detection of small molecules by approximately three orders of magnitude (limit of detection = 0.018 μM, 5 ng ml-1) compared to what was previously reported with the PSi optical biosensing technique.24 In addition, control of sensor sensitivity and dynamic range was achieved by varying the specimen volume applied to the sensor. High reactivity to oxycodone in addition to three other opiates defines an advantage over many commercially available immunoassays that cannot detect oxycodone.1 The PSi photonic device and the assay protocol developed here are appealing for clinical and POC applications as the straightforward optical detection does not require any secondary label amplification as needed in currently available enzyme immunoassays and the fully derivatized sensors does not have sensitive antibody immobilized to the transducer surface allowing for more robust storage prior to testing patient specimens. In addition, fabrication remains inexpensive and high-throughput analysis is plausible with chip-based array technology. Future work will focus on measuring the assay cross-reactivity to various opiates and metabolites and screening clinical patient samples while benchmarking results to existing gold standard techniques. We also aim to achieve visual color readout upon positive screening results in these devices for use in POC applications.
Supplementary Material
The supporting information included in a separately submitted file contains the following listed figures and tables which give further quantitative detail of the development of the competitive binding inhibition assay to detect opiates in urine:
I. Table S1: Cutoff Values for DOA Screening Used in Medical Testing
II. Figure S1: Anti-Morphine Ab Binding with Increasing M3G Applied in EDC Coupling Chemistry
III. Figure S2: Morphine Response Curve in PBS (pH 7.4) vs. Urine with Varying pH
IV. Table S2: Logistic Fit Parameters to PSi Sensor Response to Various Opiates Spiked into Urine
V. Table S3: Logistic Fit parameters to ELISA Response to Various Opiates Spiked into Urine
VI. Figure S3: α-M Ab Binding with Increasing α-M Ab Applied to Sensor that was derivatized with EDC-M3G Analogue Attachment Chemistry
VII. Table S4: Logistic Fit parameters to Morphine Response Curve with Varying Antibody Concentration
Acknowledgments
The authors graciously thank the NIH/NIAID (5K25AI060884) and NIH/NIDA (T32DA007232, F31DA025398) for financial support of this research, Prof. Benjamin Miller for insightful chemistry and biosensor discussions, Dr. Tai C. Kwong for helpful discussions of drug abuse testing and metabolism, and the NIH/NIDA for their generous gift of morphine-3-glucuronide compound.
References
- 1.Kwong TC, Dasgupta A, Garg U. In: Handbook of Drug Monitoring Methods, Therapeutics and Drugs of Abuse. Dasgupta A, editor. Humana Press; New Jersey: 2008. pp. 297–364.pp. 395–406. [Google Scholar]
- 2.Heit HA, Gourlay DL. Journal of Pain and Symptom Management. 2004;27:260–267. doi: 10.1016/j.jpainsymman.2003.07.008. [DOI] [PubMed] [Google Scholar]
- 3.Cleeland R, Christenson J, Usategui-Gomez M, Heveran J, Davis R, Grunberg E. Clin Chemistry. 1976;22:712–725. [PubMed] [Google Scholar]
- 4.O'Connell KP, Valdes JJ, Azer NL, Schwartz RP, Wright J, Eldefrawi ME. J of Immun Methods. 1999;225:157–169. doi: 10.1016/s0022-1759(99)00041-1. [DOI] [PubMed] [Google Scholar]
- 5.Lu NT, Taylor BG. Forensic Sci Int. 2006;157:106–116. doi: 10.1016/j.forsciint.2005.03.022. [DOI] [PubMed] [Google Scholar]
- 6.Spanbauer AC, Casseday S, Davoudzadeh D, Preston KL, Huestis MA. J Anal Toxicol. 2001;25:515–519. doi: 10.1093/jat/25.7.515. [DOI] [PubMed] [Google Scholar]
- 7.Dillon PP, Daly SJ, Manning BM, O'Kennedy R. Biosens Bioelectron. 2003;18:217–227. doi: 10.1016/s0956-5663(02)00182-3. [DOI] [PubMed] [Google Scholar]
- 8.Yang JM, Lewandrowski KB. Clinica Chimica Acta. 2001;307:27–32. doi: 10.1016/s0009-8981(01)00457-0. [DOI] [PubMed] [Google Scholar]
- 9.Crouch DJ, Walsh MJ, Cangianelli L, Quintela O. Ther Drug Monitoring. 2008;30:188–195. doi: 10.1097/FTD.0b013e3181679249. [DOI] [PubMed] [Google Scholar]
- 10.Ressine A, Finnskog D, Malm J, Becker C, Lilja H, Marko Varga G, Laurell T. NanoBioTechnology. 2005;1:93–103. [Google Scholar]
- 11.Cunin F, Schmedake TA, Link JR, Li YY, Koh J, Bhatia SN, Sailor MJ. Nature Mater. 2002;1:39–41. doi: 10.1038/nmat702. [DOI] [PubMed] [Google Scholar]
- 12.Bonanno LM, DeLouise LA. Biosens Bioelectron. 2007;23:444–448. doi: 10.1016/j.bios.2007.05.008. Whole Blood PSi. [DOI] [PMC free article] [PubMed] [Google Scholar]
- 13.Orosco MM, Pacholski C, Miskelly GM, Sailor MJ. Adv Mater. 2006;18:1393–1396. [Google Scholar]
- 14.Gao L, Mbonu N, Cao L, Gao D. Anal Chem. 2008;80:1468–1473. doi: 10.1021/ac701870y. [DOI] [PubMed] [Google Scholar]
- 15.Link JR, Sailor MJ. Proc Nat Acad Sci. 2003;100:10607–10610. doi: 10.1073/pnas.1233824100. [DOI] [PMC free article] [PubMed] [Google Scholar]
- 16.Vinegoni C, Cazzanelli M, Pavesi L. In: Silicon-Based Materials and Devices. Nalwa HS, editor. Academic Press; New York, USA: 2001. pp. 123–187. [Google Scholar]
- 17.Lin VSY, Motesharei K, Dancil KS, Sailor MJ, Ghadiri MR. Science. 1997;278:840–843. doi: 10.1126/science.278.5339.840. [DOI] [PubMed] [Google Scholar]
- 18.Pacholski C, Sartor M, Sailor MJ, Cunin F, Miskelly GM. J Am Chem Soc. 2005;127:11636–11645. doi: 10.1021/ja0511671. [DOI] [PMC free article] [PubMed] [Google Scholar]
- 19.Snow PA, Squire EK, St J Russel PA, Canham LT. J Appl Phys. 1999;86:1781. [Google Scholar]
- 20.Ouyang H, Striemer CC, Fauchet PM. Appl Phys Let. 2006;88:163108. [Google Scholar]
- 21.Chan S, Horner SR, Miller BL, Fauchet PM. J Am Chem Soc. 2001;123:11797–11798. doi: 10.1021/ja016555r. [DOI] [PubMed] [Google Scholar]
- 22.Bonanno LM, DeLouise LA. Langmuir. 2007;23:5817–5823. doi: 10.1021/la063659c. [DOI] [PMC free article] [PubMed] [Google Scholar]
- 23.Shimomura M, Nomura Y, Zhang W, Sakino M, Lee KH, Ikebukuro K, Karube I. Anal Chimica Acta. 2001;434:223–230. [Google Scholar]
- 24.Tinsley-Bown A, Smith RG, Hayward S, Anderson MH, Koker L, Green A, Torrens R, Wilkinson AS, Perkins EA, Squirrel DJ, Nicklin S, Hutchinson A, Simons AJ, Cox TI. Phys Stat Sol (a) 2005;202:1347–1356. [Google Scholar]
- 25.Nan X, Shumaker-Parry JS, Zareie MH, Campbell CT, Castner DG. Langmuir. 2004;20:3710–3716. doi: 10.1021/la035864n. [DOI] [PubMed] [Google Scholar]
- 26.Jairo J, Michel P. Curr Med Chem. 2004;11:439–446. [Google Scholar]
- 27.Dancil KPS, Greiner DP, Sailor MJ. J Am Chem Soc. 1999;121:7925–7930. [Google Scholar]
- 28.Jafar TH, Stark PC, Schmid CH, Landa M, Maschio G, Marcantoni C, De Jong PE, De Zeeuw D, Shahinfar S, Ruggenenti P, Remuzzi G, Levey AS. Kidney International. 2001;60:1131–1140. doi: 10.1046/j.1523-1755.2001.0600031131.x. [DOI] [PubMed] [Google Scholar]
- 29.Sklar LA, Sayre J, McNeil VM, Finney DA. Molec Pharm. 1985;28:323–330. [PubMed] [Google Scholar]
- 30.Kerrigan S, Phillips WH., Jr Clinical Chem. 2001;47:540–547. [PubMed] [Google Scholar]
- 31.Weber SG. Anal Chem. 1992;64:330–332. doi: 10.1021/ac00047a004. [DOI] [PubMed] [Google Scholar]
- 32.Toennes SW, Kauert GF, Steinmeyer S, Moeller MR. For Sci Int. 2005;152:149–155. doi: 10.1016/j.forsciint.2004.08.002. [DOI] [PubMed] [Google Scholar]
Associated Data
This section collects any data citations, data availability statements, or supplementary materials included in this article.
Supplementary Materials
The supporting information included in a separately submitted file contains the following listed figures and tables which give further quantitative detail of the development of the competitive binding inhibition assay to detect opiates in urine:
I. Table S1: Cutoff Values for DOA Screening Used in Medical Testing
II. Figure S1: Anti-Morphine Ab Binding with Increasing M3G Applied in EDC Coupling Chemistry
III. Figure S2: Morphine Response Curve in PBS (pH 7.4) vs. Urine with Varying pH
IV. Table S2: Logistic Fit Parameters to PSi Sensor Response to Various Opiates Spiked into Urine
V. Table S3: Logistic Fit parameters to ELISA Response to Various Opiates Spiked into Urine
VI. Figure S3: α-M Ab Binding with Increasing α-M Ab Applied to Sensor that was derivatized with EDC-M3G Analogue Attachment Chemistry
VII. Table S4: Logistic Fit parameters to Morphine Response Curve with Varying Antibody Concentration


