

Abstract
Neuroligins are cell adhesion molecules involved in synapse formation and/or function. Neurons express four neuroligins (NL1–NL4), of which NL1 is specific to excitatory and NL2 to inhibitory synapses. Excitatory and inhibitory synapses include numerous subtypes. However, it is unknown whether NL1 performs similar functions in all excitatory and NL2 in all inhibitory synapses, or whether they regulate the formation and/or function of specific subsets of synapses. To address this central question, we performed paired recordings in primary somatosensory cortex of mice lacking NL1 or NL2. Using this system, we examined neocortical microcircuits formed by reciprocal synapses between excitatory neurons and two subtypes of inhibitory interneurons, namely, fast-spiking and somatostatin-positive interneurons. We find that the NL1 deletion had little effect on inhibitory synapses, whereas the NL2 deletion decreased (40–50%) the unitary (cell-to-cell) IPSC amplitude evoked from single fast-spiking interneurons. Strikingly, the NL2 deletion had no effect on IPSC amplitude evoked from single somatostatin-positive inhibitory interneurons. Moreover, the frequency of unitary synaptic connections between individual fast-spiking and somatostatin-positive interneurons and excitatory neurons was unchanged. The decrease in unitary IPSC amplitude originating from fast-spiking interneurons in NL2-deficient mice was due to a multiplicative and uniform downscaling of the amplitude distribution, which in turn was mediated by a decrease in both synaptic quantal amplitude and quantal content, the latter inferred from an increase in the coefficient of variation. Thus, NL2 is not necessary for establishing unitary inhibitory synaptic connections but is selectively required for “scaling up” unitary connections originating from a subset of interneurons.
Introduction
Neuroligins (NLs) are postsynaptic cell adhesion molecules thought to play a role in synapse formation and/or function by binding, at least in part, to presynaptic neurexins (Ushkaryov et al., 1992; Ichtchenko et al., 1995, 1996; Song et al., 1999; Dean et al., 2003; Goda and Davis, 2003; Missler et al., 2003; Scheiffele, 2003; Yamagata et al., 2003; Varoqueaux et al., 2004; Hussain and Sheng, 2005; Levinson and El-Husseini, 2005; Nam and Chen, 2005). The importance of neuroligins in brain function is indicated by the observation that mutations in NL3 and NL4 may cause autism (Jamain et al., 2003; Zoghbi, 2003; Laumonnier et al., 2004; Yan et al., 2005; Südhof, 2008).
Vertebrates express four neuroligin genes, namely, NL1 to NL4 (Ichtchenko et al., 1996; Bolliger et al., 2008). Overexpression of NL1, NL2, and NL3 increases synapse density in cultured neurons (Scheiffele et al., 2000; Prange et al., 2004; Boucard et al., 2005; Chih et al., 2005; Chubykin et al., 2005; Levinson et al., 2005). Knock-outs (KOs) of NL1, NL2, and/or NL3 suggest that neuroligins act in organizing the functional properties of synapses, and not their initial establishment (Varoqueaux et al., 2006; Chubykin et al., 2007). Both anatomic and electrophysiological evidence indicate that NL1 preferentially functions at excitatory synapses, and NL2 preferentially at inhibitory synapses (Song et al., 1999; Graf et al., 2004; Varoqueaux et al., 2004; Chubykin et al., 2007), but this specificity is not observed in all studies (Prange et al., 2004; Levinson and El-Husseini, 2005). Moreover, immunocytochemistry suggests that alternative splicing of NL1 and NL2 determines their preferential effects on excitatory versus inhibitory synapses (Chih et al., 2005, 2006), but no such effect was detected in electrophysiological studies (Chubykin et al., 2007).
Measurements of evoked synaptic transmission have shown that deletion of NL2 impairs inhibitory synapse function (Chubykin et al., 2007). However, this study relied on extracellular stimulation to evoke inhibitory responses. With this approach, changes in other parameters, such as excitability of axons, might confound the results. Moreover, some synaptic properties, such as the frequency of unitary (cell-to-cell) connections, cannot be discerned with this method. Finally, there are different subtypes of inhibitory neurons with diverse characteristics (Freund and Buzsaki, 1996; Gonchar and Burkhalter, 1997), and extracellular stimulation will nonselectively excite all of these. Therefore, it is unknown how inhibitory synapses originating from different subtypes are regulated by NL2, or even perhaps by NL1.
To resolve these issues, we used KO mice lacking NL1 and NL2, and examined synaptic function between individual neighboring excitatory and inhibitory neurons in neocortex. We focused on connections associated with two different types of inhibitory neurons: fast-spiking (FS) (also known to be parvalbumin-positive inhibitory neurons) and somatostatin-positive neurons (Cauli et al., 1997; Galarreta and Hestrin, 1999; Gibson et al., 1999). Our data support the specificity of NL2 for inhibitory synapses and, more importantly, show that NL2 function differs among the two subtypes of inhibitory neurons tested. Our data also suggest that NL2 is involved in the “scaling up” of unitary connections without changing their frequency distribution shape.
Materials and Methods
Mice.
Three mouse lines were used. First, the “original” neuroligin 1/2 deletion line was used to determine the effects of both NL1 and NL2. The creation of this line has been described (Varoqueaux et al., 2006; Chubykin et al., 2007). This is a single line in which both NL1 and NL2 mutant alleles are maintained by continuously backcrossing mice that are heterozygous for each allele, resulting in a spectrum of genotypes from double KO (DKO) mice to wild-type (WT) mice. Data were divided into four genotypic groups (Fig. 1; also see Figs. 10, 11 below and supplemental Fig. 8, available at www.jneurosci.org as supplemental material): WT* (at least one WT allele each of NL1 and NL2), NL1 knock-out (NL1 KO) which contained at least one WT NL2 allele, NL2 KO which contained at least one WT NL1 allele, and DKO.
Figure 1.

IPSC amplitudes mediated by layer 4 FS neurons are decreased in NL2 KO mice. A, Recording configuration (left), representative traces of presynaptic APs evoked in an FS neuron (top right, truncated vertically), and resulting unitary IPSCs in excitatory neurons (bottom right). IPSCs are averages from single neurons. APs are elicited in voltage-clamp and occur due to voltage escape at the site of AP generation. Pipette solution contained 6 mm Cl−. B, Average amplitudes of the first IPSC in the train (IPSC1) of the four genotypes examined [2-factor ANOVA, p < 0.005 for effect of NL2; p < 0.05 for NL2 KO vs WT*, multiple comparisons; a portion of the NL1 KO and WT* data have been published previously (Chubykin et al., 2007)]. C, No change in connection frequency with respect to genotype (χ2 test with Bonferroni correction; see Materials and Methods). Connection frequency is the percentage of pairs demonstrating a detectable IPSC. D, Amplitude plot for each IPSC in the train (normalized to IPSC1, 20 Hz). Norm Amp, Normalized amplitude. E, Quantification of data in D show that NL2 KO and NL1KO IPSCs have a decreased STP index compared with WT*, which indicates increased short-term depression. The STP index was calculated as Average(IPSC4&5)/IPSC1. All data shown are means ± SEMs (*p < 0.05 and **p < 0.01 compared with WT* by Fisher's PLSD). WT* refers to mice containing at least one WT copy each of NL1 and NL2. NL1 KO mice had at least one WT NL2 allele. NL2 KO mice had at least one WT NL1 allele.
Figure 10.

NL2 KO does not decrease IPSCs originating from layer 2/3 somatostatin-positive neurons. A, Recording configuration (left), representative traces of presynaptic APs evoked in a somatostatin-positive neuron (top right, truncated vertically), and resulting unitary IPSCs in excitatory neurons (bottom right). IPSCs are averages from single neurons. APs are elicited in voltage-clamp. Pipette solution contained 6 mm Cl−. B, IPSC1 amplitude was not detectably different based on genotype, although a statistical trend for an increase with NL2 deletion was apparent (2-factor ANOVA, p = 0.08). C, Connection frequency was unchanged (χ2 test with Bonferroni correction; see Materials and Methods). D, Amplitude plot for each IPSC in the train (normalized to IPSC1). E, Quantification of data in D shows that any genotype with NL2 deletion had a decreased STP index, which represents increased short-term depression (2-factor ANOVA, p < 0.003 for NL2). *p < 0.05 and **p < 0.01 compared with WT* using Fisher's PLSD. All data shown are means ± SEMs. Genotypic groups are described in the Figure 1 legend and in Materials and Methods. Norm Amp, Normalized amplitude.
Figure 11.

NL1 and NL2 KOs have complex effects on excitatory synapses targeting inhibitory neurons. A, B, Diagram of the recording configuration (top), representative traces of presynaptic action potentials evoked in excitatory neurons (middle, in voltage-clamp), and resulting unitary EPSCs in neighboring FS (A) and somatostatin-positive neurons (B) (bottom). EPSCs are averages from single neurons. C, D, Average EPSC1 is plotted as a function of the four different genotypes observed in FS (C) and somatostatin-positive (D) inhibitory neurons. C, NL2 deletion caused a significant increase in EPSC amplitude onto FS neurons compared with WT* (Fisher's PLSD, *p < 0.05). Interaction term in a two-factor ANOVA was also significant (p < 0.02). Connection frequency was unchanged (χ2 test with Bonferroni correction). D, No detectable alterations at somatostatin-positive neurons, although a trend for a two-factor ANOVA interaction was apparent (p = 0.06). E, F, Plots of STP index showing no changes in short-term plasticity. All data shown are means ± SEMs. A two-factor ANOVA was initially applied to C–F. Genotypic groups are described in the Figure 1 legend and Materials and Methods.
For all other experiments, we focused on the effects of NL2, and all mice were homozygous WT for NL1. Except for experiments using the GFP mouse lines described below, the “original” line was always used (except WT for NL1). Genotypes were divided into two groups: +/+,+/− versus −/−. The symbols “+/+,” “+/−,” and “−/−” indicate homozygous, heterozygous, and KO for NL2, respectively, and the genotypic group +/+,+/− included both NL2 homozygous and heterozygous mice (we also refer to this group as NL2[+/+,+/−]). This grouping was reasonable since we observed no difference in unitary IPSC amplitude, short-term plasticity (STP), or IPSC kinetics between NL2 homozygous and heterozygous mice (see Fig. 5B below) (data not shown for last two properties).
Figure 5.

Decreased IPSC amplitude in NL2 KO mice is accompanied by an increase in the CV and also represents a uniform shift in distribution. A, Representative presynaptic APs evoked in an FS neuron (top, 4 pulses, 20 Hz) and the resulting average postsynaptic unitary IPSCs (middle) in an excitatory neuron. Hollow bar indicates the time window in which individual responses for IPSC1 are plotted (bottom) (for all recordings, APs in current-clamp and 50 mm Cl− in the pipette). The ACSF contained 20 μm DNQX and 100 μm APV. B–D, Plots of the mean IPSC1 amplitude (B), connection frequency (χ2 test) (C), and mean CV (B–D) as a function of genotype. E, F, Cumulative distributions for the absolute (E) and scaled (F) unitary IPSC1 amplitudes. E, Distributions are different (p < 0.002, K-S test). F, The NL2[+/+,+/−] distribution was scaled down to 52%: a best fit to the NL2 KO distribution based on the least error sum of squares. After scaling, the distributions are not detectably different (K-S test). All data shown are means ± SEMs (*p < 0.05; **p < 0.01. Student's t test). The genotypic group NL2[+/+,+/−] includes both homozygous and heterozygous mice.
A second mouse line was obtained by crossing the original line with mice that express EGFP in parvalbumin-positive inhibitory neurons (G42 crossed with CB6F1/J, kindly provided by Josh Huang, Cold Spring Harbor Laboratory, Cold Spring Harbor, NY) (Chattopadhyaya et al., 2004). Similarly, a third line was obtained by crossing the original line with mice that express EGFP in somatostatin-positive inhibitory neurons (GIN mice, Jackson Laboratory) (Oliva et al., 2000). Specificity for GFP expression in parvalbumin- and somatostatin-positive neurons in these lines has already been demonstrated (Oliva et al., 2000; Chattopadhyaya et al., 2004). Both GFP mouse lines reliably marked inhibitory neurons since no GFP-positive neuron ever elicited an EPSC. All GFP cells in the G42 line were fast spiking, and EPSCs recorded in these cells had strongly depressing short-term dynamics and fast time courses, consistent with the properties of parvalbumin-positive neurons (Cauli et al., 1997; Reyes et al., 1998; Beierlein et al., 2003). Similarly, all GFP cells in the GIN line displayed all of the electrophysiological characteristics of somatostatin-positive neurons which, most saliently, included the highly facilitating EPSCs targeting these cells (see Fig. 11 below) (Reyes et al., 1998; Beierlein et al., 2003).
Consistent with previous results (Varoqueaux et al., 2006), the various KO mice exhibited differences in weight at the experimental ages used here [postnatal day 13 (P13)–P16]: 8.1 ± 0.2, 7.1 ± 0.4, 6.2 ± 0.3, and 4.1 ± 0.8 g for WT*, NL1 KO, NL2 KO, and DKO, respectively (n = 25, 6, 9, 4) (compared with WT*, the following weighed less: NL1 KO, p < 0.04 and NL2 KO and DKO, p < 0.0001).
Electrophysiology.
Acute thalamocortical slices were prepared as previously described (Agmon and Connors, 1991). Briefly, mice (P13–P16) were anesthetized with Euthasol, and the brain was removed following protocols approved by University of Texas Southwestern Medical Center (UT Southwestern). Slices of 350 μm thickness were cut at ∼4°C in dissection buffer, placed in normal ACSF at 35°C for 30 min, and slowly cooled to 21°C over the next 45 min. Whole-cell recordings were performed at 21°C in either layer 4 or layer 2/3 of the barrel field in somatosensory cortex. An experiment was analyzed if postsynaptic series resistance was <18 MΩ and if both series and input resistance did not change by >25% during the recording. Only experiments with a high seal resistance (> 3 GΩ) were analyzed. All data were collected and analyzed using Labview software (National Instruments). For a subset of experiments, cell capacitance was obtained using the fast decay constant observed in response to a voltage step in voltage-clamp (Gibson et al., 2006). Decay constants were derived by applying a least-squares fit of a double exponential (one fast and one slow time constant) to the first 10 ms of the transient response to a voltage step.
Cell identification.
Layer 4 FS cells were identified by their large size, low input resistance (<300 MΩ), short duration spikes, and nonadapting, high firing rates (>200 Hz at 21°C) (Connors and Gutnick, 1990; Gibson et al., 1999). GFP fluorescence was not used to identify layer 4 FS neurons. To distinguish layer 4 FS cells from other inhibitory neuron types, any initially identified FS cells having spike widths at half-height of >1 ms were not analyzed. Any initially identified FS cells evoking IPSCs with durations at half-height of >11 ms were not analyzed since most of the population had durations between 6 and 10 ms, and non-FS inhibitory neurons typically had durations in the 11–15 ms range. Neocortical FS neurons have been shown to be parvalbumin positive (Cauli et al., 1997; Galarreta and Hestrin, 1999; Gibson et al., 1999), and hence, sometimes these terms are used interchangeably. Layer 4 excitatory neurons had “regular-spiking” action potentials (APs), and to further distinguish them reliably from inhibitory neurons, were accepted for analysis only if spike width was >1.8 ms at half-height and input resistance was >300 MΩ. Inhibitory neurons in layer 2/3 were simply identified through GFP expression, and layer 2/3 excitatory neurons identified by pyramidal shaped somas and regular-spiking action potentials.
Electrophysiology solutions.
ACSF contained the following (in mm): 126 NaCl, 3 KCl, 1.25 NaH2PO4, 2 MgSO4, 26 NaHCO3, 25 dextrose, and 2 CaCl2. All slices were prepared in a sucrose dissection buffer containing the following (in mm): 75 sucrose, 87 NaCl, 3 KCl, 1.25 NaH2PO4, 7 MgSO4, 26 NaHCO3, 20 dextrose, and 0.5 CaCl2. All solutions were pH 7.4. ACSF was saturated with 95% O2/5% CO2. Low-Cl− KGluc pipette solution consisted of the following (in mm): 130 K-gluconate, 4 KCl, 2 NaCl, 10 HEPES, 0.2 EGTA, 4 ATP-Mg, 0.3 GTP-Tris, 14 phosphocreatine-Tris, 10 sucrose. High-Cl− KGluc pipette solution consisted of the following (in mm): 79 K-gluconate, 44 KCl, 6 NaCl, 10 HEPES, 0.2 EGTA, 4 ATP-Mg, 0.3 GTP-Tris, 14 phosphocreatine-Tris, 10 sucrose. KCl pipette solution consisted of the following (in mm): 146 KCl, 2 NaCl, 10 HEPES, 0.2 EGTA, 4 ATP-Mg, 0.3 GTP-Tris, 14 phosphocreatine-Tris, 10 sucrose. All solutions were adjusted to pH 7.25 and 290 mOsm. Junction potentials were ∼10, 9, and 2 mV, respectively, and were left uncorrected in traces.
Unitary PSCs.
A unitary PSC is the response in a single postsynaptic neuron due to an action potential evoked in a single presynaptic neuron, and it can be mediated by a single or multiple release sties. Unitary EPSCs and IPSCs were measured at holding potentials of −60 and −55 mV, respectively. A connection was considered to exist when the average peak amplitude was >2 pA. Average unitary amplitude refers to peak amplitude measured in 2 mm external [Ca2+], and this measurement includes response failures. Average “success” amplitude did not include failures. All PSC amplitudes were measured with respect to baseline immediately preceding the IPSC onset. Individual presynaptic action potentials were elicited with an 8 ms depolarizing voltage step (voltage-clamp recording, generally 15–25 mV) in some experiments and with an 8 ms current step in other experiments (current-clamp recording, generally 100–300 pA). Action potentials were able to be reliably elicited in voltage-clamp, probably due to the loss of voltage-clamp in the cell compartment in which the action potential was generated. STP was analyzed for connections whose average unitary IPSCs were greater than 9 pA (Fig. 1; also see Fig. 10 below) and 10 pA (see Figs. 5, 9, 11 below) and was quantified with the following STP index using PSC amplitudes in the train: Average(Last 2 PSCs)/PSC1, except for EPSCs targeting somatostatin-positive neurons, which were quantified as follows: Average(PSC7,PSC8)/Average(PSC1,PSC2). PSC1 refers to the first PSC in the train. For IPSCs, preceding PSCs in the train were subtracted before measuring the amplitude for more accurate measurement.
Figure 9.

IPSCs mediated by layer 2/3 parvalbumin-positive FS neurons are decreased in NL2 KO mice. A, Recording configuration (left), and representative traces of presynaptic APs evoked in a parvalbumin-positive FS neuron (top, truncated vertically) and resulting unitary IPSCs in excitatory neurons (bottom right). IPSCs are averages from single neurons. APs are elicited in voltage-clamp. Pipette solution contained 50 mm Cl−. The ACSF contained 20 μm DNQX and 100 μm APV. B–E, Plotted are IPSC1 amplitude (*p < 0.05) (B), connection frequency (χ2 test) (C), and short-term plasticity (D, E). All data shown are means ± SEMs. Student's t test for statistical significance. The genotypic group +/+,+/− includes both homozygous and heterozygous mice. Norm Amp, Normalized amplitude.
The coefficient of variation (CV) was calculated as the SD of IPSC1 amplitude divided by the average of IPSC1 amplitude (Faber and Korn, 1991). Unitary IPSCs with <2 pA average amplitude were not included in the CV analysis. Rise time for responses was defined as the time between the points at which the responses were 20 and 80% of peak. Duration was defined as the length of time at half-height of the response.
The decay time constant of an IPSC was calculated by fitting the data to an exponential function with only one time constant using the Levenberg–Marquardt algorithm (Labview, National Instruments). Two time constants usually did not improve the fit for IPSCs in this study, and at the same time, the fit was more variable among experiments. Response latency was defined by the point in time at which the line generated by the 20–80% rise slope of the IPSC intersected the baseline. The presynaptic reference time was the peak of the action potential. Both decay time constants and latency were derived from the average IPSC.
All recordings in Figure 1 [and below (see Figs. 10, 11)] were performed with the 6 mm Cl− KGluc pipette solution, and other recordings below (see Figs. 3–7, and 9) were performed with the 50 mm Cl− KGluc pipette solution. Unitary IPSCs were measured at −55 and −70 mV for 6 and 50 mm Cl− KGluc pipette solutions, respectively. The 50 mm Cl− KGluc pipette solution made IPSCs an inward current and was used to better resolve IPSCs because of the greater driving force with respect to reversal potential.
Figure 3.

Inhibitory quantal amplitude originating from FS neurons is not detectably altered when weaker unitary connections are excluded from examination. A, Sr2+ was substituted for Ca2+ to induce delayed, or asynchronous, release after a train of action potentials (15–20 at 20 Hz; see Materials and Methods). The resulting asynchronous synaptic events likely represent quanta at individual release sites. Traces are from a WT mouse, and the average unitary IPSC was ∼40 pA. Traces are presynaptic (Presyn.) APs (A1), IPSCs in 2 mm Ca2+ (A2), and IPSCs with Sr2+ substitution (A3). A4, Time epochs for measuring quantal events are marked by black bars and are expanded. Arrowheads mark a subset of quantal inhibitory events. Unitary connections with average amplitude of <15 pA were not analyzed, since the fewer asynchronous events at these connection strengths were significantly contaminated by spontaneously occurring events (see arrowheads in A3 and Materials and Methods). The pipette solution contained 50 mm Cl−. The ACSF contained 20 μm DNQX and 100 μm APV. +/+, +/−, and −/− indicate homozygous, heterozygous, and KO for NL2, respectively. The genotypic group +/+,+/− includes both homozygous and heterozygous mice. B, There was no detectable change in quantal event amplitude. C, The distribution and mean of average unitary IPSCs were not detectably different between NL2 KO and NL2[+/+,+/−] mice in this dataset (compare with Figs. 4G, 5E). A major factor accounting for this lack of difference may be our >15 pA selection bias (described in A; also see Results). This selection bias may have skewed these quantal amplitude results. Data shown are means ± SEMs.
Figure 4.
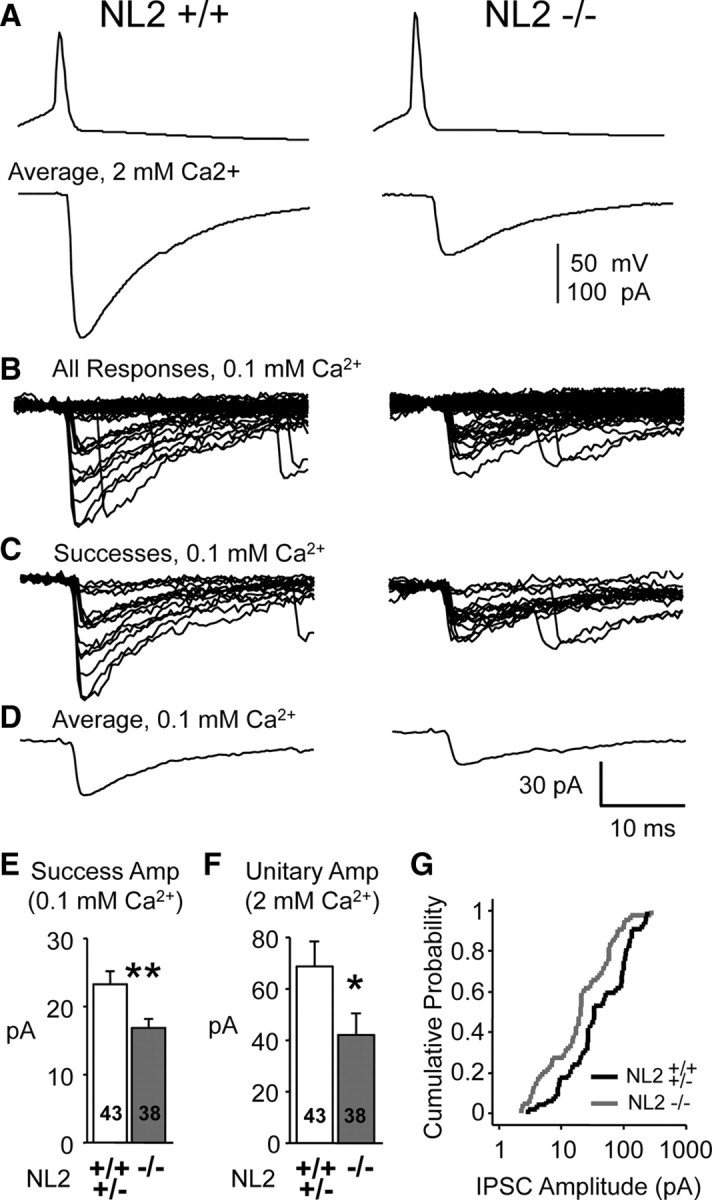
Inhibitory quantal events originating from FS neurons have reduced amplitude in NL2 KO mice when weaker unitary connections are included. A, APs were evoked in a presynaptic FS neuron (in current-clamp), and unitary IPSCs (average shown) were recorded in a postsynaptic excitatory neuron in 2 mm Ca2+. For these experiments, unitary connections with average amplitudes of >2 pA were analyzed—this was much less selective compared with the Sr2+ substitution experiments in Figure 3. The pipette solution contained 50 mm Cl−. The ACSF contained 20 μm DNQX and 100 μm APV. B–D, Representative traces from the same recordings portrayed in A, but after external Ca2+ was reduced to 0.1 mm. Long trains of APs were evoked (80–200 APs at 20–50 Hz), and IPSCs were recorded during trains in which APs elicited IPSCs <20% of the time (see Materials and Methods). These IPSC successes were presumed to represent quantal events. Shown are all potential IPSCs (B), IPSC successes only (presumed quantal events) (C), and average of successes (D). Calibration in D also applies to B and C. E, Mean quantal amplitude (as in D) over all unitary connections examined. F, Mean IPSC1 amplitude (as in A, 2 mm Ca2+) of the same dataset in E. G, Cumulative probability distributions of the data depicted in F. The distributions are different (p < 0.01, K-S test). Data shown are means ± SEMs (*p < 0.05; **p < 0.01; Student's t test). Amp, Amplitude.
Figure 6.

Quantal amplitude and CV changes in NL2 KO mice can be predicted by a uniform scaling of the unitary IPSC amplitude distribution from NL2-expressing mice. A, Quantal amplitude increases with increasing IPSC amplitude for both NL2[+/+,+/−] and NL2 KO mice (correlation: NL2[+/+,+/−] r = 0.54, NL2 KO r = 0.63; both p < 0.0001 when compared with zero; n = 43, 38; Fisher's r to z.) (A–D) are data replotted from Figure 4. B, Average quantal amplitude is calculated for each IPSC amplitude interval. Quantal amplitude increases with IPSC amplitude identically in both NL2[+/+,+/−] and NL2 KO mice (2-factor ANOVA, p < 0.0001 for unitary amplitude groups; no difference based on genotype, comparing only 4 leftmost points; for two NL2 KO points farthest to the right, n = 1). C, The frequency distribution for each IPSC amplitude interval is plotted, and a new distribution is derived by scaling down the NL2[+/+,+/−] distribution to 52% (gray circles). D, Average quantal amplitude is calculated for NL2[+/+,+/−] and NL2 KO data by weighting the amplitude (B) by the frequency (C) at each interval. Then, a prediction for the NL2 KO value is calculated by weighting the NL2[+/+,+/−] amplitudes (B) by the “52% scaled NL2[+/+,+/−]” distribution (C). The prediction error is <2%. E–H, The same calculations are performed for the CV. Data are replotted from Figure 5. E, The CV decreases with increasing IPSC amplitude for both NL2[+/+,+/−] and NL2 KO mice (correlation: NL2[+/+,+/−] r = −0.55, NL2 KO r = −0.53; both p < 0.0001 when compared with zero; n = 83, 85; Fisher's r to z). F, The CV decreases with IPSC amplitude identically in both NL2[+/+,+/−] and NL2 KO animals (2-factor ANOVA, p < 0.0001 for unitary amplitude groups; no difference based on genotype, comparing only 5 leftmost points; NL2 KO point farthest to the right, n = 1). G, As in C, the frequency distribution of the unitary amplitude is plotted for this dataset. H, Using the same calculation as in D, the CV in the NL2 KO can be predicted by a 52% scaling of the NL2[+/+,+/−] distribution. The prediction error is <3%. All data shown are means ± SEMs. The genotypic group NL2[+/+,+/−] includes both homozygous and heterozygous mice. See supplemental Figure 6, available at www.jneurosci.org as supplemental material, for log–log plots of A and E. Amp, Amplitude.
Figure 7.

No change in the IPSC kinetics in NL2 KO mice. A, B, Representative traces of IPSCs (A) and IPSPs (B) originating from FS neurons and observed in layer 4 excitatory neurons. Traces show presynaptic APs (top), IPSCs/IPSPs (middle), and normalized IPSCs/IPSPs (bottom). C–E, Mean IPSC rise time (C), IPSC duration at half-height (D), and IPSP rise time (E). One or two IPSPs were collected in every experiment during a current step protocol. See Materials and Methods for rise time calculation. All data shown are means ± SEMs. Student's t test for statistical significance. The genotypic group +/+,+/− includes both homozygous and heterozygous mice.
Miniature IPSCs.
Miniature IPSCs were measured with 1 μm TTX (Sigma), 20 μm DNQX (Sigma), and 100 μm APV (Sigma) in the bath and were analyzed using “Mini Analysis Program” (Synaptosoft). Cells were voltage-clamped at −70 mV, and a threshold of 8 pA was used for detecting events. Data were collected at 3 min intervals starting 2 min after attaining the intracellular recording. KCl pipette solution (148 mm Cl−) was used to increase the inhibitory synaptic current size. This solution was not used in the longer dual recording experiments because recordings became less stable and began to depolarize after 8 min of recording.
Strontium substitution.
Strontium substitution experiments were performed with 50 mm Cl− internal solution. The external solution at the beginning of the experiment contained 2/2 mm CaCl2/MgSO4 which was subsequently replaced with 4/4 mm SrCl2/MgSO4 (Gil et al., 1999). Asynchronous release events were induced by trains of action potentials (15–30 APs at 20 Hz) and were measured in a 300–700 ms window following the offset of the train. This window was offset by 40–200 ms after the last action potential, and both window size and offset were picked for each individual experiment depending on when delayed events were both frequent and could be individually measured. Only individual, isolated events were analyzed, and IPSCs of <15 pA average amplitude (measured in 2 mm Ca2+ before switching to Sr2+ external solution) were not analyzed, since measurements of asynchronous events at these connections were significantly contaminated by spontaneously occurring IPSCs (see Fig. 3 below). This contamination became an issue because weaker unitary connections displayed far fewer delayed, asynchronous events in Sr2+. The ACSF also contained 20 μm DNQX (Sigma) and 100 μm APV (Sigma).
Low-Ca2+ experiments.
Low-Ca2+ experiments were performed with 50 mm Cl− internal solution and with external 2/2 mm CaCl2/MgSO4 replaced by 0.1/3.9 mm CaCl2/MgSO4. Long action potential trains were applied, and the number (80–200) and frequency (20–50 Hz) of APs were modified to reduce the percentage of action potentials evoking an IPSC to <20%. These IPSCs are referred to as “successes” and were analyzed only if they (1) occurred within ±0.3 ms of the average IPSC latency (see above, Unitary PSCs, for latency definition), (2) were >3 pA, (3) had widths at half-height of >1 and <10 ms, and (4) had a peak latency of ±2 ms with respect to the average peak latency. The successes are referred to as “putative” quantal events, and their amplitudes were measured. Systematic error in these quantal amplitude measurements was calculated, and we estimate that our results may overestimate the actual difference in quantal amplitude between WT and NL2 KO mice (see Fig. 4 below) by only 2.1% (see supplemental Fig. 1, available at www.jneurosci.org as supplemental material, for details of error calculation). In support of our measurement of successes actually reflecting quantal events, a plot of CV against the ratio of “success amplitude in 0.1 Ca2+” to “amplitude in 2 Ca2+” (or “putative quantal size”/“unitary IPSC size” ratio) displays the expected monotonically increasing relationship (supplemental Fig. 6C, available at www.jneurosci.org as supplemental material). This suggests that our independent measurements of CV and quantal amplitude are consistent with each other and are fairly accurate. The ACSF also contained 20 μm DNQX (Sigma) and 100 μm APV (Sigma). Changing criterion #2 to >5 or >10 pA revealed similar decreases in quantal amplitude as depicted below (see Fig. 4), and therefore, the results are robust to this particular criterion (26 and 24% decreases, respectively).
Immunocytochemistry.
Mice (P21–P27: G42 strain) were anesthetized with Euthasol and transcardially perfused following protocols approved by UT Southwestern. The perfusion rate was 1.7 ml/min and began with ice-cold saline for 1 min followed by 15 min of 4% paraformaldehyde. The brain was then removed and postfixed in 4% paraformaldehyde for 30 min. Then it was mounted on a platform and 50 μm coronal sections through barrel cortex were cut on a vibrating slicer (Vibratome) in ice-cold PBS. After 3 10 min washes in PBS, slices were incubated in blocking solution (3% normal goat serum and 0.3% Triton in PBS) for 1 h. Slices were then incubated in blocking solution with primary antibodies overnight at 4°C. Primary antibodies were for GFP (1:1500, chick, Aves Laboratories, #GFP-1020) and vesicular GABA transporter (VGAT, 1:500, rabbit, Millipore Bioscience Research Reagents, #1AB5062P). After being washed three times for 10 min each in PBS, slices were incubated in blocking solution with secondary antibodies for 2 h at room temperature (Alexa 488 goat anti-chicken, 1:400, Invitrogen, #A11039; Alexa 555 goat anti-rabbit, 1:500, Invitrogen, #A21430). After a final 3× 10 min wash, slices were mounted on slides with glycerol.
Images of layer 4 in somatosensory cortex were collected on an inverted LSM 510 confocal microscope (Zeiss) with a 63× oil objective at 2× zoom. The pinhole was set to 1.5 Airy disc units, which corresponded to a 1.4 μm optical slice. A stack of three images with 1 μm intervals was collected beginning at the surface of the slice and the second section was used for analysis. A single sample was obtained from a 213 × 213 μm square divided into 9 71 × 71 μm squares. The center square contained a single GFP-positive soma, and puncta were counted in all other squares. This was considered one sample. Illumination intensity was always the same, but detection parameters were normalized (“Find” function in Zeiss software), and hence, absolute brightness could not be examined. The average detector gain for both VGAT and GFP imaging was decreased by 8 and 10% respectively in the NL2 KO, and the average offset was unchanged. Therefore, this normalization likely had little effect on our results. Images were analyzed using Metavue software. Images were first filtered with a linear bandpass kernel (0.17–1.8 cycles/μm, which emphasized structures 0.28–3 μm in size along one dimension). Then, punctum detection using a threshold 15 times the baseline signal was performed (Integrated Morphology Analysis module in Metavue). The minimum punctum area allowed was 0.04 μm2. Images were collected and analyzed blind to genotype.
Statistics.
When all four genotypes were compared, a one-way ANOVA followed by multiple comparisons (Fisher's PLSD) was performed. When indicated, a two-factor ANOVA was initially performed followed by the same multiple-comparisons test. Two-way comparisons were assessed with Student's t test (two way). A χ2 test was applied to determine changes in the percentage of connected pairs, and a Fishers Exact p value was used to determine significance. For unitary PSC data, sample number (n) is the number of recorded pairs. The number of mice used was on average 32% the number of all pairs tested (including nonconnected pairs). Statistical significance was p < 0.05 except for comparing connectivity between the three deletion genotypes and WT*, where a Bonferroni correction was made (p < 0.017). All error bars are SEMs. Distributions of IPSCs (see Figs. 3C, 4G, 5E,F, 6C,G below) were compared using a Kolmogorov–Smirnov test (K-S test). Data are always presented in the following order by genotype: WT (or WT* or NL2[+/+,+/−]), NL1 KO, NL2 KO, and DKO.
All genotypes originated from the same litters. For comparisons among four genotypes, all four genotypes were usually not present in a single litter, but data from at least one WT* pup and another genotype in the same litter were required for a given litter to be included. For NL2 [+/+,+/−] versus NL2 KO comparisons, at least one of each genotype was used from a single litter. All experiments and analysis were performed blind to genotype except for those in Figure 9 below.
Results
NL2 KO decreases the IPSC amplitude at unitary connections originating from layer 4 fast-spiking neurons
We initially examined the effect of the NL1 and NL2 deletion on inhibition provided by individual FS inhibitory interneurons onto excitatory neurons using single and double KO mice lacking NL1 and/or NL2 (“original” line; see Materials and Methods). Paired recordings from these two neuron types were performed in layer 4 barrels of primary somatosensory cortex, and results from the four different genotypes were compared. The paired recordings were used to measure individual, cell-to-cell connections, which are referred to as unitary connections.
A brief train of action potentials was evoked in the presynaptic FS inhibitory neuron (5 pulses, 20 Hz), and resulting IPSCs were recorded in the excitatory neuron (Fig. 1A). Consistent with the hypothesis that NL2 functions at inhibitory synapses, the amplitude of the first IPSC in the train (IPSC1) was decreased by 51% in the NL2 KO mice (Fig. 1B) (p < 0.05 for the NL2 KO vs WT*; two-factor ANOVA followed by multiple comparisons). As previously reported (Chubykin et al., 2007), this amplitude effect was specific to the NL2 deletion since the NL1 deletion had no detectable affect. The unitary connection frequency was unaltered for all genotypes (χ2 test) (Fig. 1C), and while this measurement is neither a direct nor a precise measure of synapse number, it is consistent with unaltered total synapse number (see Discussion, Mechanisms for decreased unitary IPSCs in the NL2 KO mice). Both the NL1 and the NL2 deletion (but not the double KO) affected short-term plasticity by making synapses slightly more depressing, a phenomenon often associated with increases in release probability (Fig. 1D,E). Such a change cannot explain the decrease in unitary IPSC amplitude in the NL2 KO mice, since an increase in release probability would be expected to increase the unitary IPSC size. The change in short-term plasticity by the NL1 deletion also suggests that NL1 may also play a subtle role in regulating inhibitory synaptic function.
NL2 KO decreases unitary IPSC amplitude by lowering the transmission efficacy at individual synapses
We next measured action-potential-independent synaptic events, or miniature IPSCs (mIPSCs) (Fig. 2A), in excitatory layer 4 neurons from WT and NL2 KO mice. While the NL2 KO had no effect on the mIPSC frequency, the NL2 KO decreased the mIPSC amplitude by 25% (Fig. 2B; also see supplemental Fig. 2, available at www.jneurosci.org as supplemental material, for cumulative distributions). The decrease in mIPSC amplitude indicates a decrease in either quantal amplitude, i.e., the size of a response, or else the transmission efficacy, at individual synaptic release sites. Most of the mIPSCs probably originate from proximally located synapses (Soltesz et al., 1995), which in turn mostly originate from FS inhibitory neurons (Somogyi et al., 1998; Di Cristo et al., 2004). Therefore, the decrease in mIPSC amplitude could account for the decrease in unitary IPSC amplitude originating from FS neurons, but nevertheless, this assertion is limited by the fact that a significant portion of mIPSCs likely originate from inhibitory neuron subtypes other than FS interneurons.
Figure 2.

Spontaneous miniature IPSC (mIPSC) amplitudes are decreased in NL2 KO mice. A, Example of mIPSCs recorded in TTX (1 μm) from WT and KO excitatory neurons (Excit) in layer 4. The events are large and opposite in polarity compared with the IPSCs in Figure 1 because the pipette solution contained 148 mm Cl−. B, Average mEPSC frequency (left) and amplitude (right). All data shown are means ± SEMs (***p < 0.001 compared with WT by Student's t test). +/+ and −/− indicate that both NL2 alleles are WT and KO, respectively. For all bimodal NL2 comparisons like that shown here, NL1 is completely WT.
To independently measure the quantal size of inhibitory transmission from FS neurons onto layer 4 excitatory neurons, we substituted Sr2+ for Ca2+ during the recording, which caused a delay in neurotransmitter release and produced measurable, single quantal events in the release process. Isolated and delayed quantal events were observed immediately after the offset of a train of action potentials evoked in the presynaptic FS neuron, which enabled us to measure the quantal amplitude of IPSCs originating from individual FS neurons (Fig. 3A). Importantly, only connections with strong unitary IPSCs (>15 pA average amplitude measured in 2 mm Ca2+ before switching to Sr2+) were used since Sr2+-evoked events were significantly contaminated by spontaneously occurring IPSCs at weaker connections (see Materials and Methods) (Fig. 3A3). Puzzlingly, we found that the quantal amplitude measured as Sr2+-evoked events was unchanged in the NL2 KO mice (Fig. 3B) (20.1 ± 1.6 vs 20.2 ± 1.4, n = 18, 20).
The results with Sr2+-evoked mIPSCs are inconsistent with our conclusion of decreased quantal amplitude based on mIPSCs, but the limitation of the measurements of Sr2+-evoked mIPSCs to “strong” unitary connections may have introduced a bias that distorts the results. In support of this, we did not observe the change in average unitary IPSC amplitude (p = 0.27) (Fig. 3C shows the strong overlap in distribution) like we did in our initial experiments (Fig. 1A). In summary, the limitation to “stronger” connections may have made it less likely to observe changes in the NL2KO mice [Note the importance of weaker connections by the steeper slope in the <10 pA region of the cumulative distribution (see Fig. 5E)].
Thus, to further test the hypothesis that decreased quantal amplitude at synapses originating from FS inhibitory neurons mediates the decrease in IPSC amplitude in NL2 KO mice, we used yet another approach. We measured the quantal amplitude under low release probability conditions (external [Ca2+] reduced to 0.1 mm) (Fig. 4) (Fatt and Katz, 1952; Gil et al., 1999; Kraushaar and Jonas, 2000). Using this technique, we were able to measure the “putative” quantal amplitude at unitary connections with an average unitary amplitude as low as 2 pA (see Materials and Methods). We elicited trains of APs in the presynaptic FS neuron, and varied the number and frequency of the APs until evoked IPSCs (successes) occurred at a rate of <20% (Fig. 4B,C) (see Materials and Methods). Under these low release conditions, it is likely that successes were mainly mediated by single release sites and were therefore “putative” quantal events (Fatt and Katz, 1952; Gil et al., 1999; Kraushaar and Jonas, 2000). Quantal amplitude was derived by averaging the successes (Fig. 4D). Quantal amplitude was decreased by 28% in the NL2 KO mice (Fig. 4E) (23.3 ± 1.9 vs 16.9 ± 1.2 pA, p < 0.007). Note that, unlike the Sr2+ experiments, the mean IPSC amplitude is decreased in the NL2 KO mice and cumulative distributions are well separated (Fig. 4F,G). Therefore, by adding the population of weaker unitary IPSC connections, we were able to discern a decrease in both unitary and quantal amplitude. This result is consistent with the change observed with mIPSCs (Fig. 2) (also note that different pipette solutions and event criteria were used in Figs. 2–4 and therefore that absolute quantal amplitudes differ). These results show that the decreased efficacy at individual synapses plays a prominent role in the decreased inhibition provided by FS neurons in the NL2 KO mice.
The decreased unitary IPSC amplitude is also mediated by a decrease in quantal content
In all layer 4 experiments performed with 50 mm Cl− pipette solution (including the Sr2+ and low external [Ca2+] experiments), a similar 51% reduction in unitary IPSC amplitude was observed (compare Figs. 5B, 1B). Again, no change in connection frequency was detected (χ2 test) (Fig. 5C). We observed no effect based on NL2 gene copy number or sex (Fig. 5B; also see supplemental Fig. 3, available at www.jneurosci.org as supplemental material).
The larger decrease in IPSC amplitude (∼51% in Figs. 1, 5) than in quantal amplitude (25 and 28% for mIPSC and low-Ca2+ experiments, respectively) suggests that the latter cannot completely account for by the former. In classical modeling of synaptic transmission, the amplitude of a unitary response is dependent on two factors: quantal amplitude (q) and quantal content (m) (unitary amplitude = m · q) (Johnston and Wu, 1995) (also see Discussion). m refers to the number of transmitter quanta released, and changes in quantal content can be measured by comparing the CV of a response, where quantal content is inversely proportional to CV (Faber and Korn, 1991). Therefore, we examined the possibility that a decrease in quantal content contributes to the decrease in unitary IPSC amplitude found in the NL2 KO mice. If this were the case, the CV should be increased in the NL2 KO mice. Indeed, this was true (Fig. 5D) (0.60 ± 0.03 vs 0.71 ± 0.05 pA, p < 0.05). Consistent with this finding, when we estimated the quantal content for each connection by dividing the unitary IPSC amplitude (excluding failures) by the quantal amplitude (obtained in Sr2+ and low-Ca2+ experiments), we observed a trend toward decreased quantal content in the NL2 KO mice (p = 0.066) (supplemental Fig. 4, available at www.jneurosci.org as supplemental material).
A decrease in quantal content could be mediated either by a decrease in the total number of potential release sites or a decrease in release probability. To test the latter as a possibility, we observed that short-term depression was enhanced in NL2 KO mice (STP index: 0.82 ± 0.05 vs 0.68 ± 0.04 pA, p < 0.03), just as we showed in Figure 1. An increase in short-term depression usually suggests an increase in release probability, which, in turn, eliminates a role for release probability in the quantal content decrease observed in the NL2 KO mice. On the other hand, studies indicate that the short-term plasticity at inhibitory synapses mediated by FS neurons is independent of release probability for short trains of action potentials, but is dependent on release probability for longer trains (Kraushaar and Jonas, 2000; Luthi et al., 2001). Therefore, we measured short-term plasticity during long stimulus trains (100 and 500 pulses, 20 Hz). However, short-term plasticity was still not detectably altered (supplemental Fig. 5, available at www.jneurosci.org as supplemental material). Therefore, these data suggest that the unitary IPSC decrease and the CV increase in the NL2 KO mice are not due to a decrease in release probability and may involve an increase in total number of potential release sties (but see Discussion, Mechanisms for decreased unitary IPSCs in the NL2 KO mice).
The NL2 KO uniformly scales down the unitary IPSC amplitude distribution
Next, we determined the distribution of unitary IPSC amplitudes in NL2[+/+,+/−] (which include both wild-type and heterozygous NL2 KO mice) and NL2 KO mice. We plotted cumulative histograms of IPSCs for both NL2[+/+,+/−] and NL2 KO data (Fig. 5E). The distributions were different (p < 0.002, K-S test), and a higher proportion of weaker connections existed in the KO.
Casual inspection of the plots suggest that the NL2 KO caused a multiplicative decrease of the NL2[+/+,+/−] distribution. To visualize this, we uniformly scaled the NL2[+/+,+/−] distribution down to 52% (a 48% decrease), a value producing the least error sum of squares (Fig. 5F). This scaling accurately predicts the NL2 KO distribution by accounting for 99.3% of the variance in the NL2 KO distribution (100 · [1 − (Mean Square Error [KO,Scaled])/VarianceKO]), and no statistically significant difference exists between the scaled and the NL2 KO distributions (K-S test). This close match after scaling is possible only because the basic distribution shapes for WT and KO are the same. Therefore, the decrease in unitary IPSC amplitude in the NL2 KO mouse represents a multiplicative decrease without a change in frequency distribution shape.
The changes in the quantal amplitude and the CV in NL2 KO mice are predicted by the WT distribution of these properties
In scatterplots, it was apparent that the quantal amplitude and the CV were dependent upon the unitary IPSC amplitude (Fig. 6A,E). We found that with an increasing unitary IPSC amplitude, the quantal amplitude increased and the CV decreased in both NL2[+/+,+/−] and NL2 KO mice (Fig. 6B,F) (two-factor ANOVA, unitary amplitude groupings, p < 0.0001 for both quantal amplitude and CV). Moreover, there was no detectable change in these relationships in the NL2 KO mice (Fig. 6B,F) (two-factor ANOVA, genotype), which probably explains why we were unable to discern a difference in quantal amplitude in the Sr2+ experiments, since they were performed within a restricted range of IPSC amplitudes (Fig. 3).
Based on these observations, we should be able to predict the change in quantal amplitude and CV in the NL2 KO mice by using only the NL2[+/+,+/−] unitary amplitude frequency distribution (Fig. 6C,G). To test this hypothesis, we first plotted frequency histograms of the IPSC amplitudes for the quantal amplitude and CV experimental data (Fig. 6C,G). As in Figure 5E, the NL2[+/+,+/−] and NL2 KO distributions were different (p < 0.01 for Fig. 6C,G; K-S test). Next, we performed a 52% scaling of the NL2[+/+,+/−] unitary IPSC amplitude distribution (Fig. 6C,G, in gray; points scaled <2 pA were removed, which corresponded to the criterion for a detectable connection). Just as in Figure 5F, these scaled distributions were not statistically different from the NL2 KO mice distribution (K-S test). We then multiplied corresponding points in graphs (Fig. 6B,C for quantal amplitude; Fig. 6F,G for CV) to obtain the average value (Fig. 6D,H). The average quantal amplitude and CV for the NL2[+/+,+/−] and NL2 KO mice calculated in this manner were, as expected, almost identical to the exact averages (<2% error, and within the 95% confidence intervals of the exact averages which ranged ±11–15%; based on data in Figs. 4E, 5D). Finally, we obtained a prediction of the average quantal amplitude and CV in the NL2 KO mice by multiplying the NL2[+/+,+/−] distribution of these parameters (Fig. 6B,F, respectively) by the “NL2[+/+,+/−], 52% scaled” unitary amplitude distribution (Fig. 6C,G, respectively). This prediction, using no NL2 KO mouse data, very well approximated the NL2 KO values (<3% error) (Fig. 6D,H) (within the 95% confidence intervals of the NL2 KO data: ±15 and ±13% for quantal amplitude and CV, respectively). The actual IPSC amplitude decrease in the low-Ca2+ quantal amplitude experiments was 38% (Fig. 4F). Even when the NL2[+/+,+/−] distribution is scaled by this value, the predicted quantal amplitude for NL2 KO mice is still fairly accurate (17.8 pA, 5% error and within the NL2 KO 95% confidence interval of ±15%).
In summary, the changes in quantal amplitude and the CV in NL2 KO mice can be accurately predicted by simply scaling down the NL2[+/+,+/−] unitary IPSC distribution.
No changes in IPSC kinetics in NL2 KO mice
We observed no changes in IPSC or IPSP response kinetics in NL2 KO mice (Fig. 7). In addition to parameters illustrated in Figure 6, we observed no change in the exponential time constant of the decay or the latency of IPSCs in the NL2 KO mice (decay time constant: 8.9 ± 0.3 vs 8.6 ± 0.3 ms; latency: 0.98 ± 0.03 vs 0.94 ± 0.03 ms; n = 23, 30). These data suggest that no change occurred in the combined process of transmitter release and postsynaptic receptor activation. Because PSP kinetics are also shaped by the membrane properties of the postsynaptic neuron, the lack of a change in IPSP kinetics indicated that the membrane properties of layer 4 excitatory neurons were not significantly altered. Finally, the lack of change in IPSC kinetics suggests that the ratio of synchronous to asynchronous release from presynaptic terminals was not significantly altered.
One possibility for decreases in both unitary IPSCs and quantal amplitude in the NL2 KO mice is that synaptic release sites were located more distally in the dendrites. It is known that due to electrotonic attenuation, PSCs and PSPs mediated by more distally located synapses have a smaller amplitude when measured at the soma (this is also true for PSCs because of voltage escape in the dendrites; Johnston and Wu, 1995; Häusser and Roth, 1997; Yeckel et al., 1999; Walker et al., 2002; Williams and Mitchell, 2008). But if this was true for our data, we should also see a deceleration in both IPSC and IPSP rise times (and perhaps durations), since more distally located synapses not only are smaller in amplitude when measured at the soma but also display longer duration kinetics (again, due to electrotonic and voltage escape reasons) (Johnston and Wu, 1995; Häusser and Roth, 1997; Yeckel et al., 1999; Walker et al., 2002; Williams and Mitchell, 2008). The fact that we saw no changes in IPSC or IPSP kinetics (IPSC rise time: 0.63 ± 0.02 vs 0.69 ± 0.06; IPSC duration: 8.1 ± 0.2 vs 7.8 ± 0.2; IPSP rise time: 4.5 ± 0.2 vs 4. 9 ± 0.2) (Fig. 7C,D,E) suggests that no such systematic location shift occurred.
Density of parvalbumin-positive synaptic boutons originating from FS neurons is unchanged in NL2 KO mice
The increased CV of unitary IPSCs measured in the NL2 KO mice may be due to a decrease in the total number of release sites. The lack of change in unitary connection frequency suggests this may not be the case, but this observation is not a reliable indicator for total release site number. To test for a change in release site number, we counted presynaptic boutons originating from FS neurons in layer 4 barrels. We used sections from mice that expressed GFP in parvalbumin-positive neurons, the commonly accepted biochemical marker for FS neurons (Cauli et al., 1997; Reyes et al., 1998; Gibson et al., 1999), and that additionally were WT or KO for the NL2 gene. The parvalbumin-GFP mice have been used previously to reliably count presynaptic terminals originating from parvalbumin-positive neurons due to strong GFP expression in the terminals (Chattopadhyaya et al., 2004). The use of these mice is further justified by the fact that unitary IPSCs originating from the GFP-positive neurons display a similar decrease with NL2 KO as described above (see the next section and Fig. 9B).
We subjected cortical sections to double immunostaining for the inhibitory presynaptic marker VGAT and for GFP (Fig. 8A), and counted puncta that colocalized both proteins (Fig. 8B). We did not detect changes in VGAT- and in VGAT/GFP-colocalized punctum number in the NL2 KO mice (Fig. 8C,D), suggesting that the density of synapses formed by FS neurons is unchanged. These data are consistent with a previous study indicating no alteration in synapse number in the NL1-2-3 triple KO (Varoqueaux et al., 2006). No change in GFP-positive cell number was detected in layers 2–5 (52.2 ± 7.2 vs 59.6 ± 3.7 cells/mm2, n = 11, 8). Therefore, the mechanism underlying the increased CV remains unclear (see Discussion).
Figure 8.

Density of parvalbumin-positive presynaptic terminals in NL2 KO mice. A, Superimposed images of GFP (green) and VGAT (red) staining in brain sections obtained from mice that expressed GFP in neocortical parvalbumin-positive neurons. Images were obtained from layer 4 of somatosensory cortex and are bandpass filtered. See Materials and Methods for kernel filter. See supplemental Figure 7, available at www.jneurosci.org as supplemental material, for enlarged images, including raw images. B, Colocalization image of GFP and VGAT. Each channel was thresholded to produce binary images and a logical “AND” function was applied to produce the colocalization image (see Materials and Methods) (scale bar applies to all images in A and B). C, D, Quantification of VGAT-positive puncta (C) and colocalized puncta (VGAT and GFP, D). All data shown are means ± SEMs. n = 3 WT and 4 KO mice. Student's t test for statistical significance.
The NL2 KO also decreased IPSC amplitudes at unitary connections originating from layer 2/3 parvalbumin-positive FS neurons
Fast-spiking neurons exist in all layers of neocortex and the hippocampus. We next took an initial step toward determining whether the NL2 deletion decreases inhibitory synaptic transmission mediated by all FS neurons in neocortex. We measured unitary IPSCs originating from layer 2/3 parvalbumin-positive neurons, which are known to be the biochemical equivalent of FS neurons (i.e., these classifications apply to the same group of inhibitory neurons) (Cauli et al., 1997; Reyes et al., 1998; Gibson et al., 1999). We used the mouse line that selectively expresses GFP in parvalbumin-positive inhibitory neurons (see Materials and Methods) and performed simultaneous recordings of neighboring layer 2/3 GFP-positive and pyramidal neurons. As with layer 4 FS neurons, IPSC amplitude was decreased with NL2 deletion (by 42%) (Fig. 9A,B), while the connection frequency was not detectably altered (χ2 test) (Fig. 9C). No changes in short-term plasticity (Fig. 9D,E), IPSC rise time (1.1 ± 0.05 vs 1.2 ± 0.08 ms, n = 19, 8), or IPSC duration at half-height (13.4 ± 0.65 vs 12.9 ± 0.9 ms) were observed. Thus, the NL2 deletion may universally impair synaptic inhibition mediated by FS neurons (and equivalently, parvalbumin-positive neurons) in the neocortex.
No decrease in IPSC amplitude in unitary connections originating from layer 2/3 somatostatin-positive neurons
We next determined whether the NL2 KO decreases synaptic transmission in all inhibitory synapses, independent of the subtype of inhibitory neuron involved. We prepared slices from NL2-expressing and NL2 KO mice that selectively express GFP in another inhibitory neuron subtype—the somatostatin-positive inhibitory neuron (see Materials and Methods)—and recorded from neighboring GFP-positive inhibitory interneurons and pyramidal excitatory neurons in layer 2/3 of somatosensory cortex (Fig. 10A). In contrast to IPSCs mediated by unitary connections originating from FS neurons, the NL2 KO did not decrease IPSC amplitudes evoked from somatostatin-positive neurons; in fact, a statistical trend for an increase was apparent (p = 0.08) (Fig. 10B). No connection frequency change was detected (χ2 test) (Fig. 10C). Short-term depression increased in both DKO and NL2 KO mice, indicating that the presynaptic release probability may have increased with NL2 deletion (Fig. 10D,E). As with FS cells, no changes in rise time (2.3 ± 0.2, 2.2 ± 0.1, 2.5 ± 0.2, 2.0 ± 0.1 ms; n = 18, 16, 18, 11) or duration at half-height (14.3 ± 0.8, 14.8 ± 0.5, 14.9 ± 0.5, 13.8 ± 0.8 ms) were observed. NL1 played no discernable role at this synaptic connection (Fig. 10B–E).
NL deletion affects EPSCs targeting fast-spiking inhibitory neurons
NL1 and NL2 are hypothesized to function specifically at excitatory and inhibitory synapses, respectively (Song et al., 1999; Graf et al., 2004). While this specificity applies to synapses targeting excitatory neurons, no attempt has been made to examine specificity in inhibitory neurons (Varoqueaux et al., 2004; Chubykin et al., 2007). During recordings examining IPSCs, we also measured the reciprocal EPSCs (Fig. 11A,B). Effects of the NL deletions were detected only in FS neurons, in which the average EPSC amplitude was larger with the NL2 deletion compared with WT* neurons (Fig. 11C) (Fishers PLSD, p < 0.03). No changes in connection frequency (parvalbumin: 35/48, 22/28, 21/29, 17/22; somatostatin: 28/50, 31/42, 21/32, 16/23: WT*, NL1 KO, NL2 KO, DKO, respectively) or short-term plasticity (Fig. 11E,F) were detected with any genotypic manipulation.
Excitatory responses onto FS neurons had slightly faster kinetics in NL2 KO mice than in WT* mice. While no change in rise time was observed, there was 10% decrease in the duration at half-height with the NL2 deletion (3.6.2 ± 0.8, 3.2 ± 0.1, 3.4 ± 0.3, 2.7 ± 0.2 ms; p < 0.04, two-way ANOVA; n = 19, 13, 17, 7). No changes in rise time or duration were observed for EPSCs targeting somatostatin-positive neurons.
Little change in membrane properties
Although deletion of NLs does not alter the overall cytoarchitecture of the mouse brain (Varoqueaux et al., 2006), it is possible that the synaptic alterations we observed are secondary to alterations in electrophysiological membrane properties. Therefore, we examined the effects of the NL1 KO and NL2 KO on two standard membrane properties, namely, input resistance and resting potential, in layer 4 and layer 2/3 cells (supplemental Fig. 8, available at www.jneurosci.org as supplemental material). Intrinsic membrane properties changed little, except for a ∼15% increase in the input resistance of layer 4 FS cells in the DKO mice. A slight depolarization was observed in the layer 2/3 excitatory neurons of NL1 KO mice. We additionally examined the membrane capacitance in a subset of layer 4 excitatory neurons in WT* and NL2 KO animals and found no difference (11 ± 0.4 vs 11.3 ± 0.4 pF, n = 30, 37). Since membrane capacitance is proportional to cell size, these data suggest that our in-depth examination of the inhibition mediated by layer 4 FS cells in the NL2 KO mice is likely not confounded by changes in postsynaptic cell size. In summary, the alterations induced by NL deletion are highly synapse specific and are not likely the result of an indirect effect through alterations in electrophysiological membrane properties.
Discussion
We used NL1 and NL2 KO mice to examine the role of NLs at unitary (cell-to-cell) connections between neocortical neurons of known subtype. Consistent with previous studies, our data strongly implicate NL2 in the regulation of inhibitory synaptic function (Graf et al., 2004; Varoqueaux et al., 2004; Chubykin et al., 2007). Upon deletion of NL2, the IPSC amplitude was uniformly scaled down (40–50%) at unitary connections originating from FS neurons. This scaling was mediated by a decrease in quantal amplitude and quantal content. No decrease was observed for unitary IPSCs originating from somatostatin-positive neurons, suggesting a role for NL2 that is dependent on the inhibitory neuron subtype (summarized in Fig. 12). In contrast, the NL1 deletion had little effect on synaptic function of inhibitory synapses originating from both inhibitory subtypes (except for a change in short-term plasticity at layer 4 FS synapses).
Figure 12.

Summary of inhibitory circuitry with NL2 deletion. Connectivity (%) and amplitude (pA) are listed for each connection studied. We consider parvalbumin-positive and FS cells as one type (P/FS). Excitatory (Ex) and somatostatin-positive (Som) cells are also shown. For P/FS connections, connectivity is a combined tally of data in Figures 1, 5, and 9. The amplitude was taken from layer 4 FS data recorded with low-Cl− internal solution. No alterations were observed with NL1 deletion. Asterisks and underlining indicate statistical difference from WT.
Mechanisms for decreased unitary IPSCs in the NL2 KO mice
The strength of a unitary inhibitory connection can be described as a function of the total number of release sites (n), the response amplitude (q), and the release probability (pr) at each site as follows: Response strength = n · q · pr (Johnston and Wu, 1995). We consider q to be a measure of a synaptic response evoked by the release of a single neurotransmitter vesicle. Our measurements of quantal amplitude with mIPSCs (Fig. 2) and in low-Ca2+ experiments (Fig. 4) are measurements of q and hence suggest that the single release synaptic response size is decreased in NL2 KO mice. A change in q is most commonly attributed to a change in postsynaptic receptor function (Luhmann and Prince, 1991; Lissin et al., 1998; Malenka and Nicoll, 1999; Murthy et al., 2001; Kilman et al., 2002).
Because the decrease in quantal amplitude was 28%, while the decrease in unitary IPSC amplitude was ∼50%, this aspect of synaptic function probably does not fully account for the connection strength decrease in the NL2 KO mice. We provide evidence that the remaining difference may be accounted for by a decrease in quantal content (m = n · pr), which is the average number of quanta released by an action potential. We infer this change from the observed increase in the CV of unitary IPSCs originating from FS neurons (Fig. 5D), since an increase in the CV is thought to be linked to a decrease in quantal content (Faber and Korn, 1991; Johnston and Wu, 1995; Hefft et al., 2002).
Based on its definition, the quantal content can be lowered by a decrease in either n, pr, or both. Our measurements of short-term plasticity suggest that pr in the NL2 KO mice may be increased (short trains in layer 4) (Fig. 1E) or unchanged [long trains in layer 4 (supplemental Fig. 5, available at www.jneurosci.org as supplemental material) and short trains in layer 2/3 (Fig. 9E)] and therefore cannot account for the quantal content decrease. On the other hand, the relationship between pr and short-term plasticity is not always clear and is dependent on other factors (Geppert et al., 1997; von Gersdorff et al., 1997; Blatow et al., 2003; Xu and Wu, 2005; Schlüter et al., 2006).
The lack of a decrease in short-term plasticity nevertheless appears to suggest that n is decreased in the NL2 KO mice, but 3 of our findings argue against a decreased n. Specifically, we observed no decrease in any of the following: (1) the connection frequency of unitary connections originating from FS neurons (Figs. 1C, 5C, 9C), (2) mIPSC frequency (Fig. 2), and (3) punctum number for both a GABAA and parvalbumin presynaptic marker (Fig. 8). If n were indeed decreased in the NL2 KO mice, what can account for the lack of change in the three measurements just stated? First, NL2 may not affect the frequency of unitary IPSC connections but may regulate the number of synapses mediating a unitary connection only after that connection is established. Second, mIPSC frequency may not be a reliable assay for synapse number involved in evoked transmission (Reim et al., 2001; Calakos et al., 2004), and in the particular case here, mIPSCs are contaminated by inhibitory events originating from non-FS synapses. Third, the punctum counts may not be sensitive enough to detect the differences measured physiologically nor be an accurate marker for functional release sites with postsynaptic targets. In summary, the relative contributions of n and pr in the quantal content decrease is unresolved.
The NL2 deletion uniformly scales down unitary inhibitory connections
For WT mice (specifically, NL2[+/+,+/−]), we have quantified the following relationship: with increasing unitary IPSC amplitude, the quantal size increases and the CV decreases. This relationship was unchanged in the NL2 KO mice (Fig. 6).
Based on these unaltered relationships and the lack of change in IPSC kinetics (Fig. 7), it appears that synapses in the NL2 KO mice are fairly normal except for two aspects: (1) a slight change in the short-term plasticity as measured by short stimulus trains, and (2) the scaling down by ∼50% the wild-type connection amplitude while preserving the shape of the amplitude distribution (Fig. 5F). Because the relationships stated above are unaltered in the NL2 KO mice, the change in the quantal amplitude and the CV in NL2 KO mice can be precisely predicted by the 52% scaling of the NL2[+/+,+/−] distribution of the unitary IPSC amplitude (<3% error) (Fig. 6). Interestingly, the unitary (cell-to-cell) connection frequency of FS neurons is normal. Therefore, while NL2 does not appear necessary for establishing the normal number of unitary connections originating from neighboring FS neurons, it appears to be needed to scale up the unitary connections at the developmental stage studied here. We speculate that the scaling up would include an increase in both quantal size and quantal content.
Differential role of NL2 at different inhibitory synapse subtypes
Arguably the most important result of our study is the observation that the effects of the NL2 deletion on unitary IPSC amplitude were differential between inhibitory neuronal subtypes. The amplitude of IPSCs originating from FS and parvalbumin-positive neurons (which are thought to be identical) was decreased ∼2-fold in the NL2 KO mice (Figs. 1B, 5B, 9B). Because the same reduction occurred for the output of FS neurons in two different neocortical layers (layer 4 and 2/3), NL2 may specifically regulate the output of neocortical FS neurons in general.
In contrast, no change in IPSC amplitude was observed at unitary inhibitory connections originating from somatostatin-positive neurons (Fig. 10B). Therefore, NL2 may act to promote inhibitory inputs from FS neurons, but play a much diminished role for input from somatostatin-positive inhibitory neurons. Short-term plasticity, on the other hand, may be similarly regulated by NL2 at synapses originating from both layer 4 FS neurons and somatostatin-positive neurons, since both of these synapses were more depressing in the NL2 KO mice (Figs. 1E, 10E).
The different effects of the NL2 deletion on unitary connections originating from FS and somatostatin-positive inhibitory neurons may occur for two possible reasons. First, NL2 may have a differential functional role at these two synapse subtypes, perhaps due to differential expression of NL2 and/or neurexin splice variants (Boucard et al., 2005; Chih et al., 2006). Second, NL2 may function at only one of the inhibitory synapse types, and changes at the other synapse type may originate from indirect effects of the NL2 deletion. While NL2 has been shown to be localized to inhibitory synapses, no data exist about its localization with respect to inhibitory synapse subtype.
Specificity of NL1 and NL2 for synapse types
The NL1 deletion had little effect at inhibitory synapses originating from both subtypes, the exception being an alteration in short-term plasticity at connections originating from layer 4 FS neurons (Fig. 1E). It has been shown previously that NL1 deletion has no effect on the amplitude of unitary IPSCs mediated by FS cells (Chubykin et al., 2007), and here, we extend this principle to IPSCs mediated by somatostatin-positive neurons.
On the other hand, the hypothesis that NL1 is selective for excitatory synapses may have to be modified. At excitatory synapses targeting the inhibitory neurons examined here, NL1 had no detectable effects while NL2 deletion caused an increase in unitary EPSC amplitude onto FS neurons (Fig. 11C). This finding may either indicate that NL2 plays a role at both inhibitory and excitatory synapses (Chih et al., 2005; Chih et al., 2006) or reflect a compensatory upregulation of excitatory inputs onto FS neurons induced by the decrease of their outputs.
Changes are predominantly synapse specific in NL1 and NL2 KO mice
It is possible that our observed changes are due to second-order, indirect effects. But the decrease in FS-mediated inhibition is consistent with both the localization of NL2 at inhibitory synapses and the ability of NL2 to promote greater inhibition in a subset of transfected neurons in culture (Chubykin et al., 2007). Interestingly, we did not observe membrane alterations in any of the cell types in the NL2 KO (supplemental Fig. 8, available at www.jneurosci.org as supplemental material). Therefore, the synaptic effects that we observe are highly specific and not part of a large repertoire of general changes.
NL2 and scaling during development
We examined synaptic function and activity at a developmental stage at which synapses are still undergoing proliferation, and circuits are being refined. Activity, driven partially through sensory inputs, plays an important role in this process, and activity also regulates the strength of inhibitory connections in neocortex (Welker et al., 1989; Rutherford et al., 1997; Chattopadhyaya et al., 2004; Maffei et al., 2004; Bartley et al., 2008). In these prior studies, activity has been demonstrated to increase inhibition through increased quantal amplitude and synapse number (Kilman et al., 2002; but see Maffei et al., 2006). We speculate that NL2 may play a role in this process by scaling up unitary connections in response to activity. This would be consistent with evidence indicating an activity-dependent function for NL1 and NL2 after overexpression (Chubykin et al., 2007). Interestingly, chronic elimination of activity has a similar effect on unitary IPSC amplitude as described for the NL2 KO mice in this study—a decrease in inhibitory input provided by FS neurons and no effect on inhibitory input originating from somatostatin-positive neurons (Bartley et al., 2008).
Footnotes
This research was supported by grants from the National Institutes of Health (HD056370 to J.R.G.; NS045711 and HD052731 to K.M.H.; R37 MH52804-08 to T.C.S.), the Simons Foundation (to T.C.S.), and Autism Speaks (to K.M.H.). We thank Kris Loerwald for assistance in genotyping and immunocytochemistry.
References
- Agmon A, Connors BW. Thalamocortical responses of mouse somatosensory (barrel) cortex in vitro. Neuroscience. 1991;41:365–379. doi: 10.1016/0306-4522(91)90333-j. [DOI] [PubMed] [Google Scholar]
- Bartley AF, Huang ZJ, Huber KM, Gibson JR. Differential activity-dependent, homeostatic plasticity of two neocortical inhibitory circuits. J Neurophysiol. 2008;100:1983–1994. doi: 10.1152/jn.90635.2008. [DOI] [PMC free article] [PubMed] [Google Scholar]
- Beierlein M, Gibson JR, Connors BW. Two dynamically distinct inhibitory networks in layer 4 of the neocortex. J Neurophysiol. 2003;90:2987–3000. doi: 10.1152/jn.00283.2003. [DOI] [PubMed] [Google Scholar]
- Blatow M, Caputi A, Burnashev N, Monyer H, Rozov A. Ca2+ buffer saturation underlies paired pulse facilitation in calbindin-D28k-containing terminals. Neuron. 2003;38:79–88. doi: 10.1016/s0896-6273(03)00196-x. [DOI] [PubMed] [Google Scholar]
- Bolliger MF, Pei J, Maxeiner S, Boucard AA, Grishin NV, Sudhof TC. Unusually rapid evolution of Neuroligin-4 in mice. Proc Natl Acad Sci U S A. 2008;105:6421–6426. doi: 10.1073/pnas.0801383105. [DOI] [PMC free article] [PubMed] [Google Scholar]
- Boucard AA, Chubykin AA, Comoletti D, Taylor P, Südhof TC. A splice code for trans-synaptic cell adhesion mediated by binding of neuroligin 1 to alpha- and beta-neurexins. Neuron. 2005;48:229–236. doi: 10.1016/j.neuron.2005.08.026. [DOI] [PubMed] [Google Scholar]
- Calakos N, Schoch S, Südhof TC, Malenka RC. Multiple roles for the active zone protein RIM1alpha in late stages of neurotransmitter release. Neuron. 2004;42:889–896. doi: 10.1016/j.neuron.2004.05.014. [DOI] [PubMed] [Google Scholar]
- Cauli B, Audinat E, Lambolez B, Angulo MC, Ropert N, Tsuzuki K, Hestrin S, Rossier J. Molecular and physiological diversity of cortical nonpyramidal cells. J Neurosci. 1997;17:3894–3906. doi: 10.1523/JNEUROSCI.17-10-03894.1997. [DOI] [PMC free article] [PubMed] [Google Scholar]
- Chattopadhyaya B, Di Cristo G, Higashiyama H, Knott GW, Kuhlman SJ, Welker E, Huang ZJ. Experience and activity-dependent maturation of perisomatic GABAergic innervation in primary visual cortex during a postnatal critical period. J Neurosci. 2004;24:9598–9611. doi: 10.1523/JNEUROSCI.1851-04.2004. [DOI] [PMC free article] [PubMed] [Google Scholar]
- Chih B, Engelman H, Scheiffele P. Control of excitatory and inhibitory synapse formation by neuroligins. Science. 2005;307:1324–1328. doi: 10.1126/science.1107470. [DOI] [PubMed] [Google Scholar]
- Chih B, Gollan L, Scheiffele P. Alternative splicing controls selective trans-synaptic interactions of the neuroligin-neurexin complex. Neuron. 2006;51:171–178. doi: 10.1016/j.neuron.2006.06.005. [DOI] [PubMed] [Google Scholar]
- Chubykin AA, Liu X, Comoletti D, Tsigelny I, Taylor P, Sudhof TC. Dissection of synapse induction by neuroligins: effect of a neuroligin mutation associated with autism. J Biol Chem. 2005;280:22365–22374. doi: 10.1074/jbc.M410723200. [DOI] [PubMed] [Google Scholar]
- Chubykin AA, Atasoy D, Etherton MR, Brose N, Kavalali ET, Gibson JR, Südhof TC. Activity-dependent validation of excitatory versus inhibitory synapses by neuroligin-1 versus neuroligin-2. Neuron. 2007;54:919–931. doi: 10.1016/j.neuron.2007.05.029. [DOI] [PMC free article] [PubMed] [Google Scholar]
- Connors BW, Gutnick MJ. Intrinsic firing patterns of diverse neocortical neurons. Trends Neurosci. 1990;13:99–104. doi: 10.1016/0166-2236(90)90185-d. [DOI] [PubMed] [Google Scholar]
- Dean C, Scholl FG, Choih J, DeMaria S, Berger J, Isacoff E, Scheiffele P. Neurexin mediates the assembly of presynaptic terminals. Nat Neurosci. 2003;6:708–716. doi: 10.1038/nn1074. [DOI] [PMC free article] [PubMed] [Google Scholar]
- Di Cristo G, Wu C, Chattopadhyaya B, Ango F, Knott G, Welker E, Svoboda K, Huang ZJ. Subcellular domain-restricted GABAergic innervation in primary visual cortex in the absence of sensory and thalamic inputs. Nat Neurosci. 2004;7:1184–1186. doi: 10.1038/nn1334. [DOI] [PubMed] [Google Scholar]
- Faber DS, Korn H. Applicability of the coefficient of variation method for analyzing synaptic plasticity. Biophys J. 1991;60:1288–1294. doi: 10.1016/S0006-3495(91)82162-2. [DOI] [PMC free article] [PubMed] [Google Scholar]
- Fatt P, Katz B. Spontaneous subthreshold activity at motor nerve endings. J Physiol. 1952;117:109–128. [PMC free article] [PubMed] [Google Scholar]
- Freund TF, Buzsáki G. Interneurons of the hippocampus. Hippocampus. 1996;6:347–470. doi: 10.1002/(SICI)1098-1063(1996)6:4<347::AID-HIPO1>3.0.CO;2-I. [DOI] [PubMed] [Google Scholar]
- Galarreta M, Hestrin S. A network of fast-spiking cells in the neocortex connected by electrical synapses. Nature. 1999;402:72–75. doi: 10.1038/47029. [DOI] [PubMed] [Google Scholar]
- Geppert M, Goda Y, Stevens CF, Südhof TC. The small GTP-binding protein Rab3A regulates a late step in synaptic vesicle fusion. Nature. 1997;387:810–814. doi: 10.1038/42954. [DOI] [PubMed] [Google Scholar]
- Gibson JR, Beierlein M, Connors BW. Two networks of electrically coupled inhibitory neurons in neocortex. Nature. 1999;402:75–79. doi: 10.1038/47035. [DOI] [PubMed] [Google Scholar]
- Gibson JR, Bartley AF, Huber KM. Role for the subthreshold currents ILeak and IH in the homeostatic control of excitability in neocortical somatostatin-positive inhibitory neurons. J Neurophysiol. 2006;96:420–432. doi: 10.1152/jn.01203.2005. [DOI] [PubMed] [Google Scholar]
- Gil Z, Connors BW, Amitai Y. Efficacy of thalamocortical and intracortical synaptic connections: quanta, innervation, and reliability. Neuron. 1999;23:385–397. doi: 10.1016/s0896-6273(00)80788-6. [DOI] [PubMed] [Google Scholar]
- Goda Y, Davis GW. Mechanisms of synapse assembly and disassembly. Neuron. 2003;40:243–264. doi: 10.1016/s0896-6273(03)00608-1. [DOI] [PubMed] [Google Scholar]
- Gonchar Y, Burkhalter A. Three distinct families of GABAergic neurons in rat visual cortex. Cereb Cortex. 1997;7:347–358. doi: 10.1093/cercor/7.4.347. [DOI] [PubMed] [Google Scholar]
- Graf ER, Zhang X, Jin SX, Linhoff MW, Craig AM. Neurexins induce differentiation of GABA and glutamate postsynaptic specializations via neuroligins. Cell. 2004;119:1013–1026. doi: 10.1016/j.cell.2004.11.035. [DOI] [PMC free article] [PubMed] [Google Scholar]
- Häusser M, Roth A. Estimating the time course of the excitatory synaptic conductance in neocortical pyramidal cells using a novel voltage jump method. J Neurosci. 1997;17:7606–7625. doi: 10.1523/JNEUROSCI.17-20-07606.1997. [DOI] [PMC free article] [PubMed] [Google Scholar]
- Hefft S, Kraushaar U, Geiger JR, Jonas P. Presynaptic short-term depression is maintained during regulation of transmitter release at a GABAergic synapse in rat hippocampus. J Physiol. 2002;539:201–208. doi: 10.1113/jphysiol.2001.013455. [DOI] [PMC free article] [PubMed] [Google Scholar]
- Hussain NK, Sheng M. Neuroscience. Making synapses: a balancing act. Science. 2005;307:1207–1208. doi: 10.1126/science.1110011. [DOI] [PubMed] [Google Scholar]
- Ichtchenko K, Hata Y, Nguyen T, Ullrich B, Missler M, Moomaw C, Sudhof TC. Neuroligin 1: a splice site-specific ligand for beta-neurexins. Cell. 1995;81:435–443. doi: 10.1016/0092-8674(95)90396-8. [DOI] [PubMed] [Google Scholar]
- Ichtchenko K, Nguyen T, Südhof TC. Structures, alternative splicing, and neurexin binding of multiple neuroligins. J Biol Chem. 1996;271:2676–2682. doi: 10.1074/jbc.271.5.2676. [DOI] [PubMed] [Google Scholar]
- Jamain S, Quach H, Betancur C, Råstam M, Colineaux C, Gillberg IC, Soderstrom H, Giros B, Leboyer M, Gillberg C, Bourgeron T. Mutations of the X-linked genes encoding neuroligins NLGN3 and NLGN4 are associated with autism. Nat Genet. 2003;34:27–29. doi: 10.1038/ng1136. [DOI] [PMC free article] [PubMed] [Google Scholar]
- Johnston D, Wu S. Foundations of cellular neurophysiology. Cambridge, MA: MIT; 1995. [Google Scholar]
- Kilman V, van Rossum MC, Turrigiano GG. Activity deprivation reduces miniature IPSC amplitude by decreasing the number of postsynaptic GABAA receptors clustered at neocortical synapses. J Neurosci. 2002;22:1328–1337. doi: 10.1523/JNEUROSCI.22-04-01328.2002. [DOI] [PMC free article] [PubMed] [Google Scholar]
- Kraushaar U, Jonas P. Efficacy and stability of quantal GABA release at a hippocampal interneuron–principal neuron synapse. J Neurosci. 2000;20:5594–5607. doi: 10.1523/JNEUROSCI.20-15-05594.2000. [DOI] [PMC free article] [PubMed] [Google Scholar]
- Laumonnier F, Bonnet-Brilhault F, Gomot M, Blanc R, David A, Moizard MP, Raynaud M, Ronce N, Lemonnier E, Calvas P, Laudier B, Chelly J, Fryns JP, Ropers HH, Hamel BC, Andres C, Barthélémy C, Moraine C, Briault S. X-linked mental retardation and autism are associated with a mutation in the NLGN4 gene, a member of the neuroligin family. Am J Hum Genet. 2004;74:552–557. doi: 10.1086/382137. [DOI] [PMC free article] [PubMed] [Google Scholar]
- Levinson JN, El-Husseini A. New players tip the scales in the balance between excitatory and inhibitory synapses. Mol Pain. 2005;1:12. doi: 10.1186/1744-8069-1-12. [DOI] [PMC free article] [PubMed] [Google Scholar]
- Levinson JN, Chéry N, Huang K, Wong TP, Gerrow K, Kang R, Prange O, Wang YT, El-Husseini A. Neuroligins mediate excitatory and inhibitory synapse formation: involvement of PSD-95 and neurexin-1beta in neuroligin-induced synaptic specificity. J Biol Chem. 2005;280:17312–17319. doi: 10.1074/jbc.M413812200. [DOI] [PubMed] [Google Scholar]
- Lissin DV, Gomperts SN, Carroll RC, Christine CW, Kalman D, Kitamura M, Hardy S, Nicoll RA, Malenka RC, von Zastrow M. Activity differentially regulates the surface expression of synaptic AMPA and NMDA glutamate receptors. Proc Natl Acad Sci U S A. 1998;95:7097–7102. doi: 10.1073/pnas.95.12.7097. [DOI] [PMC free article] [PubMed] [Google Scholar]
- Luhmann HJ, Prince DA. Postnatal maturation of the GABAergic system in rat neocortex. J Neurophysiol. 1991;65:247–263. doi: 10.1152/jn.1991.65.2.247. [DOI] [PubMed] [Google Scholar]
- Luthi A, Di Paolo G, Cremona O, Daniell L, De Camilli P, McCormick DA. Synaptojanin 1 contributes to maintaining the stability of GABAergic transmission in primary cultures of cortical neurons. J Neurosci. 2001;21:9101–9111. doi: 10.1523/JNEUROSCI.21-23-09101.2001. [DOI] [PMC free article] [PubMed] [Google Scholar]
- Maffei A, Nelson SB, Turrigiano GG. Selective reconfiguration of layer 4 visual cortical circuitry by visual deprivation. Nat Neurosci. 2004;7:1353–1359. doi: 10.1038/nn1351. [DOI] [PubMed] [Google Scholar]
- Maffei A, Nataraj K, Nelson SB, Turrigiano GG. Potentiation of cortical inhibition by visual deprivation. Nature. 2006;443:81–84. doi: 10.1038/nature05079. [DOI] [PubMed] [Google Scholar]
- Malenka RC, Nicoll RA. Long-term potentiation—a decade of progress? Science. 1999;285:1870–1874. doi: 10.1126/science.285.5435.1870. [DOI] [PubMed] [Google Scholar]
- Missler M, Zhang W, Rohlmann A, Kattenstroth G, Hammer RE, Gottmann K, Südhof TC. Alpha-neurexins couple Ca2+ channels to synaptic vesicle exocytosis. Nature. 2003;423:939–948. doi: 10.1038/nature01755. [DOI] [PubMed] [Google Scholar]
- Murthy VN, Schikorski T, Stevens CF, Zhu Y. Inactivity produces increases in neurotransmitter release and synapse size. Neuron. 2001;32:673–682. doi: 10.1016/s0896-6273(01)00500-1. [DOI] [PubMed] [Google Scholar]
- Nam CI, Chen L. Postsynaptic assembly induced by neurexin-neuroligin interaction and neurotransmitter. Proc Natl Acad Sci U S A. 2005;102:6137–6142. doi: 10.1073/pnas.0502038102. [DOI] [PMC free article] [PubMed] [Google Scholar]
- Oliva AA, Jr, Jiang M, Lam T, Smith KL, Swann JW. Novel hippocampal interneuronal subtypes identified using transgenic mice that express green fluorescent protein in GABAergic interneurons. J Neurosci. 2000;20:3354–3368. doi: 10.1523/JNEUROSCI.20-09-03354.2000. [DOI] [PMC free article] [PubMed] [Google Scholar]
- Prange O, Wong TP, Gerrow K, Wang YT, El-Husseini A. A balance between excitatory and inhibitory synapses is controlled by PSD-95 and neuroligin. Proc Natl Acad Sci U S A. 2004;101:13915–13920. doi: 10.1073/pnas.0405939101. [DOI] [PMC free article] [PubMed] [Google Scholar]
- Reim K, Mansour M, Varoqueaux F, McMahon HT, Südhof TC, Brose N, Rosenmund C. Complexins regulate a late step in Ca2+-dependent neurotransmitter release. Cell. 2001;104:71–81. doi: 10.1016/s0092-8674(01)00192-1. [DOI] [PubMed] [Google Scholar]
- Reyes A, Lujan R, Rozov A, Burnashev N, Somogyi P, Sakmann B. Target-cell-specific facilitation and depression in neocortical circuits. Nat Neurosci. 1998;1:279–285. doi: 10.1038/1092. [DOI] [PubMed] [Google Scholar]
- Rutherford LC, DeWan A, Lauer HM, Turrigiano GG. Brain-derived neurotrophic factor mediates the activity-dependent regulation of inhibition in neocortical cultures. J Neurosci. 1997;17:4527–4535. doi: 10.1523/JNEUROSCI.17-12-04527.1997. [DOI] [PMC free article] [PubMed] [Google Scholar]
- Scheiffele P. Cell-cell signaling during synapse formation in the CNS. Annu Rev Neurosci. 2003;26:485–508. doi: 10.1146/annurev.neuro.26.043002.094940. [DOI] [PubMed] [Google Scholar]
- Scheiffele P, Fan J, Choih J, Fetter R, Serafini T. Neuroligin expressed in nonneuronal cells triggers presynaptic development in contacting axons. Cell. 2000;101:657–669. doi: 10.1016/s0092-8674(00)80877-6. [DOI] [PubMed] [Google Scholar]
- Schlüter OM, Basu J, Südhof TC, Rosenmund C. Rab3 superprimes synaptic vesicles for release: implications for short-term synaptic plasticity. J Neurosci. 2006;26:1239–1246. doi: 10.1523/JNEUROSCI.3553-05.2006. [DOI] [PMC free article] [PubMed] [Google Scholar]
- Soltesz I, Smetters DK, Mody I. Tonic inhibition originates from synapses close to the soma. Neuron. 1995;14:1273–1283. doi: 10.1016/0896-6273(95)90274-0. [DOI] [PubMed] [Google Scholar]
- Somogyi P, Tamás G, Lujan R, Buhl EH. Salient features of synaptic organisation in the cerebral cortex. Brain Res Brain Res Rev. 1998;26:113–135. doi: 10.1016/s0165-0173(97)00061-1. [DOI] [PubMed] [Google Scholar]
- Song JY, Ichtchenko K, Südhof TC, Brose N. Neuroligin 1 is a postsynaptic cell-adhesion molecule of excitatory synapses. Proc Natl Acad Sci U S A. 1999;96:1100–1105. doi: 10.1073/pnas.96.3.1100. [DOI] [PMC free article] [PubMed] [Google Scholar]
- Südhof TC. Neuroligins and neurexins link synaptic function to cognitive disease. Nature. 2008;455:903–911. doi: 10.1038/nature07456. [DOI] [PMC free article] [PubMed] [Google Scholar]
- Ushkaryov YA, Petrenko AG, Geppert M, Südhof TC. Neurexins: synaptic cell surface proteins related to the alpha-latrotoxin receptor and laminin. Science. 1992;257:50–56. doi: 10.1126/science.1621094. [DOI] [PubMed] [Google Scholar]
- Varoqueaux F, Jamain S, Brose N. Neuroligin 2 is exclusively localized to inhibitory synapses. Eur J Cell Biol. 2004;83:449–456. doi: 10.1078/0171-9335-00410. [DOI] [PubMed] [Google Scholar]
- Varoqueaux F, Aramuni G, Rawson RL, Mohrmann R, Missler M, Gottmann K, Zhang W, Südhof TC, Brose N. Neuroligins determine synapse maturation and function. Neuron. 2006;51:741–754. doi: 10.1016/j.neuron.2006.09.003. [DOI] [PubMed] [Google Scholar]
- von Gersdorff H, Schneggenburger R, Weis S, Neher E. Presynaptic depression at a calyx synapse: the small contribution of metabotropic glutamate receptors. J Neurosci. 1997;17:8137–8146. doi: 10.1523/JNEUROSCI.17-21-08137.1997. [DOI] [PMC free article] [PubMed] [Google Scholar]
- Walker HC, Lawrence JJ, McBain CJ. Activation of kinetically distinct synaptic conductances on inhibitory interneurons by electrotonically overlapping afferents. Neuron. 2002;35:161–171. doi: 10.1016/s0896-6273(02)00734-1. [DOI] [PubMed] [Google Scholar]
- Welker E, Soriano E, Van der Loos H. Plasticity in the barrel cortex of the adult mouse: effects of peripheral deprivation on GAD-immunoreactivity. Exp Brain Res. 1989;74:441–452. doi: 10.1007/BF00247346. [DOI] [PubMed] [Google Scholar]
- Williams SR, Mitchell SJ. Direct measurement of somatic voltage clamp errors in central neurons. Nat Neurosci. 2008;11:790–798. doi: 10.1038/nn.2137. [DOI] [PubMed] [Google Scholar]
- Xu J, Wu LG. The decrease in the presynaptic calcium current is a major cause of short-term depression at a calyx-type synapse. Neuron. 2005;46:633–645. doi: 10.1016/j.neuron.2005.03.024. [DOI] [PubMed] [Google Scholar]
- Yamagata M, Sanes JR, Weiner JA. Synaptic adhesion molecules. Curr Opin Cell Biol. 2003;15:621–632. doi: 10.1016/s0955-0674(03)00107-8. [DOI] [PubMed] [Google Scholar]
- Yan J, Oliveira G, Coutinho A, Yang C, Feng J, Katz C, Sram J, Bockholt A, Jones IR, Craddock N, Cook EH, Jr, Vicente A, Sommer SS. Analysis of the neuroligin 3 and 4 genes in autism and other neuropsychiatric patients. Mol Psychiatry. 2005;10:329–332. doi: 10.1038/sj.mp.4001629. [DOI] [PubMed] [Google Scholar]
- Yeckel MF, Kapur A, Johnston D. Multiple forms of LTP in hippocampal CA3 neurons use a common postsynaptic mechanism. Nat Neurosci. 1999;2:625–633. doi: 10.1038/10180. [DOI] [PMC free article] [PubMed] [Google Scholar]
- Zoghbi HY. Postnatal neurodevelopmental disorders: meeting at the synapse? Science. 2003;302:826–830. doi: 10.1126/science.1089071. [DOI] [PubMed] [Google Scholar]