

Abstract
Human plasmacytoid dendritic cells (PDC) are crucial for innate and adaptive immune responses against viral infections, mainly through production of type I interferons. Evidence is accumulating that PDC surface receptors play an important role in this process. To investigate the PDC phenotype in more detail, a chip-based expression analysis of surface receptors was combined with respective flow cytometry data obtained from fresh PDC, PDC exposed to interleukin-3 (IL-3) and/or herpes simplex virus type 1 (HSV-1). CD156b, CD229, CD305 and CD319 were newly identified on the surface of PDC, and CD180 was identified as a new intracellular antigen. After correction for multiple comparisons, a total of 33 receptors were found to be significantly regulated upon exposure to IL-3, HSV-1 or IL-3 and HSV-1. These were receptors involved in chemotaxis, antigen uptake, activation and maturation, migration, apoptosis, cytotoxicity and costimulation. Infectious and ultraviolet-inactivated HSV-1 did not differentially affect surface receptor regulation, consistent with the lack of productive virus infection in PDC, which was confirmed by HSV-1 real-time polymerase chain reaction and experiments involving autofluorescing HSV-1 particles. Viral entry was mediated at least in part by endocytosis. Time–course experiments provided evidence of a co-ordinated regulation of PDC surface markers, which play a specific role in different aspects of PDC function such as attraction to inflamed tissue, antigen recognition and subsequent migration to secondary lymphatic tissue. This knowledge can be used to investigate PDC surface receptor functions in interactions with other cells of the innate and adaptive immune system, particularly natural killer cells and cytotoxic T lymphocytes.
Keywords: cell surface molecules, dendritic cells, human, viral
Introduction
In 1999, two independent groups identified plasmacytoid dendritic cells (PDC) as major producers of type I interferons (IFN).1,2 These cells play an important role in innate immune defences against bacterial and viral infections.3 The recognition of their cognate antigens by the endosomal Toll-like receptors (TLR) 7 and 9 initiates a downstream signalling cascade via the IFN response factor 7 and nuclear factor-κB, which, after phosphorylation, promote the transcription of pro-inflammatory cytokines and IFN.4 These soluble factors orchestrate the early immune response.5 Exposure of PDC to viruses or interleukin-3 (IL-3) induces a potent T helper type 1 or type 2 polarization, respectively, which links the innate and adaptive immune responses.6–8
Originally characterized as lineage-marker negative, PDC can now be positively isolated via the specific surface receptors BDCA2 (CD303) and BDCA4 (CD304).9 The PDC express CD2, CD4, CD7, CD11a, CD18, CD36, CD38, CD43, CD44, CD45RA, CD54, CD58, CD62 ligand (CD62L), CD86, CD98, CD116, CD123, CD162, human leucocyte antigen (HLA) -DR, HLA-DQ and HLA-A/B/C.9 In PDC maturation, CD40, CD80, CD83, CD86, HLA-DR and major histocompatibility complex class I (MHC-I) were found to be up-regulated, whereas CD62L and CD183 were down-regulated.6 CD31, CD68 and CD336,10 as well as CD32, CD184, CD191, CD192, CD195, CD197 and CD252, were described as other surface receptors.11 Recently, CD97,12 CD170 (Siglec-5)13 and CD253 (TRAIL)14 were found to be expressed on PDC. Surface receptors were reported to mediate important functions, e.g. migration of PDC to secondary lymphatic tissue via CD62L15,16 and CD197 (CCR7).17
Plasmacytoid DC are multifunctional cells that interact with many cell types of the innate and adaptive immune system. They potently stimulate T cells in allogeneic mixed lymphocyte reactions and can prime antigen-specific CD8+ and CD4+ T cell responses in vitro and in vivo.18,19 In tumour tissue, PDC can interact with regulatory T cells resulting in subversion of tumour immunity.20,21 Natural killer (NK) T cells were partially activated by PDC-secreted IFN-α and fully stimulated by cell : cell contact involving Ox40 (CD134).22 The IL-3 produced by a subset of CD8+ cells increases the expression of CD336 on a subset of PDC, which reduces IFN-α secretion and cytotoxicity.10 CD300a/c play an important role in cross-regulating tumour necrosis factor-α and IFN-α secretion from PDC.23
The PDC appear to drive antiviral immune responses mainly via secretion of type I IFN. However, evidence is accumulating that surface receptors are relevant in the interaction of PDC with other immune cells. In this respect, PDC are reported to internalize exogenous antigens and, after processing in endosomes, to efficiently cross-present these on MHC-I to CD8+ T cells.24 Cross-priming of naïve CD8+ T cells after TLR activation was important for the induction of adaptive immune responses.25 Endocytosis of cytomegalovirus antigen together with CpG-B stimulation resulted in activation of cytomegalovirus-specific memory CD4+ cells.26
Therefore, the aim of our study was to characterize the expression and regulation of PDC surface receptors in response to herpes simplex virus type 1 (HSV-1) stimulation. Based on chip and flow cytometry analyses, we focused on surface receptors which might play an important role in the PDC life cycle from the attraction to inflamed tissue and antigen recognition and uptake, to the migration to secondary lymphatic tissue. Of particular interest were receptors that could mediate interaction of PDC with other cells of the innate and adaptive immune system. Finally, we investigated whether ultraviolet-inactivated (HSVUV) or infectious (HSVINF) HSV-1 had different effects on the regulation of PDC surface receptors.
Materials and methods
Purification and cultivation of cells
Peripheral blood mononuclear cells (PBMC) were freshly isolated from ethylenediamine tetraacetic acid (EDTA) -anticoagulated blood taken from healthy volunteers, approved by the ethical committee of the medical faculty, University of Erlangen-Nürnberg (No. 3299). After centrifugation using a Ficoll–Hypaque density gradient, PDC were purified from PBMC using the BDCA4 cell isolation kit (Miltenyi Biotec, Bergisch Gladbach, Germany) and two-column purification as described previously.27 Viability of isolated cells was checked by trypan blue staining and was regularly above 95%. Plasmacytoid DC were cultivated in RPMI-1640 medium (Gibco, Eggenstein, Germany) supplemented with 10% heat-inactivated (56°, 60 min) fetal calf serum (FCS; Cambrex, Verviers, Belgium; Lonza, Basel, Switzerland), 50 mg/ml glutamine, 200 U/ml penicillin and 90 U/ml streptomycin, supplemented with 20 ng/ml IL-3 (R&D Systems, Wiesbaden, Germany). When stimulated with HSVUV, the PDC were cultivated in the presence and absence of IL-3.
Generation of the HSV-1 stocks
A clinical HSV-1 isolate was grown on Vero cells deficient for the genes for IFN-α and IFN-β1.28 The supernatant was harvested at peak viral replication after 3–4 days of infection, subjected to one cycle of freezing and thawing and then cleared by centrifugation and filtration through 0·22 μm pores. The lack of IFN-α2a/2b in the HSV-1 stock was confirmed by enzyme-linked immunosorbent assay (ELISA). An aliquot of the virus stock was inactivated by application of 120 000 microjoules/cm2 using the Stratalinker UV Crosslinker 1800 (Stratagene, Amsterdam, the Netherlands). Cells were stimulated with 106 plaque-forming units/ml HSVINF or an identical volume of HSVUV unless indicated otherwise. The autofluorescing 166v HSV-1 isolate, which expresses a green fluorescent protein-fused VP22 protein and shows similar growth kinetics to its parent virus,29 was also grown on Vero cells. Supernatants were harvested after repeated freezing and thawing of the cells and were concentrated by sucrose density gradient centrifugation. Infection of cells was monitored using the inverted live-cell imaging system DMI 6000 B, Leica Microsystems (Wetzlar, Germany).
Chip analysis
Plasmacytoid DC were purified from a total of six donors (Table 1) and either cultivated in medium containing IL-3 alone or additionally stimulated with HSVUV for 6 hr. RNA was extracted from pooled PDC using the RNeasy Mini kit together with QiaShredder columns and a DNAse on-column digestion, according to the manufacturer’s recommendations (Qiagen, Hilden, Germany). The concentration and quality of the eluted RNA was determined using a 2100 Bio-Analyzer (Agilent Technologies, Waldbronn, Germany). RNA was transcribed into complementary DNA using oligo-dT primers, fluorescently labelled, and then hybridized to a Human Genome U133 Plus 2·0 Array (Affymetrix, Santa Clara, CA). These services, in addition to read-out of the data and a preliminary data analysis, were provided by the Kompetenzzentrum für Fluoreszente Bioanalytik, Regensburg, Germany. When a surface receptor was detected by more than one probe set, the highest value observed was used for analysis.
Table 1.
Characteristics of input cells for the chip analysis
| PDC IFN-α production (pg/ml) |
|||||
|---|---|---|---|---|---|
| Donor no. | PBMC count (× 106) | PDC count (× 106) | Percentage (%) of isolated PDC | IL-3 | HSVUV |
| 1 | 192 | 1·62 | 0·84 | 0 | 4702·3 |
| 2 | 373 | 1·22 | 0·33 | 0 | 2392·8 |
| 3 | 262 | 0·60 | 0·23 | 0 | 7559·5 |
| 4 | 228 | 0·52 | 0·23 | 0 | 5560·1 |
| 5 | 200 | 1·08 | 0·54 | 23·9 | 1693·4 |
| 6 | 240 | 0·72 | 0·30 | 17·3 | 1640·6 |
PDC, plasmacytoid dendritic cells; PBMC, peripheral blood mononuclear cells; UV-inactivated herpes simplex virus type 1 (HSVUV).
Flow cytometry analysis
Either 106 PBMC or 15 000 PDC were washed once in Dulbecco’s phosphate-buffered saline (DPBS) supplemented with 1% FCS and 1 mm EDTA (Sigma-Aldrich, Taufkirchen, Germany), incubated with FcR-blocking reagent (Miltenyi Biotec) at 4° for 10 min to reduce unspecific binding, and then stained with the specific antibodies at 4° for 20 min. Fresh PDC were identified within the PBMC as BDCA2+ BDCA4+ cells and CD4+ CD11c− cells negative for lineage (lin) markers CD3, CD14, CD16 and CD20. The purity of the isolated PDC was determined as the percentage of BDCA2+ CD4+ cells and CD4+ CD11c− lin− cells as described previously.30 Contaminating cell populations within the isolated PDC were identified as CD3− CD16+ NK cells, CD19+ CD20+ B cells, CD4+ CD14+ monocytes and CD4+ CD11c+ lin− myeloid dendritic cells (MDC). After fixation in 4% paraformaldehyde (Sigma-Aldrich), the cells were analysed using a four-colour FACSCalibur with cellquest 3.3 software (BD Biosciences, Heidelberg, Germany). Cultivated PDC were incubated on ice for 10 min, harvested and washed using DPBS with 1% FCS and 1 mm EDTA. After FcR blocking, PDC were stained using fluorescein isothiocyanate (FITC) or phycoerythrin (PE) -conjugated antibodies for surface receptors investigated in this study. For this approach, PDC were, respectively, identified as positive for BDCA4-PE or HLA-DR-FITC, and negative for PE/Cy5-conjugated anti-CD14 and anti-CD11c to exclude contaminating monocytes and MDC. Unconjugated antibodies were incubated with the isolated cells, followed by staining with a secondary goat anti-mouse immunoglobulin G (IgG) (H+L)-Fab fragment in the presence of 1% normal goat serum (Dianova, Hamburg, Germany) and 1 mm EDTA, and subsequent counterstaining with BDCA4-PE, CD11c and CD14. All incubation steps were carried out at 4° except for CD195, where incubation was performed at room temperature. Intracellular fluorescence-activated cell sorting (FACS) staining for CD63, CD74, CD180 and CD257 was performed using the Cytofix/Cytoperm Fixation/Permeabilisation kit (BD Biosciences) as recommended by the manufacturer.
Antibodies
Antibodies against the following surface antigens were purchased from Immunotools (Friesoythe, Germany): CD2, CD9, CD11a, CD14, CD18, CD29, CD31, CD33, CD36, CD37, CD38, CD43, CD44, CD46, CD48, CD49d, CD50, CD54, CD55, CD58, CD59, CD62L, CD63, CD66acde, CD74, CD80, CD95, CD97, CD99R, CD103, HLA-DR, all FITC-conjugated; CD69-PE, and CD14-PE/Cy5; CD26, CD53 and CD162 were unconjugated. CD3-FITC, CD3-PE, CD4-FITC, CD4-PE, CD19-FITC, CD20-FITC, CD45-FITC, CD195-FITC and MHC-I-PE were obtained from BD Biosciences; CD8-FITC, CD11c-PE/Cy5, CD16-FITC, CD19-PE, CD83-FITC, CD161-PE, CD305-PE and CD336-PE from BD Pharmingen (Heidelberg, Germany); CD40-FITC, CD82-FITC, CD134-FITC, CD150-FITC, CD180-PE, CD253-PE, CD257-FITC, CD262-PE, CD274-PE and CD277-PE were from NatuTec (Frankfurt, Germany); CD47, CD184 and goat anti-mouse IgG (H+L)-FITC (Fab-fragment) were from Dianova; CD1c-PE, CD123-PE, CD303-FITC and CD304-PE from Miltenyi Biotec; CD156b-FITC, CD183-FITC, CD197-FITC, CD229-PE and CD319-PE were from R&D Systems. CD170 (Siglec-5) was stained using clone 1A5 kindly provided by Paul Crocker, Wellcome Trust Biocentre, College of Life Sciences, University of Dundee, Dundee, UK. The IgG2a-FITC (R&D Systems), IgG1-PE (BD Biosciences), unconjugated IgG1 (Invitrogen, Karlsruhe, Germany) and IgG2a-PE/Cy5 (Immunotools) served as isotype controls.
Determination of IFN-α
Interferon-α 2a/2b in the cell culture supernatants was measured with an ELISA module set (Bender Medsystems, Vienna, Austria). Samples were diluted appropriately to obtain signals within the linear range of the assay.
HSV-1 real-time analysis
Vero cells and PDC were exposed to HSVUV and HSVINF at a multiplicity of infection of 1 for 2 hr. The cells were trypsinized after infection to remove cell-bound virus. DNA was extracted from cell culture supernatants and cells at different time intervals post-infection, using the DNA Large Volume kit on the MagNA Pure instrument (Roche, Mannheim, Germany). The concentration of HSV-1 DNA was determined using the artus HSV-1/2 real-time polymerase chain reaction (PCR) kit (Qiagen, Hamburg, Germany) on an ABI Prism 7000 instrument (Applied Biosystems, Darmstadt, Germany) according to the manufacturer’s recommendations.
Quantification of surface receptor messenger RNA
Real-time PCR analyses for CD63, CD74, CD180 and CD257 were performed as described previously.30 Primers for the generation of standards and messenger RNA quantification are given in Table 2.
Table 2.
Primers for the generation of standards and messenger RNA quantification of the surface receptors CD63, CD74, CD180, and CD257
| Gene | Outer primers | Real-time PCR primers | Linear range (copies/reaction) | Reference sequence | ||
|---|---|---|---|---|---|---|
| CD63 | CD63_outer_s: | 5′-gcagtgggactgattgccg-3′ | CD63_205s: | 5′-gggctacccctggctctct-3′ | 101–108 | AK311893 |
| CD63_outer_as: | 5′-gatcataagacaatagttctcc-3′ | CD63_279as: | 5′-ccacaaaagccaccaggaa-3′ | |||
| CD74 | CD74_outer_s: | 5′-ggagccctgtacacaggc-3′ | CD74_202s: | 5′-aggccaccaccgcctact-3′ | 102–108 | BC018726 |
| CD74_outer_as: | 5′-cgttgggaagcttcatgcg-3′ | CD74_272as: | 5′-gttctgggaggtgactgtcagtt-3′ | |||
| CD180 | CD180_outer_s: | 5′-gccagattaactggatacatg-3′ | CD180_496s: | 5′-ggcagaaacatcgcttaatgg-3′ | 102–108 | NM_005582 |
| CD180_outer_as: | 5′-agtactttcagattccgtgc-3′ | CD180_566as: | 5′-gattggatattcccgtttggatt-3′ | |||
| CD257 | CD257_outer_s: | 5′-ccagcaaacctactgtacag-3′ | CD257_151s: | 5′-gccaagccctgccatgta-3′ | 101–108 | NM_006573 |
| CD257_outer_as: | 5′-tccctttctgtggagtcatc-3′ | CD257_224as: | 5′-accacagggaatggatcatttc-3′ | |||
s, sense; as, antisense; PCR, polymerase chain reaction.
Western blotting
The sodium dodecyl sulphate-denatured PDC supernatants were separated on a 10% polyacrylamide gel and transferred to a polyvinylidene fluoride membrane (Millipore, Schwalbach, Germany). CD257 was stained using an unconjugated mouse IgG1 against human BLyS (BAFF) (NatuTec) diluted 1 : 500 and a polyclonal rabbit anti-mouse horseradish peroxidase-conjugate diluted 1 : 1000 (Dako Deutschland GmbH, Hamburg, Germany). After adding enhanced chemiluminescence solution containing luminol (Sigma), luminescence was documented using the Fujifilm LAS-1000 plus gel documentation system.
Confocal microscopy
Plasmacytoid DC were cultivated overnight in medium containing IL-3, exposed to the autofluorescing 166v HSV-1 isolate (with a multiplicity of infection of 1) on ice for 1 hr and then at 37° for different time periods. After washing in cold DPBS, PDC were transferred to glass slides (Medco Diagnostika GmbH, Munich, Germany) and fixed with 4% paraformaldehyde for 1 hr. The slides were washed three times in DPBS plus 0·05% Tween-20, blocked and permeabilized with 1% bovine serum albumin plus 0·3% saponin for 30 min, and incubated with the rabbit anti-human EEA-1 antibody (New England Biolabs, Frankfurt, Germany) at a dilution of 1 : 100 overnight. The slides were washed three times, incubated with an AlexaFluor 633-conjugated goat anti-rabbit F(ab′)2 fragment (Invitrogen) at a dilution of 1 : 1000 for 60 min and stained using DAPI. Slides were mounted using Fluoprep (Biomérieux, Nürtingen, Germany) and analysed with a TCS SP5 laser scanning microscope (Leica Microsystems, Mannheim, Germany).
Data analysis and statistics
The expression of PDC surface markers was determined as mean fluorescence intensities. To obtain normal distributions, these values were transformed logarithmically (log10). Experiments performed in parallel (PDC exposed to IL-3 and IL-3/HSVUV, PDC exposed to IL-3/HSVUV and HSVUV) were analysed using the paired t-test; others experiments used the unpaired t-test. After correction for multiple comparisons (Bonferroni, n = 51), a two-sided P-value ≤ 0·05 was considered significant. Chip and flow cytometry-based signals for PDC surface receptor expression and regulation were correlated using linear regression analysis.
Results
PDC purity
The percentage of PDC within the PBMC and the purity of the isolated PDC were determined in six separate experiments using different donors. The median percentage of BDCA2+ BDCA4+ cells and CD4+ CD11c− lin− cells was 0·35% [interquartile ranges (IQR) 0·29–0·42% and 0·25–0·55%, respectively] (Fig. 1a, upper panel). In isolated PDC, the median purity of BDCA2+ CD4+ cells was 93·8% (IQR, 91·1–95·7%) and of CD4+ CD11c− lin− cells 93·2% (IQR, 91·8–94·5%) (Fig. 1a, lower panel). Contaminating cell populations were monocytes (median, 1·91%; IQR, 1·40–2·48%), MDC (1·20%; 0·93–1·55%), B cells (0·92%; 0·89–1·05%) and NK cells (0·17%; 0·13–0·78%) determined in five separate experiments (Fig. 1b). The majority of contaminating cells therefore were monocytes and MDC, which up-regulate BDCA4 upon stimulation.31
Figure 1.
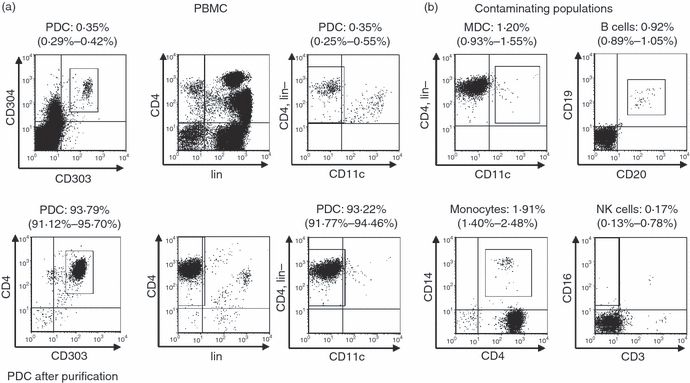
Purity of isolated plasmacytoid dendritic cells (PDC). (a) The frequency of PDC was determined as cells positive for BDCA2 (CD303) and BDCA4 (CD304) within the peripheral blood mononuclear cells (PBMC) (upper panel) or as BDCA2+ CD4+ cells after magnetic bead isolation (lower panel). In addition, PDC were identified as CD4+ CD11c− cells not expressing the lineage (lin) markers CD3, CD14, CD16 and CD20. One representative sample out of six separate donors is shown. The numbers above the figures indicate median and interquartile ranges. (b) Frequency of contaminating myeloid dendritic cells (MDC), B cells, monocytes and natural killer (NK) cells within the isolated PDC.
Identification of PDC surface receptors by chip analysis
To obtain sufficient amounts of RNA for the chip analysis, PDC were isolated from PBMC of six donors and cultivated in parallel in IL-3 or IL-3/HSVUV for 6 hr. In the IL-3-treated cell cultures, only trace amounts of IFN-α were observed in two of six donors, whereas major IFN-α secretion was induced upon HSVUV in all donors (Table 1). The total amount of RNA isolated from pooled PDC with and without stimulation by HSVUV was 4·18 μg and 4·52 μg, respectively. These RNA samples were used for chip hybridization after confirming RNA integrity (data not shown). The chip contained the data of 323 receptors listed in the CD classification. To account for the small percentage of contaminating cells, we introduced as threshold the signal value of TLR9, which is expressed at low levels almost exclusively in PDC and B cells.32,33 One hundred and thirty-four receptors showed a stronger signal than TLR9 before or after HSVUV stimulation. For further analysis, 64 receptors were selected which we considered to be indicators of important functions in the PDC life cycle and in their interaction with other immune cells (Fig. 2). Six surface receptors with expression levels below TLR9 were included as negative controls (CD1c, CD3, CD14, CD16, CD19, CD161).
Figure 2.
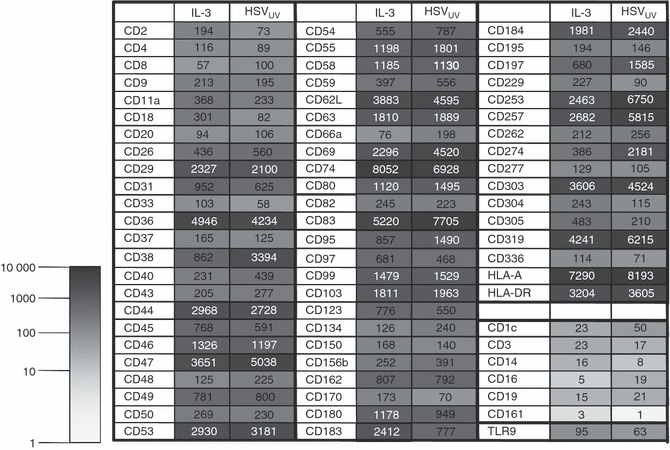
Chip analysis of plasmacytoid dendritic cell (PDC) surface receptors. Results of the Human Genome U133 Plus 2·0 Array (Affymetrix) for selected surface receptors after cultivation of PDC in medium containing interleukin-3 (IL-3) or additionally exposed to UV-inactivated herpes simplex virus type 1 (HSVUV) for 6 hr. The hybridization signals are given as numerical value and colour-coded. Six surface receptors were selected as negative controls (CD1c, CD3, CD14, CD16, CD19, CD161). The expression of Toll-like receptor 9 was used as reference signal.
Identification of new PDC surface receptors by flow cytometry
The expression of surface receptors was further analysed by flow cytometry using PDC from a total of 35 healthy donors. To minimize contaminating cell populations, PDC were identified as BDCA4+ CD11c− CD14− cells or HLA-DR+ CD11c− CD14− cells. By this approach, a median percentage of 3·67% of cells remained unidentified. As a consequence, only receptors identified on > 3·67% of cells were considered as expressed on PDC. The six receptors chosen as negative controls (see above) were confirmed to be negative by flow cytometry (data not shown). Thirteen of the 64 receptors identified as positive on the chip were not expressed on the PDC surface. These were receptors with chip signals below 250 (CD9, CD20, CD33, CD37, CD134, CD150, CD277); surface markers expressed on leukaemic but not freshly isolated PDC (CD262);34 receptors on TLR4-positive cells but not on PDC (CD180);35 surface molecules with known ectodomain shedding (CD257);36 receptors with intracellular expression (CD63, CD74);37,38 and the human mucosal lymphocyte antigen 1 (CD103).39 A total of 51 receptors were found to be expressed by flow cytometry. Among these were receptors newly identified on the PDC surface, namely the disintegrin metalloproteinase and CD62L-cleaving CD156b (TACE) responsible for ectodomain shedding,40 the inhibitors of activation CD305 (LAIR-1) and CD229 (Ly9, SLAMF3),41,42 and the CD2-like receptor-activating cytotoxic cells CD319 (CRACC).41
Effect of IL-3 on the regulation of PDC surface receptors
The expression of a few receptors was influenced by IL-3 only and not by HSVUV (P < 0·05 after correction for multiple comparisons) (Fig. 3). Among these, CD54 (ICAM-1) and the complement-associated CD55 (decay accelerating factor, DAF) exhibiting T-cell costimulatory functions43 were up-regulated, whereas CD229, the inhibitor of cytotoxicity, was down-regulated. The activating NK cell receptor CD336, reported to be expressed on a subset of PDC and, after cross-linking, paradoxically inhibited PDC IFN-α production,10 was up-regulated upon IL-3, but not upon IL-3/HSVUV.
Figure 3.
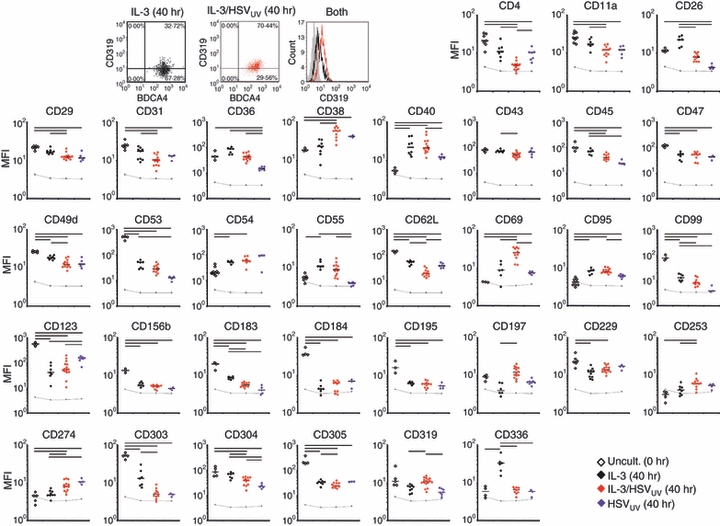
Flow cytometry analysis of the expression and regulation of plasmacytoid dendritic cell (PDC) surface receptors. Representative dot plot and histogram analysis of the expression of CD319 in PDC cultivated in medium containing interleukin-3 (IL-3; black) and additionally exposed to UV-inactivated herpes simplex virus type 1 (HSVUV; red) for 40 hr. Surface receptor expression determined in uncultivated PDC directly after the isolation of peripheral blood mononuclear cells (PBMC) (open diamonds) or after cultivation in IL-3 (black diamonds), IL-3/HSVUV (red diamonds), or HSVUV (blue diamonds). The mean fluorescence intensities (MFI) of a total of 35 donors are presented on a logarithmic scale (log10). After correction for multiple comparisons (Bonferroni; n = 51), P values ≤ 0·05 are indicated as horizontal bars. The grey lines represent isotype control values. Only those receptors are presented which were significantly regulated upon IL-3 and/or HSV-1 exposure. A total of 18 receptors were found to be expressed but not regulated (CD2, CD8, CD18, CD44, CD46, CD48, CD50, CD58, CD59, CD66a, CD80, CD82, CD83, CD97, CD162, CD170, HLA-DR, HLA-ABC).
Effect of HSVUV on the regulation of PDC surface receptors
The expression of a total of 11 receptors was specifically altered after exposure to HSVUV (Fig. 3). Down-regulation was observed for CD4;15 the adhesion and migratory molecules CD11a, CD29 and CD31; the adenosine deaminase CD26;44 the apoptotic cell-binding molecule CD36;45 the haematopoietic marker and phosphatase CD45 reported to regulate Src family kinase signalling networks in immune cells;46 and the axon guidance factor CD304 (neuropilin-1), which is suspected of being part of the immunological synapse.31,47 Receptors specifically up-regulated upon HSV-1 exposure were the activation and maturation marker CD38;48 the immunoregulatory molecule CD6949 and the co-regulatory receptor CD274.26
Effect of HSVUV and IL-3 on the regulation of PDC surface receptors
Several surface molecules were affected both by IL-3 and by HSVUV stimulation (Fig. 3). Down-regulation was observed for CD49d, CD53 and CD99 as adhesion and migratory molecules; CD62L as binding partner for CD162 on inflamed endothelial cells;50 the IL-3 receptor CD123; the CX-chemokine receptor 3 (CD183);17 the endocytosis marker CD303;51 and the inhibitor of activation CD305. Markers for costimulation (CD40) and apoptosis (CD95) were up-regulated. The expression of a few receptors was altered only after concomitant exposure to IL-3 and HSVUV. These were the adhesion and migratory molecule CD43; the homing receptor CD197 (CCR7);17 the TNF-related apoptosis-inducing ligand (TRAIL) CD25314 and the cytotoxicity-activating receptor CD319. The molecules CD47 and CD156b as well as the CX-chemokine receptor 4 (CD184) and the CC-chemokine receptor 5 (CD195)52 were down-regulated by all stimuli, suggesting PDC aging rather than a specific response.
Correlation of chip and flow cytometry data
The 51 surface receptors found to be expressed by flow cytometry were correlated to the chip data. For these purposes, the expression signals of both methods were transformed logarithmically (log10). Linear regression analysis showed a trend, but no significant correlation (r2 = 0·07; P = 0·07). For the surface receptor regulation, the fold changes between PDC cultivated in IL-3 and additionally exposed to HSVUV were transformed logarithmically (log2), revealing a significant correlation between chip and flow cytometry data (r2 = 0·34; P < 0·0001).
Dynamics of receptor regulation
To obtain a more comprehensive picture of the temporal pattern of surface receptor expression, we performed time–course experiments looking at days 1, 2 and 3 post-exposure of PDC to HSVUV/IL-3 (summarized in Table 3). Each receptor was analysed using cells from two donors. An arbitrary threshold of more than 50% change compared with fresh PDC was introduced, which corresponded well with the statistical analysis performed for the data obtained at 40 hr of stimulation (Fig. 3). Ten of 11 receptors with enhanced expression were already up-regulated at day 1 after stimulation. Four of these (CD38, CD40, CD54, CD95) remained up-regulated, whereas six receptors (CD36, CD69, CD253, CD274, CD319, CD336) were subsequently down-regulated. CD197 was not up-regulated before day 2. Decrease of receptor expression also started mostly on day 1 (Table 3). Only a few receptors were down-regulated on day 2 (CD31, CD156, CD304) or day 3 (CD2, CD49d, CD229).
Table 3.
Dynamics of plasmacytoid dendritic cell (PDC) surface receptor regulation
| Mode of regulation compared with fresh PDC | 1st day post-stimulation | 2nd day post-stimulation | 3rd day post-stimulation |
|---|---|---|---|
| Transient up-regulation at (with subsequent down-regulation) | CD36, CD69, CD253, CD274, CD319, CD336 | ||
| Up-regulation starting at | CD38, CD40, CD54, CD95 | CD197 | |
| Down-regulation starting at | CD4, CD45, CD47, CD48, CD53, CD62L, CD99, CD123, CD162, CD183, CD184, CD195, CD303, CD305 | CD31, CD156b, CD304 | CD2, CD49d, CD229 |
PDC were stimulated using UV-inactivated herpes simplex virus type 1 plus interleukin-3. Each receptor was analysed using PDC of two donors. Because the regulation of HLA-DR and HLA-ABC was highly donor-specific, data are not reported. Surface receptors showing an increase or decrease in expression by more than 50% from unstimulated PDC were considered to be up-regulated or down-regulated, respectively. The following receptors did not show a difference of more than 50% at any of the 3 days: CD8, CD11a, CD18, CD26, CD29, CD43, CD44, CD46, CD46, CD50, CD55, CD58, CD59, CD66a, CD80, CD82, CD83, CD97 and CD170.
Identification of intracellular receptors
To investigate receptors which were highly expressed on the chip but not detected on the PDC cell surface, we performed real-time PCR analyses and intracellular FACS staining for CD63, CD74, CD180 and CD257. Their mRNA expression was confirmed in PDC cultivated in IL-3 and IL-3/HSVUV for 6 hr (Fig. 4a). Intracellular protein expression was observed for CD74 and CD180 on fresh PDC, and for CD63 after cultivation in IL-3; all were slightly down-regulated upon HSVUV stimulation (Fig. 4b). In contrast, CD257 was only marginally expressed after cultivation in IL-3 and IL-3/HSVUV. However, soluble multimeric forms were detected by Western blotting in the supernatants of cultivated PDC, as described by others,36 which occurred more readily after HSVUV stimulation (Fig. 4c).
Figure 4.
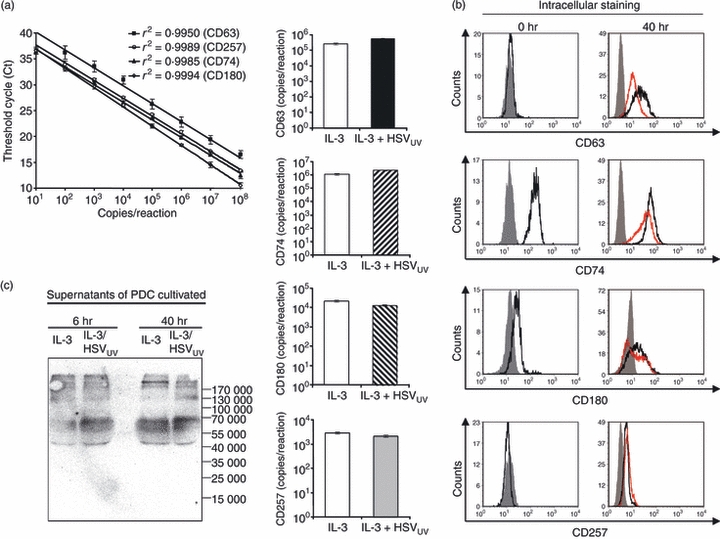
Expression of CD63, CD74, CD180 and CD257 in plasmacytoid dendritic cells (PDC). (a) Real-time polymerase chain reaction standard curves, presented as mean and 95% confidence intervals of three separate experiments, and the respective messenger RNA quantification in interleukin-3 (IL-3) and IL-3/HSVUV-exposed PDC pooled from four donors, normalized for the input RNA using the housekeeping gene β-glucuronidase. (b) Intracellular flow cytometry staining of fresh PDC and PDC cultivated for 40 hr, representative of three donors. The histograms show isotype controls (grey filled curve), the effect of IL-3 (black line), and IL-3/HSVUV (red line). These receptors were not detected at the PDC surface (data not shown). (c) Western blot analysis of soluble CD257 in supernatants of PDC exposed to IL-3 and IL-3/HSVUV for 6 and 40 hr.
Effect of infectious HSV-1 on PDC surface markers
No significant differences were detected for the regulation of PDC surface receptors upon exposure to IL-3/HSVINF and IL-3/HSVUV for 40 hr (data not shown). The levels of IFN-α induced by HSVINF were slightly, but not significantly lower compared with HSVUV determined in parallel in the PDC of 14 donors (6·0 ± 4·5 ng versus 7·8 ± 7·0 ng per 105 PDC, respectively, P = 0·06). When the efficacy of the UV inactivation process was controlled, the 50% tissue culture infective dose in the HSVUV stock (0·115 × 106/ml) was 54-fold lower than in the HSVINF stock (6·17 × 106/ml). To exclude the possibility that the remaining infectious virus in the HSVUV stock was responsible for the stimulation of PDC, we diluted the HSVINF stock 50-fold and stimulated cells of two donors. The diluted stock induced 45-fold and 200-fold less IFN-α than the undiluted virus, indicating that the stimulatory effect of HSV-1 was not dependent on its infectivity. Next, Vero cells and PDC were infected in parallel with HSVINF and HSVUV. Virus replication was monitored by quantifying HSV-1 DNA in the supernatants and cells over 5 days. Both HSVINF and HSVUV replicated efficiently in the Vero cells, with slightly delayed replication kinetics of HSVUV in the infected cells and supernatants (Fig. 5a). The virus was taken up into PDC with a 2log-reduced efficiency compared with Vero cells, and neither HSVINF nor HSVUV established a productive infection (Fig. 5a). The small amounts of viral DNA detected in the PDC most likely represented input virus. These results were corroborated by experiments using the autofluorescing HSV-1 isolate 166v (Fig. 5b). The green fluorescence rapidly increased in Vero cells, whereas only a very faint signal was observed in PDC clusters at 144 hr post-infection. These results indicate that HSV-1 does not replicate in PDC and that the effects of HSV-1 on the PDC surface receptors are independent of its infectivity.
Figure 5.
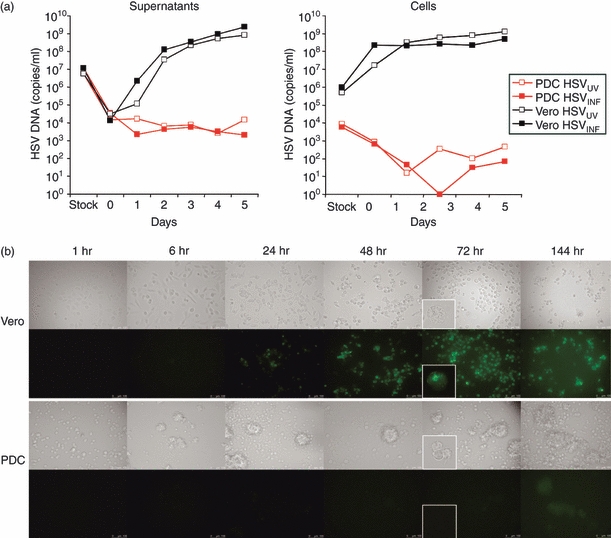
Infection of Vero cells and plasmacytoid dendritic cells (PDC) using infectious (HSVINF) and UV-inactivated (HSVUV) herpes simplex virus type 1. (a) Real-time polymerase chain reaction quantification of HSV-1 genomes in the viral stocks and supernatants (left) as well as in the infected cells (right), obtained at various time-points after exposing the cells to a multiplicity of infection (MOI) of 1. The data are representative of two separate experiments. (b) Replication of the autofluorescing HSV-1 isolate (166v)29 in Vero cells (upper panel) and PDC (lower panel), shown as increase in green fluorescence after various periods post-infection. The data represent two separate experiments in which the cells were infected with an MOI of 7.
Uptake of viral particles into PDC
To investigate the mode of viral entry, PDC were incubated with the autofluorescing HSV-1 particles for different time periods, fixed on slides and then counterstained with an antibody to EEA-1. Confocal microscopy revealed a rapid uptake of viral particles within 10–15 min, with the green fluorescence already decreasing after 45 min of incubation (Fig. 6). Viral particles colocalized with EEA1, indicating that HSV-1 can be taken up by endocytosis. However, the majority of viral particles did not colocalize, which may either suggest a rapid turnover of viral particles or concomitant uptake of HSV-1 by infection of PDC.
Figure 6.
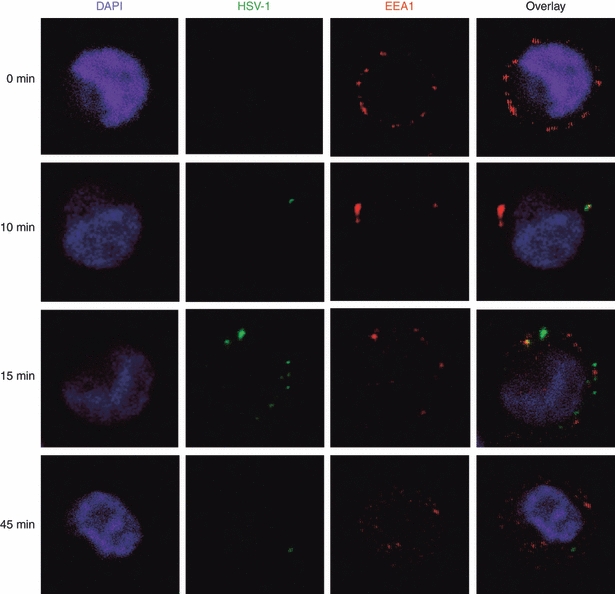
Dynamics of herpes simplex virus type 1 (HSV-1) entry into plasmacytoid dendritic cells. PDC were exposed to autofluorescing viral particles for different time periods (0, 5, 10, 15, 45, 90 and 180 min), fixed to slides, and then counterstained with an antibody to early endosomal antigen 1 (EEA1) and DAPI for nuclear staining. The selected images are representative for two independent experiments.
Discussion
Our study used a chip-based flow cytometry approach to identify new PDC surface receptors by their mRNA and protein expression. We confirmed the presence of known receptors, e.g. CD4, CXCR4 (CD184), CCR5 (CD195),53 CD62L,1 CD123,54 CD197,52 CD303 and CD304,9 CD253,14 CD27426 and CD336.10 Notably, we identified new surface receptors not yet known to be expressed on PDC (Fig. 3), in particular the CD62L-cleaving metalloproteinase CD156b responsible for ectodomain shedding;40 the broadly expressed inhibitors of activation CD22941 and CD305 (LAIR-1);55 and CD319, which activates NK cell cytotoxicity via homotypic interactions.41 CD63, CD74 and CD180 were detected intracellularly, and CD257 was detected as a soluble protein (Fig. 4). The exact functions of these molecules remain to be determined, in particular for the interaction of PDC with other cells of the innate and adaptive immune system. Promising candidates may be CD8+ cytotoxic T cells and NK cells, which colocalize with PDC in herpetic lesions.56
The input for the chip and flow cytometry analyses were PDC, which were isolated by magnetic bead labelling and a two-column purification procedure. They still harboured about 6% of contaminating cells (Fig. 1). Meanwhile, commercial kits are available which first deplete lin+ cells and then purify BDCA4+ cells. This procedure results in 99% pure PDC, but substantially decreases the yield of cells, which was critical in particular for the chip analysis. To account for the contaminating cells, we introduced a threshold for both chip and flow cytometry analysis, which worked well for most of the lineage markers. However, CD20 showed up on the chip, although this was not confirmed by flow cytometry. This effect may be particularly relevant for surface receptors, which are strongly expressed by a contaminating cell population.
Our approach to stimulate PDC with IL-3, IL-3 plus HSVUV, and HSVUV in the absence of IL-3 clarified the effects caused by these other stimuli. The HSVUV specifically activated PDC by up-regulating CD38, CD69 and CD274, whereas adhesion markers (CD11a, CD29, CD31), binding of apoptotic cells (CD36), phosphatase activity (CD45), CD4 and CD304 were down-regulated (Fig. 3). Interleukin-3 specifically induced costimulatory T-cell activity via regulation of CD54, CD55 and CD229. Several molecules which were affected by both IL-3 and HSVUV were consistently regulated into the same direction by the two different stimuli (CD40, CD49, CD53, CD62L, CD95, CD99, CD123, CD183, CD303, CD305). For some surface molecules, the combination of IL-3 and HSV was necessary to induce a significant change in expression (CD43, CD197, CD253, CD319). These data corroborate the role of IL-3 secretion by infiltrating CD8+ cells at the site of infection in enhancing PDC innate and adaptive immune responses.10
Receptors involved in a certain function were uniformly up- or down-regulated, indicating that the receptor regulation occurred in a coordinated manner. In this respect, down-regulation was observed for the chemokine receptor CD183, which mediates the attraction of immune cells to inflamed tissue,17 and for CD4 and CD303, involved in antigen uptake.15,51 Receptors relevant for cell adhesion and migration (CD11a, CD29, CD31, CD43, CD49d, CD62L, CD99) were uniformly down-regulated, which may contribute to the emigration of PDC from inflamed tissue.16 Co-regulatory effects on CD4+ T cells may be mediated by up-regulation of CD274,26 the complement-associated decay accelerating factor CD55,43 and down-regulation of the inhibitors of activation CD30555 and CD336.10 Apoptotic and cytotoxic functions may be deduced from the enhanced expression of CD253 (TRAIL)14 and CD319 (CRACC),41 respectively.
The time–course experiments revealed that the regulation of most surface markers started very early upon stimulation (Table 1). Notably, the expression of some receptors which were up-regulated already at day 1 declined again at day 2 and/or 3 post-stimulation (CD36, CD69, CD253, CD274, CD319, CD336), suggesting important PDC functions at the site of inflammation. In this respect, CD197 (CCR7) was not up-regulated before day 2 post-stimulation, which indicates subsequent, but not immediate, lymph-node homing.10 Among the receptors that were not down-regulated before day 2 or 3 post-stimulation, were CD156b, responsible for ectodomain shedding; CD304, as presumable part of the immunological synapse; CD2, as costimulatory molecule; and CD229 as inhibitor of cytotoxicity. These receptors plus the activation marker CD80, which was up-regulated with a delayed kinetics (data not shown), may play important roles in the lymphatic tissue.
The effect of HSVINF on the PDC surface receptor regulation was broadly similar to that of HSVUV (data not shown). Although the inactivation of HSV-1 by the UV treatment was not complete, this was most likely because of the lack of HSV-1 replication in PDC, evident from real-time PCR analysis of HSV-1 DNA and experiments using autofluorescing HSV-1 (Fig. 5). These data were confirmed by a recent study which failed to detect immediate early gene expression and viral transcripts in HSV-2-exposed PDC.56 Our results indicate that non-infectious HSV-1 can stimulate PDC surface receptor regulation in a similar manner to infectious HSV-1, most likely through interaction with TLR9.57 These data are corroborated by the rapid uptake of viral particles into PDC, mediated at least in part by endocytosis (Fig. 6). Endocytosis with subsequent TLR9 interaction was similarly observed for CpG oligonucleotides.58 Further evidence comes from the lack of permissive cytomegalovirus infection in human PDCs, which, regardless of viral replication, secreted IFN-α that was blocked by inhibitory CpG oligonucleotides.59 Notably, the regulation of PDC surface receptors by HSV-1 in our study yielded discrepant results compared with PDC exposed to cytomegalovirus59 and MDC exposed to HSV-1.60 Hence, dendritic cell surface receptors appear to be regulated tightly and specifically in response to viral stimulation.
Acknowledgments
The data were presented in part at the 3rd European Congress of Virology, 1–5 September 2007, Nürnberg, Germany. We thank Bernhard Fleckenstein for continuous support. The monoclonal CD170 antibody (clone 1A5) was kindly provided by Paul Crocker, Wellcome Trust Biocentre, College of Life Sciences, University of Dundee, Dundee, UK. We thank Gillian Elliott, Department of Virology, Faculty of Medicine, Imperial College London, London, UK, and Peter O’Hare, Marie Curie Research Institute, The Chart, Oxted, Surrey RH8 0TL, UK, for contributing the autofluorescing 166v HSV-1 isolate. We thank Hülya Misir, Gitta Moschik, Ariane Bartlime and Ingrid Müller-Fleckenstein for excellent technical assistance. This work was supported by the graduate college 1071 (‘Viruses of the immune system’; Project B5), the German Research Foundation (SCHM 1702/1-1; SFB466, Project A12; SCHM1702/2-1), and the ‘Akademie der Wissenschaften und Literatur zu Mainz’.
Glossary
Abbreviations:
- CCR
CC-chemokine receptor
- HSV
herpes simplex virus
- IFN
interferon
- IL
interleukin
- INF
infectious
- IQR
interquartile range
- lin
lineage
- MDC
myeloid dendritic cells
- NK cells
natural killer cells
- PBMC
peripheral blood mononuclear cells
- PCR
polymerase chain reaction
- PDC
plasmacytoid dendritic cells
- TLR
Toll-like receptor
- UV
UV-inactivated.
Disclosures
The authors have no financial conflict of interest.
References
- 1.Cella M, Jarrossay D, Facchetti F, et al. Plasmacytoid monocytes migrate to inflamed lymph nodes and produce large amounts of type I interferon. Nat Med. 1999;5:919–23. doi: 10.1038/11360. [DOI] [PubMed] [Google Scholar]
- 2.Siegal FP, Kadowaki N, Shodell M, et al. The nature of the principal type 1 interferon-producing cells in human blood. Science. 1999;284:1835–7. doi: 10.1126/science.284.5421.1835. [DOI] [PubMed] [Google Scholar]
- 3.Fitzgerald-Bocarsly P, Dai J, Singh S. Plasmacytoid dendritic cells and type I IFN: 50 years of convergent history. Cytokine Growth Factor Rev. 2008;19:3–19. doi: 10.1016/j.cytogfr.2007.10.006. [DOI] [PMC free article] [PubMed] [Google Scholar]
- 4.Uematsu S, Akira S. Toll-like receptors and innate immunity. J Mol Med. 2006;84:712–25. doi: 10.1007/s00109-006-0084-y. [DOI] [PubMed] [Google Scholar]
- 5.Fitzgerald-Bocarsly P, Feng D. The role of type I interferon production by dendritic cells in host defense. Biochimie. 2007;89:843–55. doi: 10.1016/j.biochi.2007.04.018. [DOI] [PMC free article] [PubMed] [Google Scholar]
- 6.Cella M, Facchetti F, Lanzavecchia A, Colonna M. Plasmacytoid dendritic cells activated by influenza virus and CD40L drive a potent TH1 polarization. Nat Immunol. 2000;1:305–10. doi: 10.1038/79747. [DOI] [PubMed] [Google Scholar]
- 7.Kadowaki N, Antonenko S, Lau JYN, Liu YJ. Natural interferon α/β-producing cells link innate and adaptive immunity. J Exp Med. 2000;192:219–25. doi: 10.1084/jem.192.2.219. [DOI] [PMC free article] [PubMed] [Google Scholar]
- 8.Rissoan MC, Soumelis V, Kadowaki N, et al. Reciprocal control of T helper cell and dendritic cell differentiation. Science. 1999;283:1183–6. doi: 10.1126/science.283.5405.1183. [DOI] [PubMed] [Google Scholar]
- 9.Dzionek A, Fuchs A, Schmidt P, et al. BDCA-2, BDCA-3, and BDCA-4: three markers for distinct subsets of dendritic cells in human peripheral blood. J Immunol. 2000;165:6037–46. doi: 10.4049/jimmunol.165.11.6037. [DOI] [PubMed] [Google Scholar]
- 10.Fuchs A, Cella M, Kondo T, Colonna M. Paradoxic inhibition of human natural interferon-producing cells by the activating receptor NKp44. Blood. 2005;106:2076–82. doi: 10.1182/blood-2004-12-4802. [DOI] [PubMed] [Google Scholar]
- 11.Colonna M, Trinchieri G, Liu YJ. Plasmacytoid dendritic cells in immunity. Nat Immunol. 2004;5:1219–26. doi: 10.1038/ni1141. [DOI] [PubMed] [Google Scholar]
- 12.Matmati M, Pouwels W, van Bruggen R, et al. The human EGF-TM7 receptor EMR3 is a marker for mature granulocytes. J Leukoc Biol. 2007;81:440–8. doi: 10.1189/jlb.0406276. [DOI] [PubMed] [Google Scholar]
- 13.Lock K, Zhang J, Lu J, Lee SH, Crocker PR. Expression of CD33-related siglecs on human mononuclear phagocytes, monocyte-derived dendritic cells and plasmacytoid dendritic cells. Immunobiology. 2004;209:199–207. doi: 10.1016/j.imbio.2004.04.007. [DOI] [PubMed] [Google Scholar]
- 14.Chaperot L, Blum A, Manches O, et al. Virus or TLR agonists induce TRAIL-mediated cytotoxic activity of plasmacytoid dendritic cells. J Immunol. 2006;176:248–55. doi: 10.4049/jimmunol.176.1.248. [DOI] [PubMed] [Google Scholar]
- 15.Fanning SL, George TC, Feng D, et al. Receptor cross-linking on human plasmacytoid dendritic cells leads to the regulation of IFN-α production. J Immunol. 2006;177:5829–39. doi: 10.4049/jimmunol.177.9.5829. [DOI] [PubMed] [Google Scholar]
- 16.Venturi GM, Tu L, Kadono T, et al. Leukocyte migration is regulated by l-selectin endoproteolytic release. Immunity. 2003;19:713–24. doi: 10.1016/s1074-7613(03)00295-4. [DOI] [PubMed] [Google Scholar]
- 17.Kohrgruber N, Groger M, Meraner P, et al. Plasmacytoid dendritic cell recruitment by immobilized CXCR3 ligands. J Immunol. 2004;173:6592–602. doi: 10.4049/jimmunol.173.11.6592. [DOI] [PubMed] [Google Scholar]
- 18.Fonteneau JF, Gilliet M, Larsson M, et al. Activation of influenza virus-specific CD4+ and CD8+ T cells: a new role for plasmacytoid dendritic cells in adaptive immunity. Blood. 2003;101:3520–6. doi: 10.1182/blood-2002-10-3063. [DOI] [PubMed] [Google Scholar]
- 19.Salio M, Cella M, Vermi W, et al. Plasmacytoid dendritic cells prime IFN-γ-secreting melanoma-specific CD8 lymphocytes and are found in primary melanoma lesions. Eur J Immunol. 2003;33:1052–62. doi: 10.1002/eji.200323676. [DOI] [PubMed] [Google Scholar]
- 20.Gilliet M, Liu YJ. Generation of human CD8 T regulatory cells by CD40 ligand-activated plasmacytoid dendritic cells. J Exp Med. 2002;195:695–704. doi: 10.1084/jem.20011603. [DOI] [PMC free article] [PubMed] [Google Scholar]
- 21.Wei S, Kryczek I, Zou L, et al. Plasmacytoid dendritic cells induce CD8+ regulatory T cells in human ovarian carcinoma. Cancer Res. 2005;65:5020–6. doi: 10.1158/0008-5472.CAN-04-4043. [DOI] [PubMed] [Google Scholar]
- 22.Marschner A, Rothenfusser S, Hornung V, et al. CpG ODN enhance antigen-specific NKT cell activation via plasmacytoid dendritic cells. Eur J Immunol. 2005;35:2347–57. doi: 10.1002/eji.200425721. [DOI] [PubMed] [Google Scholar]
- 23.Ju X, Zenke M, Hart DN, Clark GJ. CD300a/c regulate type I interferon and TNF-alpha secretion by human plasmacytoid dendritic cells stimulated with TLR7 and TLR9 ligands. Blood. 2008;112:1184–94. doi: 10.1182/blood-2007-12-127951. [DOI] [PubMed] [Google Scholar]
- 24.Di Pucchio T, Chatterjee B, Smed-Sorensen A, et al. Direct proteasome-independent cross-presentation of viral antigen by plasmacytoid dendritic cells on major histocompatibility complex class I. Nat Immunol. 2008;9:551–7. doi: 10.1038/ni.1602. [DOI] [PMC free article] [PubMed] [Google Scholar]
- 25.Mouries J, Moron G, Schlecht G, Escriou N, Dadaglio G, Leclerc C. Plasmacytoid dendritic cells efficiently cross-prime naive T cells in vivo after TLR activation. Blood. 2008;112:3713–22. doi: 10.1182/blood-2008-03-146290. [DOI] [PMC free article] [PubMed] [Google Scholar]
- 26.Jaehn PS, Zaenker KS, Schmitz J, Dzionek A. Functional dichotomy of plasmacytoid dendritic cells: antigen-specific activation of T cells versus production of type I interferon. Eur J Immunol. 2008;38:1822–32. doi: 10.1002/eji.200737552. [DOI] [PubMed] [Google Scholar]
- 27.Haupt S, Donhauser N, Chaipan C, et al. CD4 binding affinity determines human immunodeficiency virus type 1-induced alpha interferon production in plasmacytoid dendritic cells. J Virol. 2008;82:8900–5. doi: 10.1128/JVI.00196-08. [DOI] [PMC free article] [PubMed] [Google Scholar]
- 28.Diaz MO, Ziemin S, Le Beau MM, et al. Homozygous deletion of the alpha- and beta 1-interferon genes in human leukemia and derived cell lines. Proc Natl Acad Sci U S A. 1988;85:5259–63. doi: 10.1073/pnas.85.14.5259. [DOI] [PMC free article] [PubMed] [Google Scholar]
- 29.Elliott G, O’Hare P. Live-cell analysis of a green fluorescent protein-tagged herpes simplex virus infection. J Virol. 1999;73:4110–19. doi: 10.1128/jvi.73.5.4110-4119.1999. [DOI] [PMC free article] [PubMed] [Google Scholar]
- 30.Kittan NA, Bergua A, Haupt S, et al. Impaired plasmacytoid dendritic cell innate immune responses in patients with herpes virus-associated acute retinal necrosis. J Immunol. 2007;179:4219–30. doi: 10.4049/jimmunol.179.6.4219. [DOI] [PubMed] [Google Scholar]
- 31.Dzionek A, Inagaki Y, Okawa K, et al. Plasmacytoid dendritic cells: from specific surface markers to specific cellular functions. Hum Immunol. 2002;63:1133–48. doi: 10.1016/s0198-8859(02)00752-8. [DOI] [PubMed] [Google Scholar]
- 32.Hornung V, Rothenfusser S, Britsch S, et al. Quantitative expression of toll-like receptor 1-10 mRNA in cellular subsets of human peripheral blood mononuclear cells and sensitivity to CpG oligodeoxynucleotides. J Immunol. 2002;168:4531–7. doi: 10.4049/jimmunol.168.9.4531. [DOI] [PubMed] [Google Scholar]
- 33.Wagner H. The immunobiology of the TLR9 subfamily. Trends Immunol. 2004;25:381–6. doi: 10.1016/j.it.2004.04.011. [DOI] [PubMed] [Google Scholar]
- 34.Blum A, Chaperot L, Molens JP, Foissaud V, Plantaz D, Plumas J. Mechanisms of TRAIL-induced apoptosis in leukemic plasmacytoid dendritic cells. Exp Hematol. 2006;34:1655–62. doi: 10.1016/j.exphem.2006.08.002. [DOI] [PubMed] [Google Scholar]
- 35.Divanovic S, Trompette A, Atabani SF, et al. Negative regulation of Toll-like receptor 4 signaling by the Toll-like receptor homolog RP105. Nat Immunol. 2005;6:571–8. doi: 10.1038/ni1198. [DOI] [PMC free article] [PubMed] [Google Scholar]
- 36.Huard B, Arlettaz L, Ambrose C, et al. BAFF production by antigen-presenting cells provides T cell co-stimulation. Int Immunol. 2004;16:467–75. doi: 10.1093/intimm/dxh043. [DOI] [PubMed] [Google Scholar]
- 37.Iannello A, Debbeche O, Martin E, Attalah LH, Samarani S, Ahmad A. Viral strategies for evading antiviral cellular immune responses of the host. J Leukoc Biol. 2006;79:16–35. doi: 10.1189/jlb.0705397. [DOI] [PubMed] [Google Scholar]
- 38.Mantegazza AR, Barrio MM, Moutel S, et al. CD63 tetraspanin slows down cell migration and translocates to the endosomal–lysosomal–MIICs route after extracellular stimuli in human immature dendritic cells. Blood. 2004;104:1183–90. doi: 10.1182/blood-2004-01-0104. [DOI] [PubMed] [Google Scholar]
- 39.Annacker O, Coombes JL, Malmstrom V, et al. Essential role for CD103 in the T cell-mediated regulation of experimental colitis. J Exp Med. 2005;202:1051–61. doi: 10.1084/jem.20040662. [DOI] [PMC free article] [PubMed] [Google Scholar]
- 40.Doedens JR, Black RA. Stimulation-induced down-regulation of tumor necrosis factor-α converting enzyme. J Biol Chem. 2000;275:14598–607. doi: 10.1074/jbc.275.19.14598. [DOI] [PubMed] [Google Scholar]
- 41.Bouchon A, Cella M, Grierson HL, Cohen JI, Colonna M. Activation of NK cell-mediated cytotoxicity by a SAP-independent receptor of the CD2 family. J Immunol. 2001;167:5517–21. doi: 10.4049/jimmunol.167.10.5517. [DOI] [PubMed] [Google Scholar]
- 42.Martin M, Del Valle JM, Saborit I, Engel P. Identification of Grb2 as a novel binding partner of the signaling lymphocytic activation molecule-associated protein binding receptor CD229. J Immunol. 2005;174:5977–86. doi: 10.4049/jimmunol.174.10.5977. [DOI] [PubMed] [Google Scholar]
- 43.Longhi MP, Harris CL, Morgan BP, Gallimore A. Holding T cells in check — a new role for complement regulators? Trends Immunol. 2006;27:102–8. doi: 10.1016/j.it.2005.12.008. [DOI] [PubMed] [Google Scholar]
- 44.Pacheco R, Martinez-Navio JM, Lejeune M, et al. CD26, adenosine deaminase, and adenosine receptors mediate costimulatory signals in the immunological synapse. Proc Natl Acad Sci U S A. 2005;102:9583–8. doi: 10.1073/pnas.0501050102. [DOI] [PMC free article] [PubMed] [Google Scholar]
- 45.Taylor PR, Martinez-Pomares L, Stacey M, Lin HH, Brown GD, Gordon S. Macrophage receptors and immune recognition. Annu Rev Immunol. 2005;23:901–44. doi: 10.1146/annurev.immunol.23.021704.115816. [DOI] [PubMed] [Google Scholar]
- 46.Hermiston ML, Zikherman J, Zhu JW. CD45, CD148, and Lyp/Pep: critical phosphatases regulating Src family kinase signaling networks in immune cells. Immunol Rev. 2009;228:288–311. doi: 10.1111/j.1600-065X.2008.00752.x. [DOI] [PMC free article] [PubMed] [Google Scholar]
- 47.Tordjman R, Lepelletier Y, Lemarchandel V, et al. A neuronal receptor, neuropilin-1, is essential for the initiation of the primary immune response. Nat Immunol. 2002;3:477–82. doi: 10.1038/ni789. [DOI] [PubMed] [Google Scholar]
- 48.Frasca L, Fedele G, Deaglio S, et al. CD38 orchestrates migration, survival, and Th1 immune response of human mature dendritic cells. Blood. 2006;107:2392–9. doi: 10.1182/blood-2005-07-2913. [DOI] [PubMed] [Google Scholar]
- 49.Sancho D, Gomez M, Sanchez-Madrid F. CD69 is an immunoregulatory molecule induced following activation. Trends Immunol. 2005;26:136–40. doi: 10.1016/j.it.2004.12.006. [DOI] [PubMed] [Google Scholar]
- 50.Bueno C, Rodriguez-Caballero A, Garcia-Montero A, Pandiella A, Almeida J, Orfao A. A new method for detecting TNF-alpha-secreting cells using direct-immunofluorescence surface membrane stainings. J Immunol Methods. 2002;264:77–87. doi: 10.1016/s0022-1759(02)00083-2. [DOI] [PubMed] [Google Scholar]
- 51.Dzionek A, Sohma Y, Nagafune J, et al. BDCA-2, a novel plasmacytoid dendritic cell-specific type II C-type lectin, mediates antigen capture and is a potent inhibitor of interferon alpha/beta induction. J Exp Med. 2001;194:1823–34. doi: 10.1084/jem.194.12.1823. [DOI] [PMC free article] [PubMed] [Google Scholar]
- 52.Penna G, Sozzani S, Adorini L. Cutting edge: selective usage of chemokine receptors by plasmacytoid dendritic cells. J Immunol. 2001;167:1862–6. doi: 10.4049/jimmunol.167.4.1862. [DOI] [PubMed] [Google Scholar]
- 53.Fong L, Mengozzi M, Abbey NW, Herndier BG, Engleman EG. Productive infection of plasmacytoid dendritic cells with human immunodeficiency virus type 1 is triggered by CD40 ligation. J Virol. 2002;76:11033–41. doi: 10.1128/JVI.76.21.11033-11041.2002. [DOI] [PMC free article] [PubMed] [Google Scholar]
- 54.Grouard G, Rissoan MC, Filgueira L, Durand I, Banchereau J, Liu YJ. The enigmatic plasmacytoid T cells develop into dendritic cells with interleukin (IL)-3 and CD40-ligand. J Exp Med. 1997;185:1101–11. doi: 10.1084/jem.185.6.1101. [DOI] [PMC free article] [PubMed] [Google Scholar]
- 55.Meyaard L. The inhibitory collagen receptor LAIR-1 (CD305) J Leukoc Biol. 2008;83:799–803. doi: 10.1189/jlb.0907609. [DOI] [PubMed] [Google Scholar]
- 56.Donaghy H, Bosnjak L, Harman AN, et al. Role for plasmacytoid dendritic cells in the immune control of recurrent human herpes simplex virus infection. J Virol. 2009;83:1952–61. doi: 10.1128/JVI.01578-08. [DOI] [PMC free article] [PubMed] [Google Scholar]
- 57.Lund J, Sato A, Akira S, Medzhitov R, Iwasaki A. Toll-like receptor 9-mediated recognition of herpes simplex virus-2 by plasmacytoid dendritic cells. J Exp Med. 2003;198:513–20. doi: 10.1084/jem.20030162. [DOI] [PMC free article] [PubMed] [Google Scholar]
- 58.Latz E, Schoenemeyer A, Visintin A, et al. TLR9 signals after translocating from the ER to CpG DNA in the lysosome. Nat Immunol. 2004;5:190–8. doi: 10.1038/ni1028. [DOI] [PubMed] [Google Scholar]
- 59.Varani S, Cederarv M, Feld S, et al. Human cytomegalovirus differentially controls B cell and T cell responses through effects on plasmacytoid dendritic cells. J Immunol. 2007;179:7767–76. doi: 10.4049/jimmunol.179.11.7767. [DOI] [PubMed] [Google Scholar]
- 60.Prechtel AT, Turza NM, Kobelt DJ, et al. Infection of mature dendritic cells with herpes simplex virus type 1 dramatically reduces lymphoid chemokine-mediated migration. J Gen Virol. 2005;86:1645–57. doi: 10.1099/vir.0.80852-0. [DOI] [PubMed] [Google Scholar]