Abstract
Phase correction has the potential to increase the image quality of 3-D ultrasound, especially transcranial ultrasound. We implemented and compared 2 algorithms for aberration correction, multi-lag cross-correlation and speckle brightness, using static and moving targets. We corrected three 75-ns rms electronic aberrators with full-width at half-maximum (FWHM) auto-correlation lengths of 1.35, 2.7, and 5.4 mm. Cross-correlation proved the better algorithm at 2.7 and 5.4 mm correlation lengths (P < 0.05). Static cross-correlation performed better than moving-target cross-correlation at the 2.7 mm correlation length (P < 0.05). Finally, we compared the static and moving-target cross-correlation on a flow phantom with a skull casting aberrator. Using signal from static targets, the correction resulted in an average contrast increase of 22.2%, compared with 13.2% using signal from moving targets. The contrast-to-noise ratio (CNR) increased by 20.5% and 12.8% using static and moving targets, respectively. Doppler signal strength increased by 5.6% and 4.9% for the static and moving-targets methods, respectively.
I. INTRODUCTION
With reliable transpulmonary ultrasound contrast agents enabling a renaissance in transcranial ultrasound, there have been recent investigations into using phase aberration correction to improve the image quality of such scans. The typical examination includes the use of a phased-array scanner, operating at approximately 2 MHz, applied to the temporal and sub-occipital acoustic windows, combined with the administration of contrast agents and examination of blood vessels with color, power, and spectral Doppler [1], [2]. contrast-enhanced examination has shown advantages over traditional ultrasound in assessing ischemic cerebrovascular disease by visualizing intracranial arteries and collateral circulation [3]–[5], and in the vascularization of tumors [3], and has also made possible perfusion imaging of the brain [6].
Of course the skull bone, with its substantial attenuation and thickness variations, remains a formidable barrier to the improvement of transcranial ultrasound. Fortunately, the skull in the temporal acoustic window is thin, 2 to 3 mm thick [7], and is composed of compact ivory bone, relatively free of internal scatterers, with an attenuation of 2.8 dB cm−1 MHz−1, compared with 25 to 70 dB cm−1 MHz−1 in cancellous bone [8]. Therefore, one must examine the variations in skull thickness over the acoustic windows as a primary source of image degradation. Because of the difference in the speed of sound in skull, cS = 2650 m/s [9], and brain, cB = 1530 m/s [10], these variations, Δz(x,y), over the transducer, operating at a center frequency, f0, lead to phase aberrations, Δφ,
| (1) |
These phase aberrations broaden the ultrasound beam, degrading spatial resolution and reducing the contrast and sensitivity of transcranial ultrasound.
Aberrators in general can be modeled as either being distributed throughout the media, or as being a thin layer near the transducer that disturbs only phase, the so-called, near-field phase-screen model [11]. Measured aberrators are then characterized by their rms amplitude in nanoseconds, and their full-width at half-maximum (FWHM) autocorrelation length in mm. It is imperative to adequately spatially sample the aberrator. In the breast, for example, measurements have shown correlation lengths, and thus spatial periods, from 2 to 8 mm [12]. Whereas most 1-D transducers may meet this criterion in the azimuth dimension, they fall far from it in the elevation dimension, with typical element sizes of 1 cm [13] to 2.5 cm [14]. Research has suggested that an elevation pitch of at most 75%, and perhaps as fine as 25 to 30%, of the correlation length might be needed for effective aberration measurements [15], [16]. With a 2-D matrix array, however, equal sampling can be achieved in the azimuth and elevation directions.
Although there are many methods and models for estimating and correcting aberrations, we believe our case to be best suited to the near-field phase-screen model, as the skull in this region is thin and located at the face of the transducer. The multi-lag least-squares cross-correlation algorithm [11], [12], [17] has been used to correct aberrators in the breast and thyroid [13], [18] on 1-D and 1.75-D arrays, and we have previously expanded these results to 2-D matrix arrays [19]. We also wish to capitalize on the parallel-receive processing of our real-time 3-D (RT3D) scanner and implement the temporally-parallel partial-array reference algorithm [20], [21]. In this study, we compare these algorithms for electronic aberrators. other methods that have been explored for transcranial phase aberration correction include using time-reversal mirrors on a point source or an induced cavitation bubble [22], MRI and CT guidance for ultrasonic therapy and imaging [23], and shear-mode conversion, which lessens the effect of the aberration, because of a relative match in the shear-wave speed of sound in skull, cSS = 1400 m/s, and the longitudinal-wave speed in brain, cB = 1530 m/s [24]. Methods applicable to distributed aberrators include time-reversal mirrors [22], generalized coherence factor maximization [25], and the reference waveform method for phase-screens at a distance from the transducer [17].
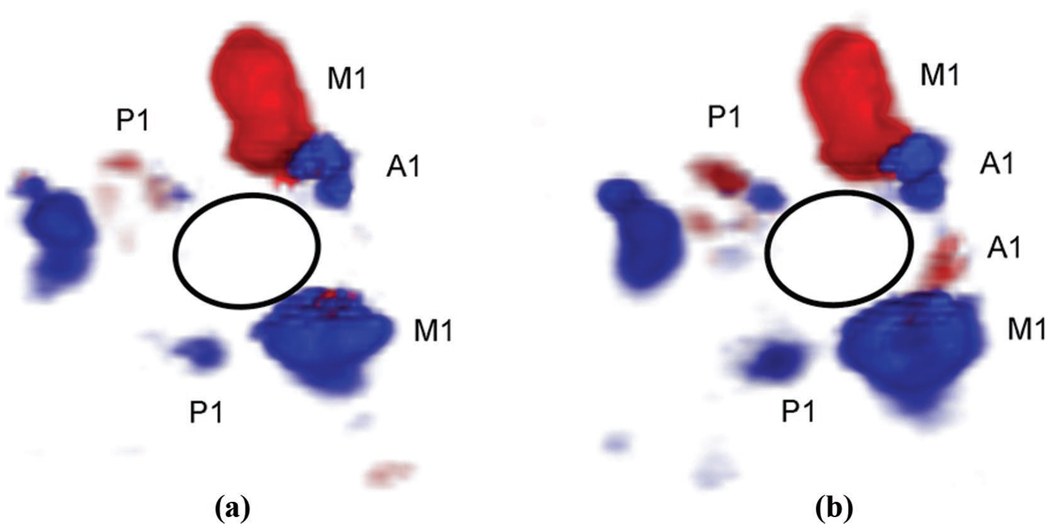
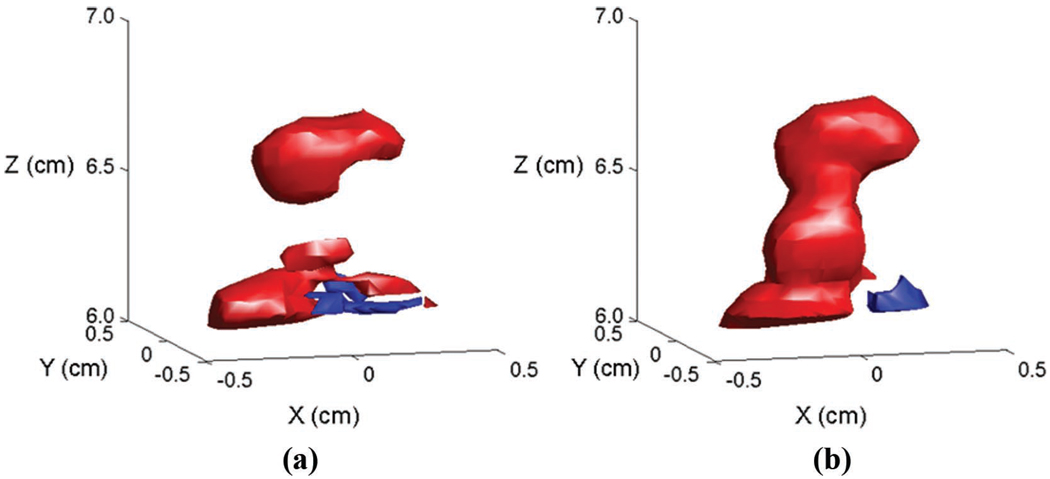
Our group has had a long-standing interest in both RT3D and adaptive imaging for transcranial ultrasound. To our knowledge, in 1978, we described the first real-time B-scan of the brain [26], as well as the first RT3D transcranial scan, in 2004 [27]. We then investigated adaptive signal processing techniques to correct for a planar layer of skull bone [28], and in general for a 3-D ultrasound scanner [19]. In 2008, we described the first contrast-enhanced real-time 3-D transcranial scans and first in vivo skull aberration correction for transcranial imaging which showed a 10% increase in Doppler strength and one vessel, the contralateral anterior cerebral artery, not present in the aberrated scan, as shown in Fig. 1 [29].
Fig. 1.
In vivo phase aberration correction: aberrated (a) and corrected (b) 3-D Doppler volume renderings of the circle of Willis, composed of ipsilateral and contralateral middle cerebral arteries (M1), posterior cerebral arteries (P1), and anterior cerebral arteries (A1). The corrected volume shows an increase in number of Doppler strength of 10% as well as the presence of the contralateral A1 not present in the aberrated volume.
In this study, we used electronic aberrators to compare the performance of the multi-lag least-squares cross-correlation method to the partial-array reference speckle brightness method for aberration correction on static and moving targets on an RT3D ultrasound scanner developed by Duke University and Volumetrics Medical Imaging (VMI, Durham, NC) [30], [31]. A previous theoretical comparison of single-element pair cross-correlation [11] and various speckle brightness methods has been performed by Ng et al. [32] for 2-D ultrasound. We used the best-performing algorithm to correct for physical aberrators on static and moving targets.
II. METHODS
A. Volumetrics Scanner System and Transducer
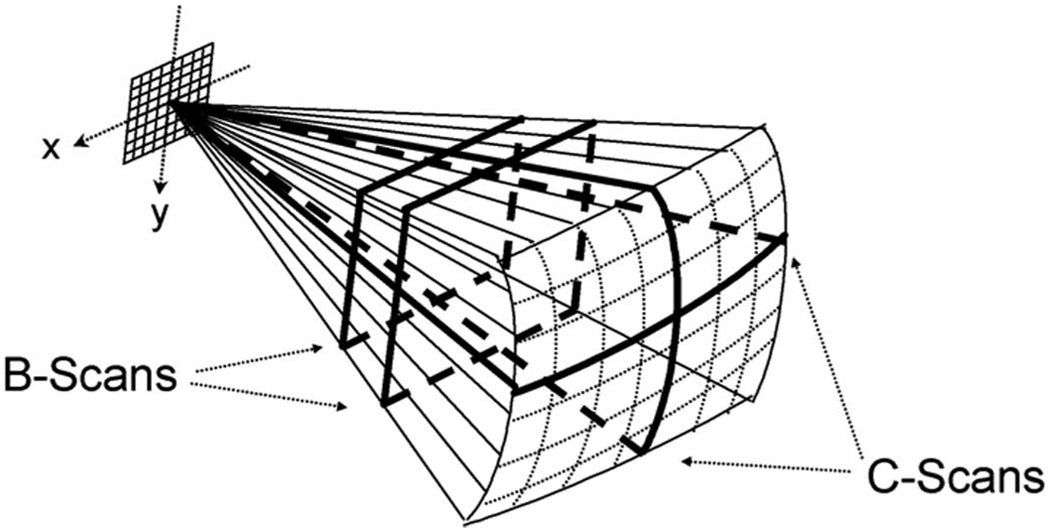
The commercial Duke/VMI ultrasound system scans an RT3D pyramidal volume of 65° to 120° using up to 512 transmit and 256 receive elements [30], [31]. Using 16:1 parallel receive processing, the scanner generates 4096 B-mode image lines from 256 transmits at up to 30 volumes per second. A schematic of the matrix phased-array transducer producing the pyramidal scan and displaying 2 simultaneous orthogonal B-scans (perpendicular to the transducer array) and 2 C-scans (parallel to the array) is shown in Fig. 2. During the scanning operation and playback, planes may be positioned at any desired angle and depth in the pyramid. The system also displays RT3D rendered images, as well as RT3D color flow Doppler and 3-D steerable spectral Doppler.
Fig. 2.
The Volumetrics scanner uses a 2-D matrix array to image a 65° × 65° pyramidal volume and can simultaneously display 2 orthogonal B-scans and 2 oblique C-scans.
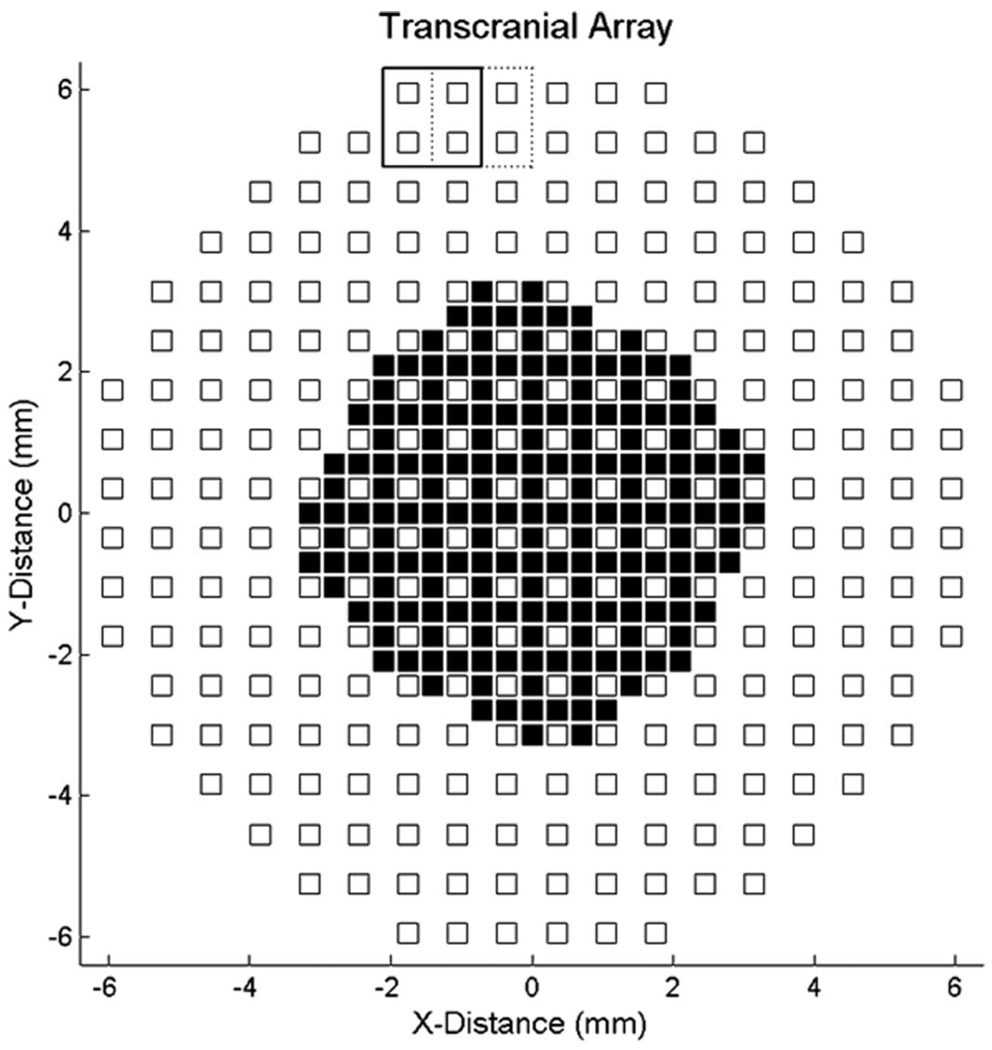
The transcranial transducer used in this study consisted of a sparse 2-D array operating at a center frequency of 2.5 MHz with –6 dB fractional bandwidth = 30%, described previously by Light et al. [33]. The active elements of the array, shown in Fig. 3, include 256 shared transmit and receive elements and 184 transmit-only elements, with a minimum interelement spacing of 0.35 mm and total aperture diameter of 13 mm.
Fig. 3.
Transducer layout: the periodic array has 440 active elements. All elements transmit; the 256 white square elements are shared transmit-receive and the black square elements are transmit-only. Solid and dashed boxes show successive positions of the aperture for RF acquisition.
B. Static Multi-Lag Cross-Correlation
In 2006, we described implementing the static multi-lag least-squares cross-correlation method for 3-D phase aberration correction [19]. To recap, we transmit a line down the center of the 3-D scan, focused at 4 or 5 cm, while receiving on one 2 × 2 element cluster and acquiring the analog RF output from the beamformer. With each transmit line, the cluster is stepped across the receive aperture, as illustrated by the solid and dashed boxes in Fig 3. This results in 221 RF data lines sampled at 0.7-mm spacing on the transducer face. The RF signals are amplified using a Panametrics 5073PR pulser/receiver (Waltham, MA). The signal is then recorded using a Signatec PDA12 waveform digitizer (Corona, CA) installed in a PC. The digitizer acquires an 8-mm long echo centered about the focus and sampled at 25 MHz. We acquire 15 frames of data, which we average to increase the SNR. The data are then dynamically focused and band-pass filtered using custom-written C programs.
The focused RF is then used to estimate the aberration profile. In the multi-lag cross-correlation method, time delays are estimated between neighboring clusters by finding the peak of the normalized cross-correlation of the RF signals. In our case, we used the clusters with an expected correlation of greater than 85% (4 in elevation, 4 in azimuth, and 4 on the diagonals), as determined for our array by the van Cittert-Zernicke (VCZ) theorem [19], [34], [35]. Including more correlations increases computation time, and becomes less valuable as jitter increases with decreasing expected correlation via VCZ. This yields an over-determined system of equations, solved by using the equation
| (2) |
where D is a vector composed of the differential time-shift between clusters, M is the 1178 × 221 model matrix, specifying how the arrival times are related to the time estimates between cluster pairs, and T is the phase aberration profile. The phase profile is then detrended to remove the planar component, and interpolated to the locations of all transmit and receive elements. The delays are then converted into system clock cycles (25-ns increments) and sent back to the scanner as a UDP datagram over an Ethernet connection. This process can be iterated, by acquiring new RF with the corrected transmit delays, improving the estimation of the aberrator; in this study we performed 2 corrections. The scanner, upon receiving the last set of shifts, updates the 10 million delays (256 elements × 4096 lines × 10 receive focal zones), which takes 18 s. once the delays are updated, the system resumes scanning. The entire process takes roughly 22 s; to perform each additional iteration adds roughly 2 s. We acquire one set of RF data immediately before and after the delay updates. Based on the correlation of the RF preand post-update, we can verify if there was motion leading to an unsuccessful correction.
C. Moving-Target Multi-Lag Cross-Correlation
In 2006, we implemented the moving-target multi-lag least-squares cross-correlation method, described by Zhao et al. [36], [37], for 3-D ultrasound [38]. Using signals from moving targets for aberration correction is appealing because it removes echoes from reverberations, from bright targets outside the area of interest, and because it could be used in conjunction with contrast-enhanced harmonic imaging studies. We used a single-delay-line filter, i.e., subtracted pairs of frames, to isolate echoes from moving targets. The process is then modified from that previously described to acquire and perform correlation on simultaneously acquired RF lines.
To effectively filter the moving-target RF, the echoes from the moving targets must be decorrelated between acquisitions. In our implementation, acquisitions are done one frame apart, thus more than 53 ms passes between acquisitions (53 ms = (256 B-mode lines + 16 RF acquisition lines) × 15 cm/7.7 × 104 cm/s). Using the results for the spatial correlation of complex signals from Walker and Trahey [39], the spatial correlation between lines, ρx, acquired at an interval of τ seconds, when transmitting on a rectangular array with width w and receiving on a very small sub-array is
| (3) |
where z is the depth and λ is the wavelength. For typical velocities in the middle cerebral arteries, 55 ± 12 cm/s [40], the correlation is less than 10%. For axial velocities, υz, the RF decorrelates more quickly, following
| (4) |
where σ is the standard deviation of the axial pulse envelope, f is the frequency, and c is the speed of sound. Again, for τ greater than one frame, the signals are less than 10% correlated.
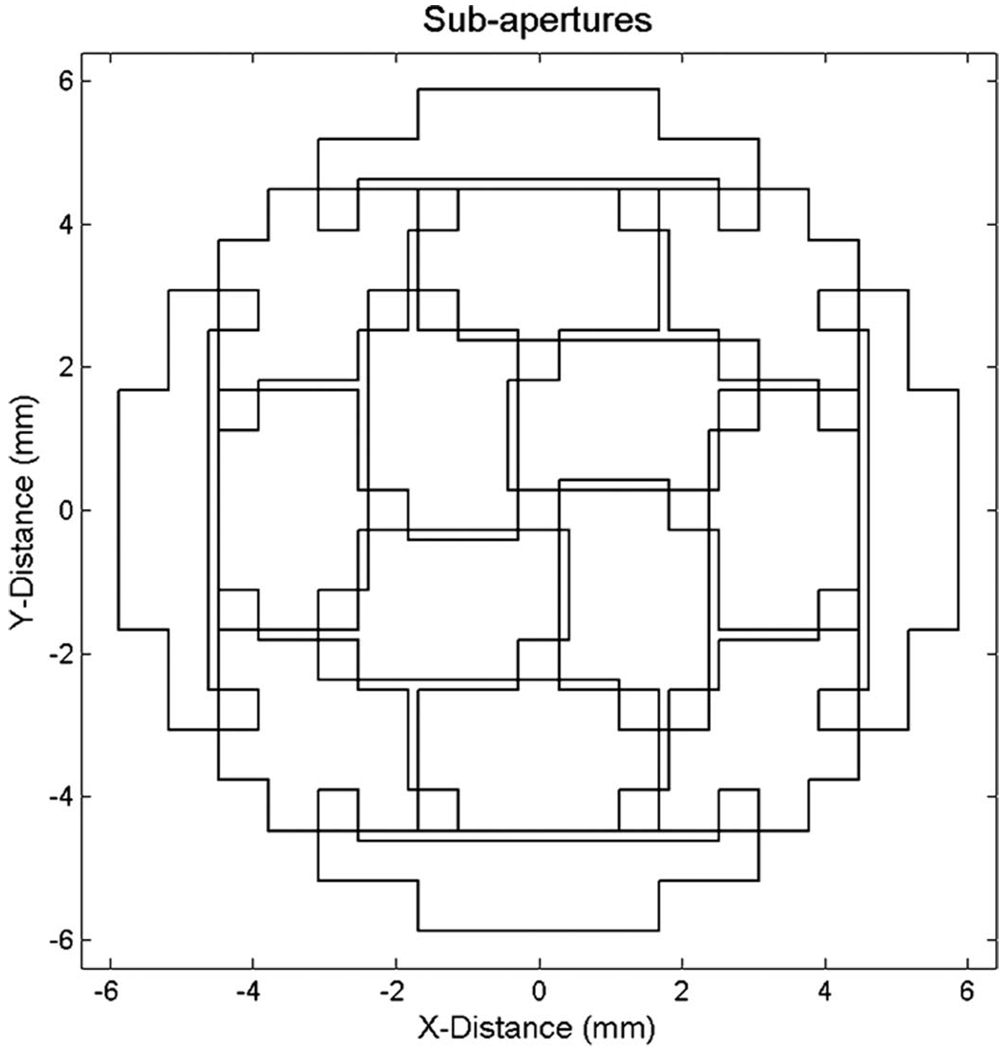
Because the system is only capable of outputting 1 RF signal per line via the BNC connection, we had to modify the procedure; to use cross-correlation, it is necessary to have simultaneous RF lines, else motion cannot be distinguished from aberration. To accomplish this, we split the receive aperture into 16 partially overlapping sub-apertures, shown in Fig. 4, made up of 16 2 × 2 element clusters. On each transmit, the scanner saves a 1-cm long signal from one sub-aperture, focused at either 4 or 5 cm, with each of the 16 clusters routed to a different parallel receive line. Over the course of 16 transmits, we collected data from the entire aperture (16 clusters × 16 sub-apertures − overlapping clusters = 221 element clusters). On the next frame, by which time the signals have decorrelated, the data are again saved. The 2 frames are then subtracted, to leave only the moving targets. This data are then windowed, cropping signals below a set percentage of the maximum. For our experiments, the threshold was set at 25% for the electronic aberrator study, and 40% for the physical aberrator study. The data are then saved to the scanner’s hard-drive. The blood vessels are likely to be smaller than the 1-cm gate, though because data from each frame is uncorrelated, we can acquire multiple frames of data to increase the number of speckles in our correction. After windowing the data, we divide the length of the data by the axial resolution to compute the number of speckles. We then concatenate frames of RF data until more than 20 speckles’ worth of data are acquired; this corresponds to roughly the same number of speckles acquired in the static method above. The data in the Doppler memory is downsampled to 4 MHz, and thus to avoid aliasing, we transmit 4-cycle pulses at 1.6 MHz. Once 20 speckles are acquired, the digital RF is written to the hard-drive and transferred to the PC via UDP datagram. On the PC, the data are then upsampled to 16 MHz, dynamically focused, taking into account the concatenation above, and filtered using custom C programs.
Fig. 4.
Moving-target sub-apertures: on each transmit line, the system enables and receives echoes from a different sub-aperture composed of 16 element clusters. It takes 16 transmit pulses to receive echoes from the entire array.
The aberration estimation method was modified from previously described method to account for moving targets. First, we derived a model matrix for each of the sub-apertures, so that only simultaneous RF lines are correlated. By concatenating the model matrices from each sub-aperture and changing indices of the overlapping elements, we derived a complete 816 × 221 model matrix for the system, which we again solve using least-squares using (2). The phase profile is then detrended and interpolated to transmit and receive locations, converted into clock cycles, and sent back to the scanner via UDP. This process can be iterated as desired; in this study we corrected twice. The entire process takes roughly 25 s, and each additional iteration takes another 5 s.
D. Static Speckle Brightness
For the static speckle brightness method, we used the temporally parallel partial-reference array method described by Freiburger and Trahey [21] adapted for our 3-D scanner. In this method, maximizing speckle brightness over a sub-aperture of neighboring elements is used to estimate phase shifts. We transmitted on the entire aperture, focusing at 4 cm, while receiving on one 2 × 2 element cluster correction group and a reference array of 20 surrounding elements. These were the same as the elements used for the cross-correlation method. On the 16 parallel receive lines, the correction cluster is summed with a different phase, from −7 to +8 clock cycles (−175 ns to +200 ns) added to its normal phasing. Over the course of 221 lines, data are acquired for all clusters and their reference groups. We found that different parallel sums had slightly different gains, so we use the remaining 35 lines of each 256-line frame to get normalization factors. On each line, we had a different group of 24 elements enabled with no phase shift over the 16 sums. We averaged the results over the 35 lines and these were used to calculate normalizations, which we applied to all sums based on their parallel receive line; sums varied by ± 5%. The scanner then sums the B-mode data for each line over a 1-cm gate at the focus, squares it, and multiplies it by the corresponding normalization factor. The scanner then finds the phase shift that gives the maximum squared brightness value for each cluster to get the phase profile. The profile is then detrended and interpolated to the receive and transmit element locations. The scanner then updates the delays and iterates the process either twice, or until the average brightness does not increase. This process takes roughly 25 s, with an additional 2 s per iteration. Note that no off-line computer is required for this method: the normal beamsumming routines of the scanner are repurposed here for the phase correction process.
E. Moving-Target Speckle Brightness
The moving-target speckle brightness method followed much as the static method above, except that 2 frames of data were acquired. Again, one frame passes between acquisition, and signals are thus decorrelated. The resulting B-mode data are then subtracted, to remove static targets and reverberations, then squared and multiplied by the normalization factors, and the phase profile is computed in the same fashion as in the static method.
F. Electronic Aberrator Study
For the electronic aberrator study, we used a moving string phantom. It consists of a 5-mm diameter, 1-m long string on a pulley system inside of a water tank. Nine 75-ns rms electronic aberrators were compared: 3 realizations each at 1/2×, 1×, and 2× the FWHM correlation length measured in our successful in vivo correction, 2.7 mm [29]. We performed 2 iteration corrections on all 9 aberrators using the 4 different methods, keeping the string static for the static methods, and circulating it at 50 cm/s during the moving-target methods. We corrected each moving-target method aberrator twice, to lessen the impact of any inhomogeneities along the length of the string. We computed the residual error of the aberrators to determine which method performed best at each correlation length. Comparisons were made between algorithms at the same correlation length using one-way ANOVA, using Matlab (The Math Works Inc., Natick, MA), with P-values of less than 0.05 considered significant.
G. Physical Aberrator Study
For the physical aberrator study, we used the temporal bone region of a polymer skull-casting (3B Scientific, Hamburg, Germany) and an ATS Laboratories (Bridgeport, CT) model 523A Doppler phantom with a 4-mm vessel. Typical polymer sound speeds are from 2300 to 2700 m/s [41]. An aquarium pump circulated a 10-g/L suspension of corn starch, flowing at a constant rate of 50 cm/s, through the tubing. The rms strength of the echoes from the corn starch was 12 dB below the echoes from the tissue, approximately the same as in vivo application of contrast agents [42]. Corrections were performed on 6 locations on the skull aberrator using static multi-lag cross-correlation on a gate at 40 mm and using the moving-target multi-lag cross-correlation on the vessel, located at 50 mm. With the flow turned off, and the corn-starch settled to the bottom of the vessel, we acquired aberrated and corrected volumes to calculate contrast and CNR of the vessel lumen, as well as the overall image brightness. Aberrated and corrected 16 frame cine-volumes with flow were also acquired, to compare the strength of the Doppler signal.
To compute the image quality metrics, we first scan-converted the saved data, in an r-θ-φ, azimuth-elevation coordinate system, to Cartesian x-y-z coordinates. For the B-mode metrics, short-axis planes were displayed at x = −0.5 and 0.5 cm, and the center of the vessel was selected in each plane. Three 3.9-mm diameter cylinders were then defined, one, the anechoic vessel, between the 2 centers selected in the previous step, and 2 speckle cylinders, each ± 1 cm away in y and parallel to the vessel. The brightness, contrast, and CNR were then computed using the vessel and speckle cylinders. To compute the Doppler metric, we compared the average magnitude of the intersection of thresholded aberrated and corrected volumes.
III. RESULTS
A. Electronic Aberrator Comparison
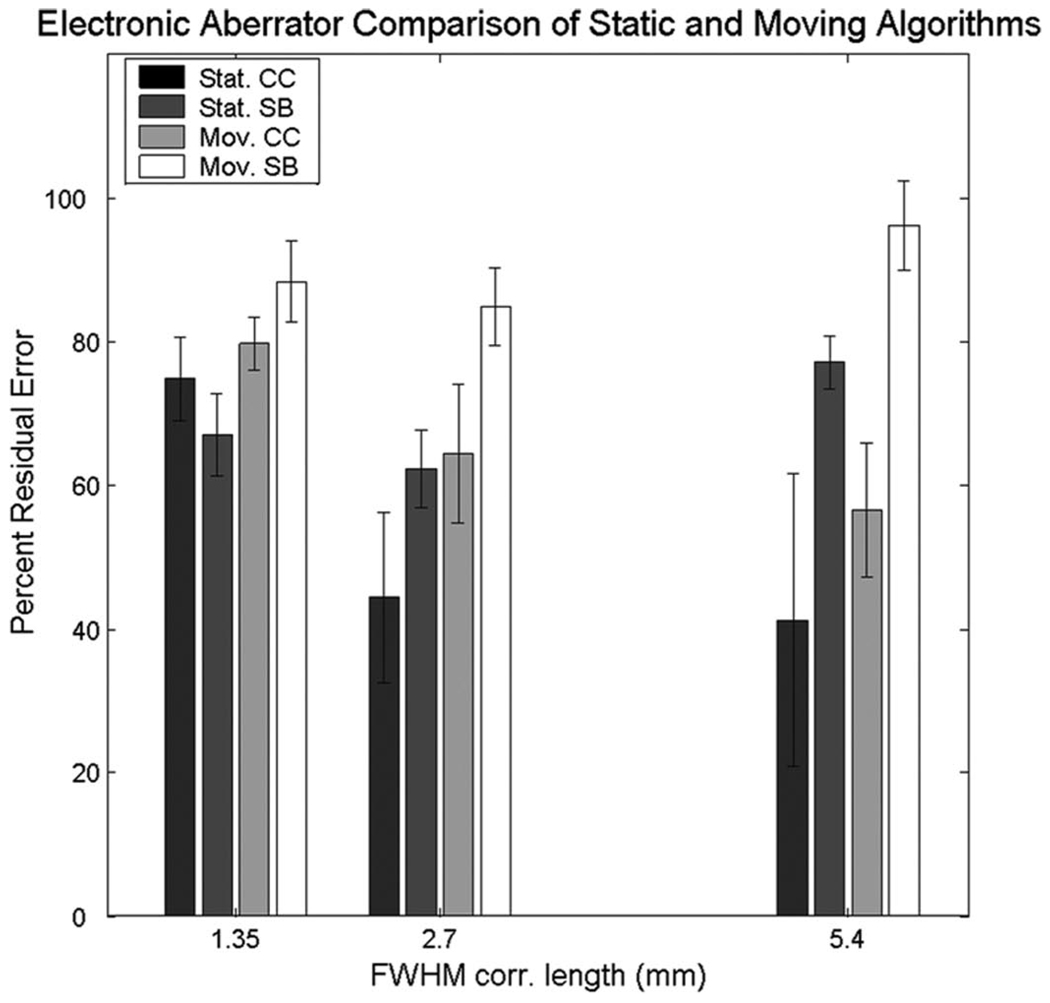
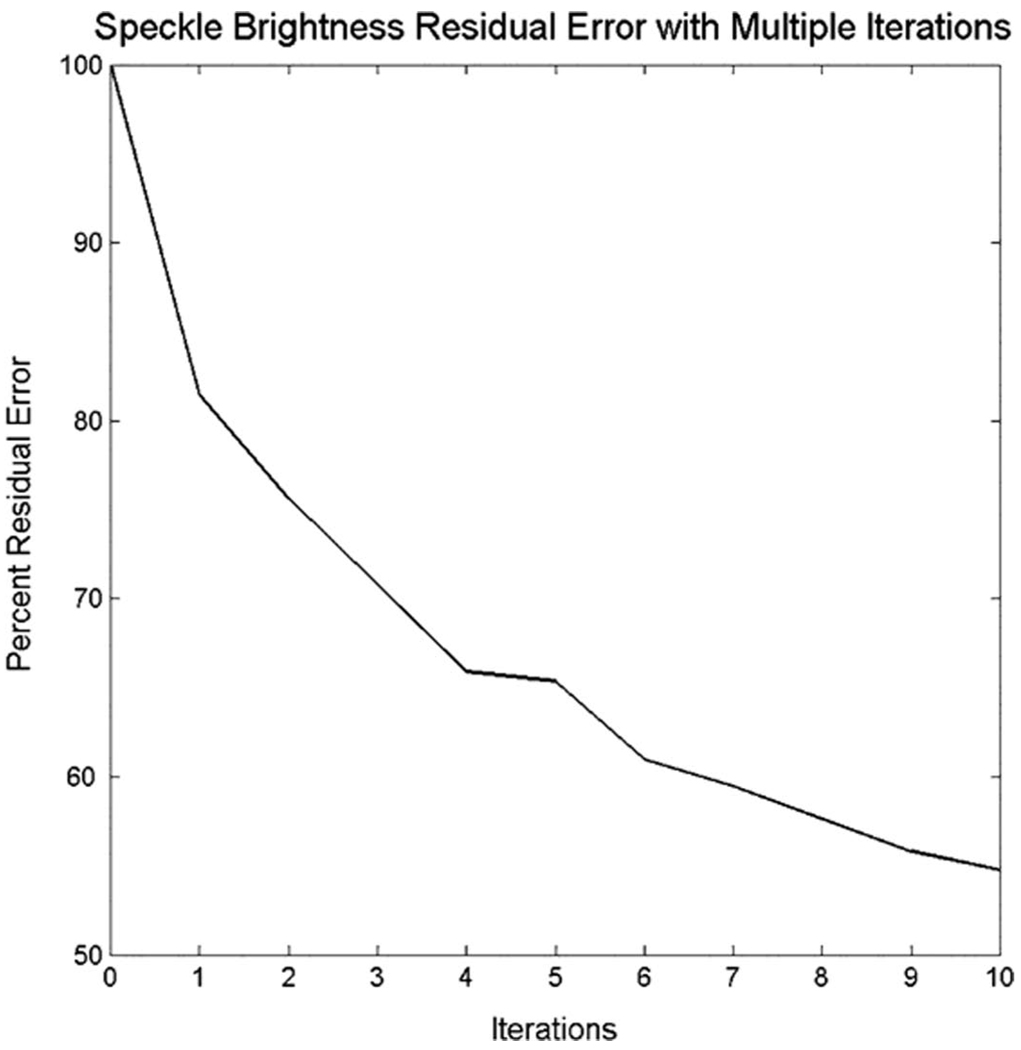
Fig. 5 shows the residual errors as a percentage of the applied aberration for the static and moving multi-lag cross-correlation and speckle brightness corrections. The bars are grouped according to the FWHM correlation length of the original aberrators—1.35, 2.7, and 5.4 mm. Both cross-correlation methods performed better than corresponding speckle brightness methods at the 2.7 and 5.4 mm correlation lengths (P < 0.05), and there were no statistically significant differences between algorithms with the highest spatial frequency aberrators. The static cross-correlation method did perform better than moving-target cross-correlation at the 2.7 mm correlation length (P < 0.05). Due to the poor performance of the speckle brightness methods, in a separate experiment, we verified that the static speckle brightness method would converge as the number of iterations went up. We applied a 75-ns rms, 3.3-mm correlation length electronic aberrator and corrected 10 times. In Fig. 6, we show that as we iterated the process, the residual error did go down, albeit slowly. After 10 iterations, only 55% of the aberrator has been corrected; for comparison, in Fig. 5, we see that cross-correlation corrects that amount in 2 iterations. Each iteration adds 2 s to the process, and 10 iterations would thus double the amount of time necessary to correct. For the comparison, the number of iterations was kept constant at 2. Static methods always performed better than their moving-target versions, though the difference was not statistically significant except at 2.7 mm. We would expect this result, as explained by examining the Cramer-Rao lower bound for the systems, which defines the jitter, τ, in a time-shift estimator,
| (5) |
where f0 is the center frequency, B is the bandwidth, ρ is the correlation between lines, and SNR is the signal-to-noise ratio [43]. The moving-target methods have lower SNR, because subtracting the signals lowers SNR. As noted previously, the moving-target cross-correlation method also has a lower center frequency to avoid aliasing, and is not averaged, unlike the static cross-correlation method, which is averaged over 15 frames, giving a 3.8× increase in SNR. This poorer performance is, of course, in the absence of any reverberations or bright off-axis targets, which could render the static methods less effective in vivo. From the results, we determined that the static and moving-target multi-lag cross-correlation methods would be a better choice for our remaining experiments and for future in vivo work.
Fig. 5.
Static and moving cross-correlation (CC) and speckle brightness (SB): the 2 algorithms were performed on static and moving-targets on 3 different 75-ns rms electronic aberrators at 3 different FWHM correlation lengths—1.35, 2.7, and 5.4 mm. The residual errors are plotted as a percentage of applied aberrator strength. Note: groups of 4 bars had constant FWHM correlation lengths; they are shown next to one another for clarity.
Fig. 6.
Effect of multiple static speckle brightness iterations. On an electronic aberrator (rms strength 75 ns, FWHM correlation length 3.3 mm), as the number of iterations increases, the error decreases, though each iteration requires 2 additional seconds.
Note that the 18+ seconds required for correction is not a limit of 3-D phase correction itself, rather of our particular system. As previously mentioned, the scanner requires 10 million delays to scan a volume; and the bus and processing speeds, 20 MB/s and 100 MHz, respectively, are the limiting factors. Were it not for this, our speeds would approach those of McAleavey et al. [44] of 1.4 s and of Rigby et al. [14] of 350 ms. In these circumstances, revisiting speckle brightness could be appealing, as the time per iteration would decrease, and eliminating the offline computer might outweigh a sacrifice in correction speed.
B. Physical Aberrator Study
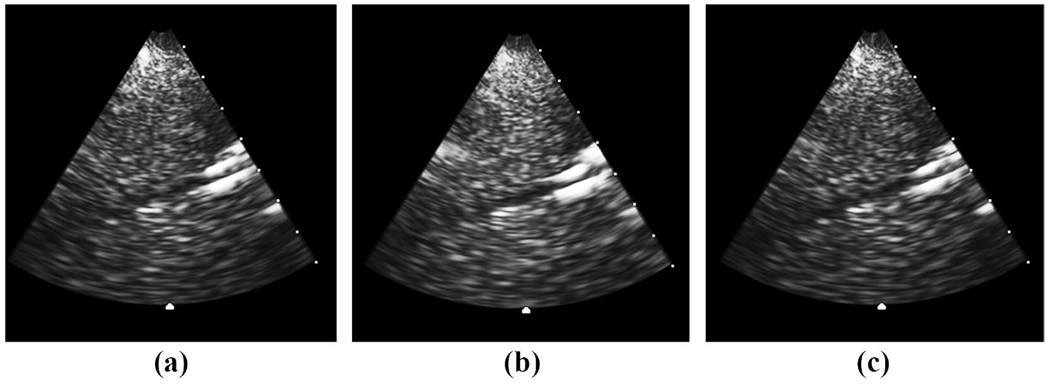
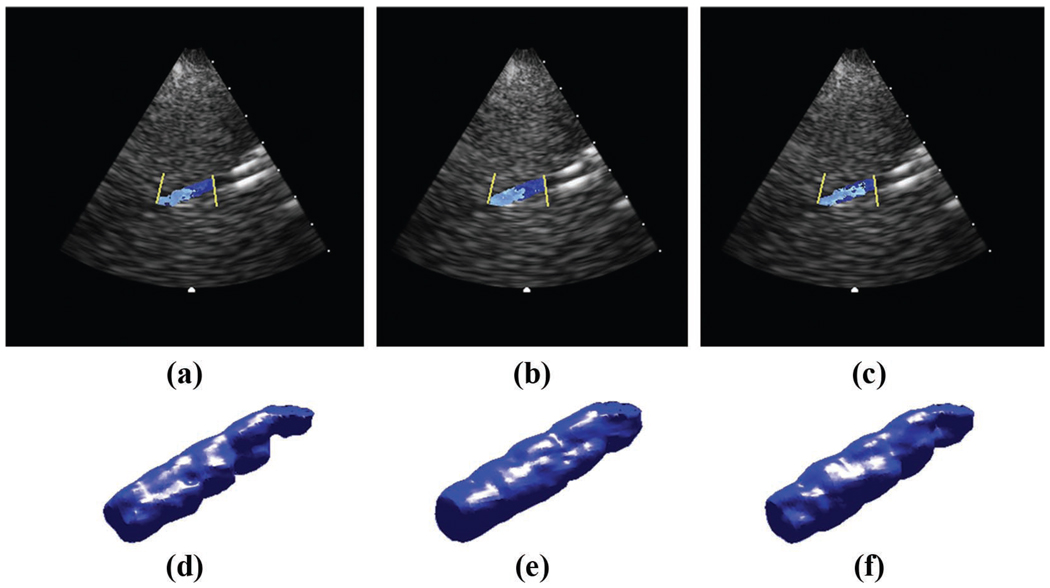
The results for the physical aberrator study are shown in Table I. For all metrics of improvement, the static correction performed better than the moving-target correction, by roughly a factor of 1.5. on average, the static correction improved the brightness by 6.6%, the contrast by 22.2%, and the CNR by 20.5%. The moving-target correction improved the brightness by 4.0%, the contrast by 13.2%, and the CNR by 12.8%. The static correction also resulted in an increase in the Doppler magnitude of 5.6%. The moving-target correction resulted in an increase in magnitude of 4.9%. Fig. 7 shows an illustrative example of 3 B-mode long-axis images of the vessel aberrated (a), static cross-correlation corrected (b), and moving-target cross-correlation corrected (c). Contrast increased by 31% in the static and 30% in the moving-target correction. CNR increased by 19% in the static and 25% in the moving-target correction. Fig. 8 shows 3 long-axis color Doppler images and 3-D Doppler renderings of the same correction: the average Doppler strength increased by 20% in the static and 9% in the moving-target correction.
TABLE I.
Image quality and doppler improvements for physical aberrator.
| Aberrator strength (ns) |
Correlation length (mm) |
Brightness | Contrast | Contrast-to-noise ratio |
Doppler magnitude |
|
|---|---|---|---|---|---|---|
| Static | 35.9 | 2.9 | 6.6% ± 1.9% | 22.2% ± 8.3% | 20.5% ± 11.1% | 5.6% ± 3.2% |
| Moving-target | 32.5 | 2.5 | 4.0% ± 1.2% | 13.2% ± 8.7% | 12.8% ± 9.3% | 4.9% ± 1.5% |
Fig. 7.
Physical aberrator results. Aberrated (a), static corrected (b), and moving-target corrected (c) long-axis B-scans of vessel without flow. Contrast increased by 31% in the static and 30% in the moving. Contrast-to-noise ratio increased by 19% in the static and 25% in the moving.
Fig. 8.
Physical aberrator flow results. Aberrated (a,d), static corrected (b,e), and moving-target corrected (c,f) color Doppler B-scans and Doppler volume renderings of vessel with flow. The average Doppler strength increased by 20% in the static and 9% in the moving.
IV. DISCUSSION
We showed in this paper the superior performance and convergence of the multi-lag cross-correlation algorithm for phase aberration correction. Although a theoretical comparison showed that both methods are maximizing the same quantity [32], we believe the difference lies in the least-squares approach, which ensures phase closure of the profile. In the partial reference array algorithm, if the reference array size is not larger than the correlation length of the aberrator, the mean phase shift over the reference array is not guaranteed to be 0, and thus estimates based on the relative shift between a cluster and the reference array are biased. Varying the size of the reference array would help ensure no bias, though at the cost of accuracy, as the entire reference array suffers in performance because of lower correlations between signals far away on the array [21]. With more in vivo measurements of the typical aberrator correlation lengths, we could use this information to determine the optimal reference array size. However, until we have such information, the multi-lag least-squares method remains preferred. Using a speckle look-back implementation [32] would also improve the performance of the speckle brightness method, though implementation of the algorithm on our system was not feasible.
While we have previously performed one successful in vivo correction [29], several obstacles must be overcome to have a consistent and useful clinically relevant high-speed phase aberration correction system. The current method takes 18 s to update the delays for the entire pyramidal volume. In order for the phase correction to be valid, the transducer must not move during this time. We are currently using a custom-built acrylic transducer holder interfaced with a commercial Spencer Technologies Marc600 transcranial transducer fixation system (Seattle, WA) to limit motion. Any motion of the transducer or of the tissue would be detected by the decorrelation of the preand post-correction RF. While the holder we have gives us translation and rotation in the para-saggital plane, we wish to fashion a holder that allows us a full 6 degrees of motion.
Based on the results of this comparative phase correction study, in an institutional review board-approved clinical trial, we performed one more in vivo static cross-correlation phase correction using the method detailed in this paper and in Ivancevich et al. [29]. The aberration profile was measured down the center of the scan, and the delays were updated. The results are shown in Fig. 9. In the 9° × 9° region down the center of the scan, we measured a 5.1% increase in Doppler signal. We see that in the corrected scan, the integrity of the terminal internal carotid artery is restored.
Fig. 9.
In vivo (a) uncorrected and (b) static cross-correlation corrected 3-D Doppler renderings. In the 9° × 9° region down the center of the scan, correcting the scan resulted in an increase of Doppler strength of 5.1%, and the restoration of the terminal internal carotid artery.
While the near-field phase-screen aberration model assumes an infinitesimally thin aberrator at the face of the transducer, our aberrator does indeed have a thickness. This means that an aberration profile measurement will only be valid over a certain angular region, the so-called isoplanatic patch. Recent research showed a mean ex vivo patch of ± 18° and an in vivo patch of ± 11.5° [45] measured with 2-D ultrasound. In the future, we would like to measure the isoplanatic patch in vivo with our 3-D system. To correct an entire scan, a smaller patch would require that we acquire RF from multiple angles and correct the scan using different delay profiles over different angular regions, lengthening the process. Alternatively, we could only correct over the Doppler gates of the scan, commen-surately decreasing the time necessary for correction.
For the moving-target cross-correlation method, we are limited with respect to frequency by the down-sampling of the Doppler data to 4 MHz, allowing us to only transmit narrow-bandwidth pulses at 1.6 MHz, though possible means to improve performance include acquiring more than 20 speckles—increasing our window—and using a more sensitive motion filter, like a double-delay-line canceller, though these would increase the time necessary for acquisition. We plan on investigating these further.
V. CONCLUSION
In this paper, we have successfully implemented 4 phase aberration correction methods for a real-time 3-D ultrasound scanner and have shown that multi-lag least-squares cross-correlation outperforms partial-array reference speckle brightness for our implementation. The effect was more pronounced for aberrators with a longer FWHM auto-correlation length. Additionally, corrections using echoes from static targets performed better than those using moving targets. In the physical aberrator, improvement metrics were 52% higher with static cross-correlation than in moving-target cross-correlation for our implementation. That is not to say, however, that the moving-target methods are obsolete; there is a good likelihood that reverberations in the skull, present because of the large impedance mismatch of skull and tissue, or bright bony targets outside the region of interest could corrupt corrections. Moving-target methods would also be necessary for contrast-enhanced harmonic imaging, and additionally the effect of aberration would be diminished in transmit. We found that using static cross-correlation to correct for a physical aberrator resulted in an average increases of brightness by 6.6%, contrast by 22%, and CNR by 21%, while the magnitude of the Doppler signals increased by 5.6%. Using the moving-target cross-correlation method, the brightness increased by 4.0%, contrast by 13%, and CNR by 13%, while Doppler magnitude increased by 5.6%. We believe these improvements will translate to increased image quality and diagnostic ability for transcranial ultrasound, and intend to verify our results in further in vivo studies.
Biographies

Nikolas M. Ivancevich was born in Evanston, IL, in 1981. He received the B.A. degree in physics from Wabash College, Crawfordsville, IN, in 2003. He received the Ph.D. degree in biomedical engineering from Duke University, Durham, NC, in 2009. He is currently a post-doctoral researcher at the University of Cincinnati. He is conducting research in adaptive phase correction and ultrasound-enhanced thrombolysis for transcranial ultrasound.

Jeremy J. Dahl was born in Ontonagon, Michigan, in 1976. He received the B.S. degree in electrical engineering from the University of Cincinnati, Cincinnati, OH, in 1999. He received the Ph.D. degree in biomedical engineering from Duke University in 2004. He is currently an Assistant Research Professor with the Department of Bio-medical Engineering at Duke University. He is currently researching adaptive ultrasonic imaging systems and radiation force imaging methods.

Stephen W. Smith (M’91) was born in Covington, KY, on July 27, 1947. He received the B.A. degree in physics (summa cum laude) in 1967 from Thomas More College, Ft. Mitchell, KY, the M.S. degree in physics in 1969 from Iowa State University, Ames, and the Ph.D. degree in bio-medical engineering in 1975 from Duke University, Durham, NC.
In 1969, he became a Commissioned Officer in the U.S. Public Health Service, assigned to the Food and Drug Administration, Center for Devices and Radiological Health, Rockville, MD, where he worked until 1990 in the study of medical imaging, particularly diagnostic ultrasound and in the development of performance standards for such equipment. In 1978, he became an adjunct associate professor of radiology at Duke University Medical Center. In 1990, he became an associate professor of biomedical engineering and radiology, and Director of Undergraduate Studies in Biomedical Engineering at Duke University. He holds 16 patents in medical ultrasound and has authored more than 100 publications in the field.
Dr. Smith is cofounder of Volumetrics Medical Imaging. He has served on the education committee of the American Institute of Ultrasound in Medicine, the executive board of the American Registry of Diagnostic Medical Sonographers, the editorial board of Ultrasonic Imaging, and the Technical Program Committee of IEEE-UFFC. He was co-recipient of the American Institute of Ultrasound in Medicine Matzuk Award in 1988 and 1990 and co-recipient of the IEEE-UFFC Outstanding Paper Award in 1983 and 1994.
REFERENCES
- 1.Gahn G, von Kummer R. Ultrasound in acute stroke: A review. Neuroradiology. 2001 Sep.vol. 43:702–711. doi: 10.1007/s002340100613. [DOI] [PubMed] [Google Scholar]
- 2.Bogdahn U, Becker G, Schlachetzki F. Echoenhancers and Transcranial Color Duplex Sonography. Boston: Blackwell Science; 1998. [Google Scholar]
- 3.Bogdahn U, Becker G, Schlief R, Reddig J, Hassel W. Contrast-enhanced transcranial color-coded real-time sonography: Results of a phase-two study. Stroke. 1993;vol. 24:676–684. doi: 10.1161/01.str.24.5.676. [DOI] [PubMed] [Google Scholar]
- 4.Otis S, Rush M, Boyajian R. Contrast-enhanced transcranial imaging. Stroke. 1995;vol. 26:203–209. doi: 10.1161/01.str.26.2.203. [DOI] [PubMed] [Google Scholar]
- 5.Baumgartner RW, Marcel A, Gönner F, Staikow I, Herrmann C, Rivoir A, Müri RM. Contrast-enhanced transcranial color-coded duplex sonography in ischemic cerebrovascular disease. Stroke. 1997;vol. 28:2473–2478. doi: 10.1161/01.str.28.12.2473. [DOI] [PubMed] [Google Scholar]
- 6.Wiesmann M, Seidel G. Ultrasound perfusion imaging of the human brain. Stroke. 2007;vol. 31:2421–2425. doi: 10.1161/01.str.31.10.2421. [DOI] [PubMed] [Google Scholar]
- 7.Furuhata H. Historical development of transcranial color-coded tomography. In: Bogdahn U, editor. Echoenhancers and Transcranial Color Duplex Sonography. Berlin: Blackwell; 1998. pp. 3–15. [Google Scholar]
- 8.White DN, Stevenson RJ. The acoustic characteristics of the skull. Ultrasound Med. Biol. 1978;vol. 4:225–252. doi: 10.1016/0301-5629(78)90054-6. [DOI] [PubMed] [Google Scholar]
- 9.Fry FJ, Barger JE. Acoustic properties of the human skull. J. Acoust Soc. Am. 1978;vol. 63:1576–1590. doi: 10.1121/1.381852. [DOI] [PubMed] [Google Scholar]
- 10.Goss SA, Johnston RL, Dunn F. Comprehensive compilation of empirical ultrasonic properties of mammalian tissues. J. Acoust. Soc. Am. 1978 Aug.vol. 64:423–457. doi: 10.1121/1.382016. [DOI] [PubMed] [Google Scholar]
- 11.Flax SW, O’Donnell M. Phase-aberration correction using signals from point reflectors and diffuse scatterers: Basic principles. IEEE Trans. Ultrason. Ferroelectr. Freq. Control. 1988;vol. 35:758–767. doi: 10.1109/58.9333. [DOI] [PubMed] [Google Scholar]
- 12.Gauss RC, Trahey G, Soo MS. Wavefront estimation in the human breast. Proc. SPIE. 2001;vol. 4325:172–181. [Google Scholar]
- 13.Dahl JJ, Soo MS, Trahey GE. Spatial and temporal aberrator stability for real-time adaptive imaging. IEEE Trans. Ultrason. Ferroelectr. Freq. Control. 2005 SEP.vol. 52:1504–1517. doi: 10.1109/tuffc.2005.1516023. [DOI] [PubMed] [Google Scholar]
- 14.Rigby KW, Chalek CL, Haider BH, Lewandowski RS, O’Donnell M, Smith LS, Wildes DG. Improved in vivo abdominal image quality using real-time estimation and correction of wavefront arrival time errors. Proc. IEEE Ultrasonics Symp.; San Juan. 2000. pp. 1645–1653. [Google Scholar]
- 15.Lacefield JC, Waag RC. Time-shift estimation and focusing through distributed aberration using multirow arrays. IEEE Trans. Ultrason. Ferroelectr. Freq. Control. 2001 Nov.vol. 48:1606–1624. doi: 10.1109/58.971712. [DOI] [PubMed] [Google Scholar]
- 16.Lacefield J, Waag R. Effect of transmit focus characteristics on estimates of aberration; Proc. IEEE Ultrasonics Symposium; 2000. pp. 1665–1668. [Google Scholar]
- 17.Liu DL, Waag RC. Correction of ultrasonic wavefront distortion using backpropagation and a reference waveform method for time-shift compensation. J. Acoust. Soc. Am. 1994;vol. 96:542–555. doi: 10.1121/1.410304. [DOI] [PubMed] [Google Scholar]
- 18.Fernandez A, Gammelmark K, Dahl J, Keen C, Gauss R, Trahey G. Synthetic elevation beamforming and image acquisition capabilities using an 8 × 128 1.75D array. IEEE Trans. Ultrason. Ferroelectr. Freq. Control. 2003 Jan.vol. 50:40–57. doi: 10.1109/tuffc.2003.1176524. [DOI] [PubMed] [Google Scholar]
- 19.Ivancevich NM, Dahl JJ, Trahey GE, Smith SW. Phase aberration correction with a real-time 3D ultrasound scanner: Feasibility study. IEEE Trans. Ultrason. Ferroelectr. Freq. Control. 2006;vol. 53:1432–1439. doi: 10.1109/tuffc.2006.1665100. [DOI] [PubMed] [Google Scholar]
- 20.Nock L, Trahey GE, Smith SW. Phase aberration correction in medical ultrasound using speckle brightness as a quality factor. J. Acoust. Soc. Am. 1989;vol. 85:1819–1833. doi: 10.1121/1.397889. [DOI] [PubMed] [Google Scholar]
- 21.Freiburger PD, Trahey GE. Parallel processing techniques for the speckle brightness phase aberration correction algorithm. IEEE Trans. Ultrason. Ferroelectr. Freq. Control. 1997 Mar.vol. 44:431–444. doi: 10.1109/58.585128. [DOI] [PubMed] [Google Scholar]
- 22.Fink M. Time reversal of ultrasonic fields—Part I: Basic principles. IEEE Trans. Ultrason. Ferroelectr. Freq. Control. 1992;vol. 39:555–566. doi: 10.1109/58.156174. [DOI] [PubMed] [Google Scholar]
- 23.Clement GT, Hynynen K. A non-invasive method for focusing ultrasound through the human skull. Phys. Med. Biol. 2002;vol. 47:1219–1236. doi: 10.1088/0031-9155/47/8/301. [DOI] [PubMed] [Google Scholar]
- 24.Clement GT, White PJ, Hynynen K. Enhanced ultrasound transmission through the human skull using shear mode conversion. J. Acoust. Soc. Am. 2003;vol. 115:1356–1364. doi: 10.1121/1.1645610. [DOI] [PubMed] [Google Scholar]
- 25.Li P-C, Li M-L. Adaptive imaging using the generalized coherence factor. IEEE Trans. Ultrason. Ferroelectr. Freq. Control. 2003;vol. 50:128–141. doi: 10.1109/tuffc.2003.1182117. [DOI] [PubMed] [Google Scholar]
- 26.Smith SW, von Ramm OT, Kisslo JA, Thurstone FL. Real time ultrasound tomography of the adult brain. Stroke. 1978 Mar.-Apr.vol. 9:117–122. doi: 10.1161/01.str.9.2.117. [DOI] [PubMed] [Google Scholar]
- 27.Smith SW, Chu K, Idriss SF, Ivancevich NM, Light ED, Wolf PD. Feasibility study: Real-time 3-D ultrasound imaging of the brain. Ultrasound Med. Biol. 2004 Oct.vol. 30:1365–1371. doi: 10.1016/j.ultrasmedbio.2004.08.012. [DOI] [PubMed] [Google Scholar]
- 28.Smith SW, Trahey GE, von Ramm OT. Phased array ultrasound imaging through planar tissue layers. Ultrasound Med. Biol. 1986 Mar.vol. 12:229–243. doi: 10.1016/0301-5629(86)90314-5. [DOI] [PubMed] [Google Scholar]
- 29.Ivancevich NM, Pinton GF, Nicoletto HA, Bennett E, Laskowitz DT, Smith SW. Real-time 3-D contrast-enhanced transcranial ultrasound and aberration correction. Ultrasound Med. Biol. 2008;vol. 34:1387–1395. doi: 10.1016/j.ultrasmedbio.2008.01.015. [DOI] [PMC free article] [PubMed] [Google Scholar]
- 30.Smith SW, Pavy HR, VonRamm OT. High-speed ultrasound volumetric imaging-system. 1. Transducer design and beam steering. IEEE Trans. Ultrason. Ferroelectr. Freq. Control. 1991 Mar.vol. 38:100–108. doi: 10.1109/58.68466. [DOI] [PubMed] [Google Scholar]
- 31.Von Ramm OT, Smith SW, Pavy HR. High-speed ultrasound volumetric imaging-system. 2. Parallel processing and image display. IEEE Trans. Ultrason. Ferroelectr. Freq. Control. 1991 Mar.vol. 38:109–115. doi: 10.1109/58.68467. [DOI] [PubMed] [Google Scholar]
- 32.Ng GC, Worrell SS, Freiburger PD, Trahey GE. A comparative evaluation of several algorithms for phase aberration correction. IEEE Trans. Ultrason. Ferroelectr. Freq. Control. 1994;vol. 41:631–643. [Google Scholar]
- 33.Light ED, Davidsen RE, Fiering JO, Hruschka TA, Smith SW. Progress in two-dimensional arrays for real-time volumetric imaging. Ultrason. Imaging. 1998 Jan.vol. 20:1–15. doi: 10.1177/016173469802000101. [DOI] [PubMed] [Google Scholar]
- 34.Liu DL, Waag RC. About the application of the Van Cittert-Zernicke theorem in ultrasonic imaging. IEEE Trans. Ultrason. Ferroelectr. Freq. Control. 1995 Jul.vol. 42:590–601. [Google Scholar]
- 35.Mallart R, Fink M. The van Cittert-Zernicke theorem in pulse echo measurements. J. Acoust. Soc. Am. 1991 Nov.vol. 90:2718–2727. [Google Scholar]
- 36.Zhao D, Bohs L, Trahey GE. Phase abberation correction using echo signals from moving targets I: description and theory. Ultrason. Imaging. 1992;vol. 14:97–110. doi: 10.1177/016173469201400201. [DOI] [PubMed] [Google Scholar]
- 37.Bohs LN, Zhao D, Trahey GE. Phase aberration correction using echo signals from moving targets II: Experimental system and results. Ultrason. Imaging. 1992;vol. 14:111–120. doi: 10.1177/016173469201400202. [DOI] [PubMed] [Google Scholar]
- 38.Ivancevich NM, Dahl JJ, Trahey GE, Smith SW. Phase aberration correction on a 3D ultrasound scanner using RF speckle from moving targets; Proc. IEEE Ultrason Symp; 2006. pp. 120–123. [DOI] [PubMed] [Google Scholar]
- 39.Walker WF, Trahey GE. The application of k-space in medical ultrasound; Proc. IEEE Ultrasonics Symp; 1995. pp. 1379–1383. [Google Scholar]
- 40.Fujioka KA, Douvile CM. Anatomy and freehand examination techniques. In: Newell DW, Aaslid R, editors. Transcranial Doppler. New York: Raven Press; 1992. pp. 9–31. [Google Scholar]
- 41.Onda Corporation. Acoustic properties of plastic. [Online] 2009 Feb. 27 Available: http://www.ondacorp.com/tables/Plastics.pdf.
- 42.Schwarz KQ, Becher MD, Schimpfky C, Vorwerk D, Bogdahn U, Schlief R. Doppler enhancement with SH U 508A in multiple vascular regions. Radiology. 1994;vol. 193:195–201. doi: 10.1148/radiology.193.1.7916468. [DOI] [PubMed] [Google Scholar]
- 43.Walker WF, Trahey GE. A fundamental limit on the performance of correlation based phase correction and flow estimation techniques. IEEE Trans. Ultrason. Ferroelectr. Freq. Control. 1994 Sep.vol. 41:644–654. [Google Scholar]
- 44.McAleavey SA, Dahl JJ, Pinton GF, Trahey GE. Real time adaptive imaging with 1.75D, high frequency arrays; Proc. IEEE Ultrasonics Symp; 2003. pp. 335–338. [Google Scholar]
- 45.Vignon F, Shi W, Powers J. Determination of temporal bone isoplanatic patch sizes for transcranial phase aberration correction; Proc. IEEE Ultrasonics Symp.2008. [Google Scholar]


