

Abstract
Purpose:
The primary indication for laser treatment in retinopathy of prematurity (ROP) is plus disease, or abnormal dilation and tortuosity of arterioles and venules. ROPtool is a computer program that traces retinal blood vessels and measures their width and tortuosity. Our purpose was to gain insight into the evolution of plus disease by applying ROPtool to RetCam images from eyes of infants who had serial photographs taken during their ROP screening period.
Methods:
Serial images were collected from eyes of 62 infants screened for ROP as part of another study. Fifty-nine images of one eye of 7 infants who developed plus disease were selected and analyzed by ROPtool. The average tortuosity of the most tortuous blood vessel and the average width of the most dilated vessel in each quadrant were calculated for each image.
Results:
Tortuosity increased from an average of 7.72 units at the first examination to 24.44 units at the examination with maximum tortuosity, or an increase of 217% over a mean time period of 6.2 weeks. Two eyes had an increase in tortuosity of more than 500% from the first examination. Vessel width increased from an average of 8.60 units at the first examination to 11.03 units at the examination with maximum blood vessel width, or an increase of 28% over a mean time period of 5.1 weeks.
Conclusions:
ROPtool can measure changes in retinal vascular dilation and tortuosity in individual eyes over time. As plus disease develops, changes in tortuosity are sometimes very large, whereas changes in vessel width tend to be more subtle. Quantification of plus disease over time may help to improve our understanding of its mechanism and to monitor disease progression or response to treatment.
INTRODUCTION
Plus disease, or abnormal dilation and tortuosity of arterioles and venules, is the primary indication for laser treatment in retinopathy of prematurity (ROP).1 Unfortunately, the assessment of plus disease is subjective and prone to error. Studies have found high rates of disagreement when experienced examiners assess the presence or absence of plus or pre-plus disease in high-quality retinal photographs.2,3 ROPtool is a computer program that traces retinal blood vessels and measures their width and tortuosity.4–9 In a previous study,5 ROPtool had superior sensitivity and similar specificity compared to individual examiners when determining whether eyes had tortuosity sufficient for plus disease. ROPtool’s measurement of blood vessel width has recently been piloted, and results show very good accuracy in comparison to two investigators for determining dilation sufficient for plus or pre-plus disease.9
Previous studies using ROPtool have used one image from each eye at one point in time. This approach allowed straightforward statistical analyses because each eye could be considered an individual unit of observation. However, it did not allow study of the changes in blood vessel tortuosity and width over time in a single eye or in a series of eyes. The purpose of the current study was to gain insight into the evolution of plus disease by applying ROPtool to RetCam images from eyes of premature infants who had serial photographs taken during their ROP screening period.
METHODS
The Duke University Health System Institutional Review Board approved this study. Serial images were collected from eyes of 62 infants screened for ROP as part of another study.10,11 Seven eyes that developed plus disease and had serial RetCam (Clarity, Pleasanton, California) images of reasonably good quality, both judged by one of the authors (D.K.W.), were selected for inclusion. Only one eye per infant was included, and this was the left eye unless the right eye had images of better quality (2 infants). No information was available for any of these infants except for date of examination, and date of laser treatment when applicable was determined based on laser spots evident in peripheral retinal images.
ROPtool, version 2.1.5, was used to trace 59 total images from 7 eyes (mean of 8.4 images per eye), using a technique that has been described previously.4–9 In short, after the operator clicks on or near a blood vessel, ROPtool identifies and traces the vessel’s center line in both directions and then calculates vessel width and tortuosity. Tortuosity is calculated by dividing the total blood vessel length by the length of a smooth curve generated from several points along the blood vessel. ROPtool calculates vessel width by first generating profiles of entire cross sections of vessels.9 For each cross section, a graph of grayscale intensity versus distance from the center of the vessel is generated, and ROPtool identifies the point with maximum slope on each side of the intensity curve. Multiple samples of vessel width are averaged to generate a raw measure of width, which is then divided by the distance from the center of the optic nerve to the center of the macula, to account for relative image size.
ROPtool calculates a tortuosity index and a dilation index for each traced blood vessel. The program has been calibrated using expert consensus in previous studies so that indices greater than 10 are consistent with dilation or tortuosity sufficient for plus disease. Quadrant dilation and tortuosity are determined based on the most dilated and the most tortuous vessel in each quadrant. For this study, quadrant values (indices) were averaged to generate an overall tortuosity grade and an overall dilation grade for each image. For each eye, the tortuosity index at the first examination was compared with its value just before laser (5 eyes) and also compared to its value at the examination with maximum tortuosity (7 eyes). A rate of increase was calculated by dividing the percentage increase from baseline in tortuosity or dilation by the number of weeks between examinations. Similar calculations were performed for vessel width. One eye (from infant 7) was excluded from the calculation of increase in vessel width over time (but included for tortuosity) because maximum dilation occurred at the first examination.
RESULTS
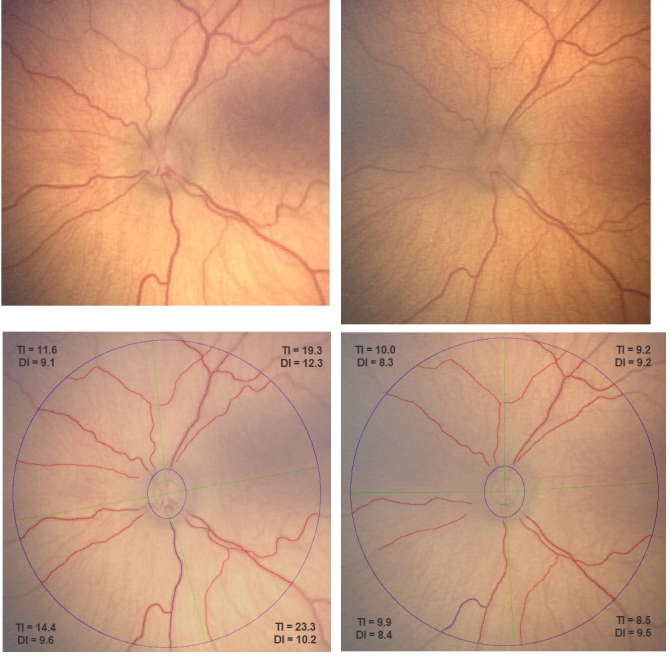
Fifty-eight of 59 images could be traced by ROPtool, and the average time to analyze each image was approximately 5 minutes. Figure 1 shows an example of one eye (infant 1) at the first examination and then 2 weeks and 5 weeks later. The average quadrant tortuosity (overall tortuosity grade) changed from 7.55 to 17.18 units, or an increase from baseline of 128% over 5 weeks. The average quadrant dilation (overall dilation grade) increased from 8.01 to 10.30 units, or an increase from baseline of 29% over 5 weeks. Figure 1 shows that as vessel width increased, more blood vessels were visible and could be traced by ROPtool. Figure 2 shows the same eye before and after laser treatment. Average quadrant tortuosity decreased after laser from 17.18 to 9.40 units (45% decrease), and average dilation decreased from 10.30 to 8.88 units (14% decrease).
FIGURE 1.

Left eye of infant 1 at baseline examination (top left), 2 weeks later (top middle), and 5 weeks later (top right, just before laser treatment), with corresponding images after tracing of major vessels by ROPtool (bottom row, left, middle, and right). Tortuosity index (TI) and dilation index (DI) are shown for each quadrant, both based on the most abnormal vessel in the quadrant. (Images courtesy of the Antonio Capone, MD, and the Photo-ROP Study Group.)
FIGURE 2.
Left eye of infant 1 just before (top left) and approximately 1 week after (top right) laser treatment, with corresponding images after tracing of major vessels by ROPtool (bottom, left and right). Tortuosity index (TI) and dilation index (DI) are shown for each quadrant. (Images courtesy of the Antonio Capone, MD, and the Photo-ROP Study Group.)
Table 1 summarizes changes in tortuosity over time for all eyes. On average, eyes increased from a tortuosity index of 7.72 at first examination to a tortuosity index of 24.44 at the examination with maximum tortuosity. The average relative increase in tortuosity from baseline was 217% over 6.2 weeks. Some eyes had very large relative increases in tortuosity; for example, one eye from infant 6 increased from 4.56 to 41.95 tortuosity units, or an increase of 820% over 2.9 weeks. Other eyes, such as those from infants 4 and 7, had more modest increases in tortuosity (68% and 40% from baseline, respectively) yet still had changes sufficient for plus disease.
TABLE 1.
CHANGES IN VESSEL TORTUOSITY OVER TIME FOR 7 EYES OF 7 INFANTS WHO DEVELOPED PLUS DISEASE*
| INFANT NO. | TORTUOSITY AT FIRST EXAM | TORTUOSITY AT TIME OF LASER (NO. OF WEEKS AFTER FIRST EXAM) | INCREASE FROM FIRST EXAM TO LASER | INCREASE PER WEEK FROM FIRST EXAM TO LASER | MAXIMUM TORTUOSITY (NO. OF WEEKS AFTER FIRST EXAM) | INCREASE FROM FIRST EXAM TO MAXIMUM TORTUOSITY | INCREASE PER WEEK FROM FIRST EXAM TO MAXIMUM TORTUOSITY |
|---|---|---|---|---|---|---|---|
| 1 | 7.55 | 17.18 (5.0) | 128% | 26% | 22.20 (3.3) | 194% | 59% |
| 2 | 4.96 | 12.43 (6.9) | 151% | 22% | 12.43 (6.9) | 151% | 22% |
| 3 | 5.08 | 12.19 (8.9) | 140% | 16% | 31.55 (11.9) | 521% | 44% |
| 4 | 8.38 | 8.99 (5.0) | 7% | 1% | 14.11 (4.0) | 68% | 17% |
| 5 | 10.57 | 22.27 (3.0) | 111% | 37% | 30.58 (6.1) | 189% | 31% |
| 6 | 4.56 | NA | NA | NA | 41.95 (8.0) | 820% | 102% |
| 7 | 12.98 | NA | NA | NA | 18.23 (2.9) | 40% | 14% |
| Average | 7.72 | 14.61 (5.8) | 100% | 20% | 24.44 (6.2) | 217% | 41% |
NA, not applicable.
Tortuosity expressed in units.
Table 2 summarizes changes in vessel width over time. On average, eyes increased from a dilation index of 8.93 at the first examination to a dilation index of 11.01 at the examination with maximum dilation. Relative increases in dilation were modest in comparison to tortuosity, and one eye (eye 7) had its greatest vessel width at the first examination. Excluding this eye, the average relative increase in vessel width was 28% over 5.1 weeks. Maximum dilation and maximum tortuosity both occurred within a 2-week span in 4 of 7 eyes, and maximum tortuosity occurred more than 2 weeks after maximum dilation in 3 of 7 eyes.
TABLE 2.
CHANGES IN VESSEL WIDTH OVER TIME FOR 7 EYES OF 7 INFANTS WHO DEVELOPED PLUS DISEASE*
| INFANT NO. | WIDTH AT FIRST EXAM | WIDTH AT TIME OF LASER (NO. OF WEEKS AFTER FIRST EXAM) | INCREASE FROM FIRST EXAM TO LASER | INCREASE PER WEEK FROM FIRST EXAM TO LASER | MAXIMUM WIDTH (NO. OF WEEKS AFTER FIRST EXAM) | INCREASE FROM FIRST EXAM TO MAXIMUM WIDTH | INCREASE PER WEEK FROM FIRST EXAM TO MAXIMUM WIDTH |
|---|---|---|---|---|---|---|---|
| 1 | 8.01 | 10.30 (5.0) | 29% | 6% | 10.56 (5.0) | 32% | 10% |
| 2 | 9.88 | 10.02 (6.9) | 1% | 0% | 10.86 (5.0) | 10% | 1% |
| 3 | 8.40 | 11.9 (8.9) | 42% | 5% | 12.01 (7.9) | 43% | 5% |
| 4 | 8.37 | 12.09 (5.0) | 44% | 9% | 12.59 (4.6) | 50% | 11% |
| 5 | 8.88 | 9.48 (3.0) | 7% | 2% | 9.75 (2.0) | 10% | 3% |
| 6 | 8.08 | NA | NA | NA | 10.4 (6.0) | 29% | 4% |
| 7 | 10.89 | NA | NA | NA | 10.89 (0) | NA | NA |
| Average | 8.93 | 10.76 (5.8) | 20% | 4% | 11.01 (4.4) | 28%† | 6%† |
NA, not applicable.
Width expressed in units.
Eye from infant 7 was excluded from these calculations.
DISCUSSION
This study found that tortuosity increased an average of 217% and vessel width increased an average of 28% from baseline over a period of 5 to 6 weeks between the first examination and the examination with maximum abnormality. These findings are consistent with our clinical impression that tortuosity changes can be quite striking, whereas changes in vessel width tend to be more subtle. These large tortuosity changes are in large part driven by ROPtool’s method for calculating tortuosity, which it performs by dividing the total vessel length by the length of a smooth curve generated from several points along that given vessel. When significant tortuosity is present, the total vessel length is much larger than the length of the smooth curve, resulting in tortuosity index values up to 40 or 50. On the other hand, vessel width is based on identifying the maximum slope on grayscale intensity curves and calculating the distance from the vessel’s center line. When plus disease develops and a vessel gets wider, the relative change is much less than for tortuosity, such that dilation index values rarely exceed 15, even in severe ROP.
The human observer is quite sensitive to small changes in both dilation and tortuosity.12 In fact, humans might be more sensitive to changes in vessel width than computers, because changes in width can be relatively small and image blur can affect the accuracy of automated assessment. Experienced examiners disagree when grading photographs, probably because they are calibrated differently as to what constitutes an abnormality severe enough to be designated as plus disease, despite the existence of a standard photograph.13 It seems less likely that examiners disagree because they are unable to appreciate that one vessel is more dilated or more tortuous than another. It may also be that different examiners focus on different blood vessels when determining whether an eye has plus disease or not. These are areas where a computer program has an advantage, because it can always be calibrated the same, and it can usually be programmed or directed to choose the important vessels in each quadrant, depending on adequate image quality.
How might it be useful to measure change in tortuosity and/or dilation of premature infants’ retinal blood vessels over time? If this technology can be applied at the bedside, then measuring change over time could help ophthalmologists to more precisely monitor worsening of ROP or response to treatment. It could also aid in treatment decisions, as one might be more willing to treat with laser an eye with “borderline” plus disease if a large and/or rapid change in blood vessel appearance was calculated and reported by the computer. In addition, little is known about the predictive value of early changes in blood vessel width or tortuosity. Further studies would help to elicit the predictive value of the amount or rate of posterior pole blood vessel changes occurring weeks before an eye develops plus disease. An additional unknown is the clinical utility of having ROPtool consider only the most tortuous or the most dilated vessel in each quadrant versus calculating the average of all tracings; a ROPtool pilot study of vessel tortuosity alone found no obvious difference in these two strategies.4 In the current study, quadrant values were based on the most dilated and the most tortuous vessel in the quadrant, because it is our impression that this method most closely mirrors the clinical examination, when the ophthalmologists’ eyes are drawn to the most abnormal vessel in each quadrant.
This study must be viewed in light of some limitations. First, although 59 total images were analyzed, they were derived from only 7 eyes, so the findings may not be representative of the spectrum of plus disease evolution. Second, it was not always possible to trace the same vessels from images of the same eye taken at different points in time, because some images had better quality than others. It is also possible that some vessels were hidden in some images owing to compression artifact that can occur with the RetCam.14 Third, dilation and tortuosity were analyzed separately using high-quality images, whereas the assessment of plus disease is really an overall assessment of both dilation and tortuosity observed during binocular indirect ophthalmoscopy. We are currently analyzing methods for combining tortuosity and dilation scores into an overall “plus index” (Kiely AE, Association for Research in Vision and Ophthalmology, 2009, Abstract). Finally, it might have been useful to include a control group of eyes that did not develop plus disease. Although we would not expect to see much change over time in these eyes, inclusion of such a control group would allow us to contrast changes in eyes developing plus disease with those changes observed due to chance or due to the normal process of retinal maturation.
In conclusion, this study found that ROPtool can calculate blood vessel width and tortuosity in several series of images from the same eyes, allowing quantification of change in these two parameters over time. Additional studies are needed to determine the most useful descriptors of retinal vessel change, to elicit the predictive value of these changes, and to combine quantitative measures of dilation and tortuosity.
ACKNOWLEDGMENTS
Funding: Supported by grant K23 EY01580 from the National Eye Institute.
Financial Disclosures: None.
Author Contributions: Design of the study (D.K.W., S.F.F., Z.Z.); Conduct of the study (D.K.W.); Management, analysis, and interpretation of data (D.K.W., S.F.F.); Preparation, review, or approval of the manuscript (D.K.W., S.F.F., Z.Z.).
Conformity With Author Information: The study was approved by the Duke University Health System Institutional Review Board. Other Acknowledgments: We thank Antonio Capone, MD, of William Beaumont Hospital, Royal Oak, Michigan, and the Photo-ROP Study Group for sharing RetCam photographs.
REFERENCES
- 1.Early Treatment for Retinopathy of Prematurity Cooperative Group Revised indications for the treatment of retinopathy of prematurity: results of the Early Treatment for Retinopathy of Prematurity randomized trial. Arch Ophthalmol. 2003;121:1684–1694. doi: 10.1001/archopht.121.12.1684. [DOI] [PubMed] [Google Scholar]
- 2.Chiang MF, Jiang L, Gelman R, Du YE, Flynn JT. Interexpert agreement of plus disease diagnosis in retinopathy of prematurity. Arch Ophthalmol. 2007;125:875–880. doi: 10.1001/archopht.125.7.875. [DOI] [PubMed] [Google Scholar]
- 3.Wallace DK, Quinn GE, Freedman SF, Chiang MF. Agreement among pediatric ophthalmologists in diagnosing plus and pre-plus disease in retinopathy of prematurity. J AAPOS. 2008;12:352–356. doi: 10.1016/j.jaapos.2007.11.022. [DOI] [PMC free article] [PubMed] [Google Scholar]
- 4.Wallace DK, Zhao Z, Freedman SF. A pilot study using “ROPtool” to quantify plus disease in retinopathy of prematurity. J AAPOS. 2007;11:381–387. doi: 10.1016/j.jaapos.2007.04.008. [DOI] [PubMed] [Google Scholar]
- 5.Wallace DK, Freedman SF, Zhao Z, Jung SH. Accuracy of ROPtool vs individual examiners in assessing retinal vascular tortuosity. Arch Ophthalmol. 2007;125:1523–1530. doi: 10.1001/archopht.125.11.1523. [DOI] [PubMed] [Google Scholar]
- 6.Wallace DK. Computer-assisted quantification of vascular tortuosity in retinopathy of prematurity (an American Ophthalmological Society thesis) Trans Am Ophthalmol Soc. 2007;105:594–615. [PMC free article] [PubMed] [Google Scholar]
- 7.Zhao Z, Wallace DK, Freedman SF, Aylward SR. A tool for computer-aided diagnosis of retinopathy of prematurity. Proc SPIE Med Imag. 2008;6915(69152W):1605–7422. [Google Scholar]
- 8.Johnston SC, Wallace DK, Freedman SF, Yanovitch TL, Zhao Z. Tortuosity of arterioles and venules in quantifying plus disease. J AAPOS. 2009;13:181–185. doi: 10.1016/j.jaapos.2008.10.019. [DOI] [PubMed] [Google Scholar]
- 9.Wallace DK, Freedman SF, Zhao Z. A pilot study using ROPtool to measure retinal vascular dilation. Retina. 2009;29:1182–1187. doi: 10.1097/IAE.0b013e3181a46a73. [DOI] [PubMed] [Google Scholar]
- 10.Photographic Screening for Retinopathy of Prematurity (Photo-ROP) Cooperative Group. Balasubramanian M, Capone A, Jr, Hartnett ME, Pignatto S, Trese MT. The Photographic Screening for Retinopathy of Prematurity Study (Photo-ROP): study design and baseline characteristics of enrolled patients. Retina. 2006;26(7 Suppl):S4–10. doi: 10.1097/01.iae.0000244291.09499.88. [DOI] [PubMed] [Google Scholar]
- 11.Photographic Screening for Retinopathy of Prematurity (Photo-ROP) Cooperative Group The Photographic Screening for Retinopathy of Prematurity Study (Photo-ROP): primary outcomes Retina 2008283 SupplS47–54.[erratum in Retina 2009;29:127] [DOI] [PubMed] [Google Scholar]
- 12.Freedman SF, Kylstra JA, Capowski JJ, Realini TD, Rich C, Hunt D. Observer sensitivity to retinal vessel diameter and tortuosity in retinopathy of prematurity: a model system. J Pediatr Ophthalmol Strabismus. 1996;33:248–254. doi: 10.3928/0191-3913-19960701-10. [DOI] [PubMed] [Google Scholar]
- 13.Cryotherapy for Retinopathy of Prematurity Cooperative Group Multicenter trial of cryotherapy for retinopathy of prematurity: preliminary results. Arch Ophthalmol. 1988;106:471–479. doi: 10.1001/archopht.1988.01060130517027. [DOI] [PubMed] [Google Scholar]
- 14.Zepeda-Romero LC, Martinez-Perez ME, Ramírez-Ortiz MA, Gutierrez-Padilla JA.RetCam compression artifact can mask plus disease Eye 2009February20[Epub ahead of print]. [DOI] [PubMed] [Google Scholar]