Abstract
Background and Aims
The cellular structure of fleshy fruits is of interest to study fruit shape, size, mechanical behaviour or sensory texture. The cellular structure is usually not observed in the whole fruit but, instead, in a sample of limited size and volume. It is therefore difficult to extend measurements to the whole fruit and/or to a specific genotype, or to describe the cellular structure heterogeneity within the fruit.
Methods
An integrated method is presented to describe the cellular structure of the whole fruit from partial three-dimensional (3D) observations, involving the following steps: (1) fruit sampling, (2) 3D image acquisition and processing and (3) measurement and estimation of relevant 3D morphological parameters. This method was applied to characterize DR12 mutant and wild-type tomatoes (Solanum lycopersicum).
Key Results
The cellular structure was described using the total volume of the pericarp, the surface area of the cell walls and the ratio of cell-wall surface area to pericarp volume, referred to as the cell-wall surface density. The heterogeneity of cellular structure within the fruit was investigated by estimating variations in the cell-wall surface density with distance to the epidermis.
Conclusions
The DR12 mutant presents a greater pericarp volume and an increase of cell-wall surface density under the epidermis.
Keywords: Stereology, 3D morphology estimation, tomato fruit, cellular structure, image analysis, confocal microscopy
INTRODUCTION
The cellular structure of fleshy fruit is generally investigated to relate it to fruit shape and size, mechanical properties or sensory texture.
Studies have shown that the final size of the fruit depends on both the number and the size of cells (Coombe, 1976; Esau, 1977). This has been demonstrated in many fruits, such as cherry (Olmstead and Iezzoni, 2007), tomato (Bünger-Kibler and Bangerth, 1983; Bertin et al., 2003), peach (Zanchin et al., 1994), blueberry (Cano-Medrano and Darnell, 1997), apple (Harada et al., 2005) and Japanese pear (Zhang et al., 2006).
The cellular structure is also thought to be involved in the mechanical properties of fruits, such as firmness or resistance to injury (Redgwell et al., 1997; Knee, 2002; Allende et al., 2004). This assumption is the basis for modelling the mechanics of cellular tissue (Bruce, 2003; Mebatsion et al., 2006, 2008). Cellular structure may also play a role in the sensory texture of fleshy fruits (Jackman and Stanley, 1995; Allan-Wojtas et al., 2003). Diffusion properties of gas within tissues that affect the ripening of the fruit are also strongly affected by the cellular structure (Mendoza et al., 2007; Verboven et al., 2008).
Cellular structure and its variations within the fruit
Cellular structure can be described by the size, shape and spatial organization of cells within tissues. In fleshy fruits, the cellular structure may vary with the type of tissue and location within the tissue, e.g. distance from the epidermis, pedicel or vascular bundles (Cheniclet et al., 2005; Devaux et al., 2008; Legland et al., 2008; Mebatsion et al., 2008).
Large variations in cellular structure are induced by the variability inherent to most biological materials. For example, the cells in a small region may exhibit various sizes or shapes (Guines et al., 2003; Harada et al., 2005; Legland et al., 2008). The variability itself can be instructive. In the field of material sciences, it has been demonstrated that the homogeneity of pore sizes has an effect on mechanical behaviour (Fazekas et al., 2002; Zhu, 2002; Ramamurty and Paul, 2004).
In order to improve comprehension of the mechanical properties or the sensory texture of fruit, it is necessary to quantify not only the average cellular structure in the whole fruit but also its variations within the fruit, by taking the biological variability of the fruit into account.
Imaging the cellular structure of fleshy fruits
Observations of fleshy fruit cellular structure are often restricted to a region that is easy to isolate and to recognize (usually the equatorial region). In most studies, the heterogeneity of cellular structure within fruit is not taken into account. As a result, the conclusions made on samples can rarely be extrapolated to the whole fruit. Moreover, the variations of cellular structure within the fruit cannot be assessed. To overcome this problem, samples must be taken within the whole fruit, without being restricted to a particular region.
The cellular structure of plant tissues is usually investigated using microscopy with the objective of quantifying cell size and shape (Konstankiewicz et al., 2001; Guillemin et al., 2004; Horiguchi et al., 2006). For fleshy fruits, this approach leads to several problems. Compared with the size of the field of view in microscopic acquisition (at most 1 mm), fruit cells are relatively large. They may range from several hundred micrometres (Cano-Medrano and Darnell, 1997; Higashi et al., 1999; McAtee et al., 2009) to 1 mm in the case of tomato (Devaux et al., 2008). Only a few cells are visible in a single image. As a result, several images are combined to form a mosaic image to obtain a representative observed area (Fromont et al., 2005). Moreover, the size of the observed sample is small compared with the size of the tissue; the diameter of fleshy fruits can reach several tens of centimetres (Higashi et al., 1999).
Microscopic observations are usually two-dimensional, whereas the cellular structure is three-dimensional (3D). To assess actual 3D morphology, it is necessary either to use 3D image acquisition procedures or to estimate 3D parameters from planar observations using stereological methods (Baddeley and Jensen, 2005). 3D confocal microscopy offers an adapted resolution for imaging cellular tissues (Ancin et al., 1996; Gray et al., 1999). However, the observable depth is limited to 200 µm, which makes most of the cells not fully visible in three dimensions as they are truncated by the field of view (Legland et al., 2008).
Quantification of the cellular structure
The cellular structure of fruits is quantified by image analysis. The most common approach in quantitative histology is to consider the tissue as a collection of disjoint cells and to describe each cell by a set of geometric features such as area, perimeter, convexity, shape factor and number of neighbours (Bengough et al., 2001; Konstankiewicz et al., 2001; Guillemin et al., 2004; Mebatsion et al., 2006). Tissues can be described by the histogram of cell features (Ancin et al., 1996; Carpenter et al., 2006). This approach is flawed owing to several problems: (1) cells touching the window border induce bias in statistics, (2) most features are only available for 2D images and (3) it is not easy to extrapolate a histogram measured in an image to the histogram in the whole fruit.
An alternative to classical image processing is to consider all the cells of the tissue as a unique 3D geometric structure. This structure can be described using morphological parameters such as volume, surface area or number of connected components. In order to facilitate comparisons, these morphological parameters are often divided by a reference volume (such as the volume of the fruit or the tissue) to produce quantities referred to as ‘densities’.
Nevertheless, the structure formed by the set of cells is usually not fully observed. Observations are made on a reduced number of ‘probes’, e.g. 2D sections or 3D slabs, which contain only a part of the structure. The aim of stereology is to estimate morphological parameters of the whole structure from observations made on probes. Many powerful estimators have been developed to describe systems of particles or more complicated structures such as foam materials or biological structures (Gundersen, 1985, 1986; Jensen and Gundersen, 1985).
The quality of the morphology estimators depends on the sampling procedure that determines the location of the probes with respect to the whole fruit. The sampling procedure must allow the unbiased estimation of morphological parameters and should not be too complicated to implement. A typical sampling procedure is to cut the structure into parallel, equally spaced slices by choosing the orientation and position of the first slice at random, without favouring any orientation or position.
It is often practical to sample the fruit in relation to its shape. This type of sampling procedure rarely permits unbiased estimation of morphological parameters. Legland et al. (2008) have recently shown that volume and surface area can be estimated without bias from 3D slabs perpendicular to a reference surface. For a fruit, the external epidermis is an appropriate reference surface. The proposed sampling procedure induces over- or under-sampling of points as their distance to the external epidermis increases. Unbiased estimations from 3D measurements in the slabs are possible but this requires the computation of the sampling probability of each point.
To quantify heterogeneity, an easy-to-use approach is to measure or estimate parameters at different locations within the organ. Locations can be with reference to the epidermis, the closest vascular bundle, the stem, etc. By using appropriate averaging, it is possible to draw profiles of morphological variations within the organ (Legland et al., 2008).
Quantification of the morphological variation within the AS-DR12 mutant
Among fleshy fruits, tomato (Solanum lycopersicum) has emerged as an effective model for the study of organoleptic, genetic or molecular biology properties (Giovannoni, 2004; Shibata, 2005; Cheniclet et al., 2005). In order to identify genes responsible for given traits, genetic screening and tomato mutant selection have been investigated (Giovannoni et al., 1999; Causse et al., 2002, 2004), leading to a better understanding of fruit development (Tanksley, 2004), ethylene biosynthesis (Lelièvre et al., 1997), relationships between morphology and sensory traits (Chaïb et al., 2007), regulation of ripening (Giovannoni, 2004) and fruit coloration (Thompson et al., 1999).
Down-regulation of the DR12 gene encoding an auxin response factor was shown to have an effect on fruit firmness at the red-ripe stage (Jones et al., 2002). The significant differences in texture could not be explained by cell-wall composition (Guillon et al., 2008). An increase of cellular division was observed under the external epidermis but not precisely quantified (Jones et al., 2002).
The aim of the present study was to apply fully automated image processing tools and stereological methods to estimate the actual 3D cellular structure of tomato pericarp in order to reveal morphological differences between down-regulated auxin response factor tomatoes and wild-type tomatoes. In the sampling procedure, the whole tomato fruit was considered, taking the shape of the fruit into account. Cells were observed using 3D confocal microscopy, and mosaic images were built to observe the full thickness of the pericarp. The cellular structure was described by the volume of pericarp, the surface area of cell walls and the surface-area-to-volume ratio. These parameters were measured in the 3D images. Average values for each tomato were estimated by taking the sampling probability of each voxel into account. Profiles of variations depending on the distance to the epidermis were built by estimating parameters for different distance classes within the pericarp.
MATERIALS AND METHODS
Cell-wall surface densities in the whole fruit were estimated using the following methods: (1) sampling design taking the whole fruit into account, (2) acquisition of 3D images using confocal microscopy, (3) segmentation of 3D images, (4) global estimation of the cell-wall density in the whole fruit and (5) estimation of cellular structure heterogeneity by establishing density profiles of cell-wall density.
Sampling of tomatoes
Wild-type and DR12 antisense lines from the ‘Kemer’ cultivar (Jones et al., 2002) were studied. Seeds were provided by INRA Bordeaux and tomato plants were grown in greenhouses at INRA Avignon and stored at 20 °C in a dark room. Fruits of approximately the same size (visual inspection) were sampled at the red-ripe stage. Twelve fruits from each genotype were analysed. As some images were discarded due to their poor quality, only nine fruits of the wild-type and ten fruits of AS-DR12 remained for further analyses.
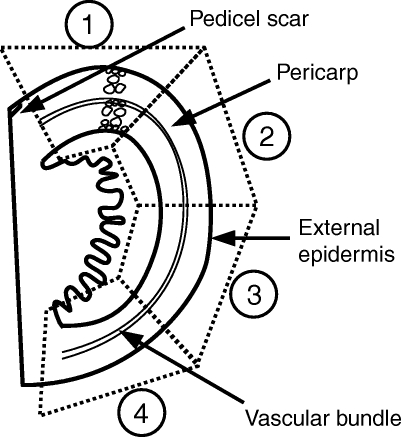
The meridian length of each tomato was measured using a measuring tape, starting from the pedicel scar and finishing at the tomato apex. Four sampling regions were considered in relation to the pedicel scar: near the pedicel scar, each side of the tomato equator, and the apical region of the tomato (Fig. 1). The limit of each region was established by dividing 90 % of the meridian length into four equal lengths, leaving a 5 % margin around the pedicel scar and around the apex to facilitate sampling.
Fig. 1.
Schematic description of a tomato fruit showing the four regions used for sampling the pericarp.
The sampling points were referenced in relation to their geodesic distances to the pedicel scar (i.e. the shortest distance between the pedicel scar and the point on the surface of the pericarp). The origin of the first point was chosen uniformly within the limits of the first region. The positions of the three other points were obtained by adding one, two or three times the geodesic length of a sampling region. The longitude of each point was uniformly chosen between 0° and 360°, without trying to avoid the radial pericarp.
For each sampling region, a pericarp cylinder was extracted perpendicular to the surface, using a core-borer (diameter: 15 mm). When radial pericarp was encountered, it was removed. Slices were taken in the middle of the cylinders, with a random orientation around the cylinder axis (Legland et al., 2008). Slices (300 µm thick) were cut using a vibrating blade microtome (HM 650 V; Thermo Fisher Scientific, Walldorf, Germany).
Image acquisition
Pericarp slices were stained using acridin orange. Images were acquired with a Zeiss LSM410 confocal laser scanning microscope, using a ×10 air-immersion lens with a numerical aperture of 0·5. Under these conditions, the optical section thickness was approximately 7·5 µm and the z-scanning step was set accordingly at 7·5 µm. The excitation wavelength was 488 nm and the light emitted over 515 nm was collected using a long-pass filter. Each image was digitized as a 512 × 512-pixel matrix with grey levels coded between 0 (black) and 255 (white).
3D image stacks were reconstructed from optical slices, resulting in a 512 × 512 × Nz voxel matrix, where Nz is the number of optical slices. The resolution of images was 2·5 µm in the x and y direction, resulting in a 1·275-mm field of view. In order to have uniform resolution for each dimension, the z-resolution of the image was transformed from 7·5 to 2·5 µm by tripling each planar image.
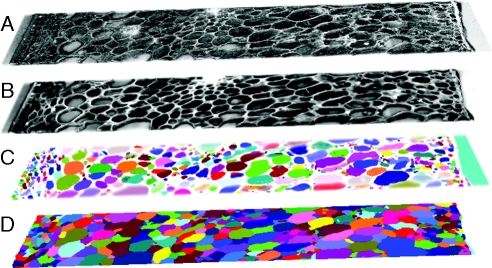
Because the whole pericarp thickness could not be observed in a single 3D image, several adjacent 3D images were acquired to form 3D mosaic images (Fig. 2). Due to variations in the width of the pericarp slice, the z-origin of each stack also varied. The 3D translation vector between two consecutive stacks was estimated by minimizing the squared difference between the overlapping regions. To reduce the computation time, a pyramidal approach was used. Coarse estimation of translation was first performed on a filtered version of the image and the estimation was then refined using less filtered images (Fromont et al., 2005).
Fig. 2.
Reconstruction of a 3D mosaic image from several adjacent 3D stacks.
Image processing
The aim of image processing was to automatically measure the surface area of the cell walls, the volume of pericarp and the pericarp thickness from 3D images. Several steps were required: image enhancement to reduce acquisition noise, image segmentation to obtain a binary image, and the measurement of geometrical parameters from a set of voxels. As the automatic segmentation of cells can generate errors, a semi-automated segmentation procedure was carried out on a reduced set of images and the measurements of the cell-wall surface area obtained by the two methods were compared.
Image enhancement
Confocal microscopy induces intensity decay with depth. Several methods have been proposed to correct decay, by modelling the loss of intensity as a function of depth. In the present work, an exponential modelling decay was applied that uses robust estimation, which ignores pixels far from the decay model (Kervrann et al., 2004).
Images are filtered in order to enhance the cell walls and to remove intensity fluctuations caused by acquisition. A typical image filter consists of computing the average or the median value of the voxels located in a surrounding cubic neighbourhood for each voxel. This eliminates noise and does not modify large structures. Because cell walls appear as thin surfaces, this type of filtering makes them disappear (Legland and Devaux, 2009). Directional median filtering was used instead. Several median filters were applied using line segments with different orientations as structuring elements. For each direction, only the portions of cell walls parallel to the current direction were enhanced. The maximum intensity over all directions was maintained for each pixel, reconstructing an enhanced image of cell walls with less noise within the cells (Fig. 3B). Images were processed using 16 line segments with a length of 25 pixels, according to the visible mean cell-wall thickness.
Fig. 3.
The different steps of image processing for 3D mosaic images: (A) original greyscale mosaic; (B) result of enhancement by directional median filtering; (C) detection of extended minima; and (D) result of labelling from the 3D watershed, showing cells and intercellular spaces.
Automatic segmentation
The objective of segmentation is to transform a greyscale image into either a binary or a labelled image. The watershed is a powerful algorithm that considers images as a landscape, with altitude given by grey values (Soille, 2003). The result of the algorithm is a set of catchment basins corresponding to dark regions, separated by a watershed following the light voxels. In the present case, catchment basins correspond to the interior of cells or intercellular spaces, whereas the watershed represents cell walls.
When watershed transformation is applied directly to a greyscale image, many catchment basins are detected, resulting in over-segmentation. This is caused by the fact that each local minimum in the image produces a catchment basin. Common solutions are to filter the image before processing and/or to use a binary image of markers that imposes the minima of the watershed. Extended-minima transform is one of the various solutions that can be applied in order to control this over-segmentation (Soille, 2003; Legland and Devaux, 2009).
Extended minima were detected using a threshold equal to 10. Additional directional morphological filters were applied on each slice to remove markers located inside cells and to divide markers corresponding to a unique cell (Fig. 3C). The 3D watershed algorithm was applied using the six-adjacency (i.e. using the nearest neighbour in each one of the x, y, and z directions) for regions. After elimination of voxels located outside of the pericarp, the segmented regions corresponded to pericarp cells and to pericarp intercellular spaces (Fig. 3D).
It was not possible to discriminate cells and intercellular spaces automatically. Moreover, some cells were either over- or under-segmented. The impact of segmentation errors is evaluated in a validation procedure.
Measurements of morphological features
Local measurements of pericarp volume and of cell-wall surface area were needed both to build the estimation procedure and to assess morphological profiles according to the location in the pericarp.
Pericarp volume in 3D images was measured as the sum of voxels belonging to the pericarp multiplied by the voxel resolution. Voxels belonging to the pericarp were identified from the segmented images as the union of watershed regions with their boundaries. The pericarp image was obtained by using a morphological closing with a 3 × 3 × 3 cube as the structuring element.
The thickness of the pericarp in the radial direction was measured in each reconstructed 3D image by considering the centre line with middle y position and middle z position, and by counting the number of voxels belonging to the pericarp, multiplied by the image resolution.
The measurement of cell-wall surface area is not straightforward due to the discrete nature of digital images (Serra, 1982; Ohser et al., 1998; Lang et al., 2001). Legland et al. (2007) have shown that local area could be obtained from local voxel configuration counts. In addition, the method allows for the local measurement of parameters. Surface area was measured globally for both cells and intercellular spaces. The induced measurement bias is evaluated in the validation procedure.
The results of cell-wall surface area and pericarp volume measurements for each image are 3D maps containing the contribution of each voxel. The measurement of pericarp volume or cell-wall surface area for one image is obtained by summing all the values of the map.
Image processing validation
Semi-automatic segmentation was performed following a two-step procedure, first by a manual control of the markers imposed in the watershed procedure and second by selecting which segmented regions were actually cells. A set of 25 3D sub-images were randomly selected in the 3D mosaic images. Each sub-image was a 100 × 100-pixel region, keeping all slices of the original image.
Multiple minima corresponding to single regions were removed and minima were added when detected regions corresponded to several regions. The decision for regions touching the border of the image was taken by considering voxels outside the sub-image. By carefully adding and removing minima and applying the watershed as explained before, a segmentation considered as valid was obtained for each sub-image.
The surface area of cell walls was measured. The segmentation step resulted in regions corresponding both to cells and to intercellular spaces that were not distinguished. By measuring the cell-wall surface for segmented regions, intercellular spaces were treated as cells, inducing an over-estimation of cell-wall surface area. A manual classification was made for each region of the sub-images. By retaining only the regions corresponding to pericarp cells and measuring their surface, a reference value for the cell-wall surface area was obtained for each sub-image, which was then compared with the surface measurement for sub-images without correction.
Estimation of morphological features
Sampling pericarp by 3D rectangular probes induces a sampling bias: pericarp regions near the centre are over-represented in 3D images. However, the sampling bias can be corrected when sampling probability is available. In a previous study, Legland et al. (2008) calculated the sampling probability for every location in the tomato pericarp. The sampling probability depends on the main curvatures of the tomato surface, the density of sampling points on the surface, the distance of the voxel to the epidermis and the size of the 3D image.
The distance to the pericarp surface was measured in images. The main curvatures and the sampling point density were computed by modelling the tomato surface with a revolution surface. The generating curve of the revolution surface was computed by fitting a polynomial curve to the contour of several tomato quarters, as described in Legland et al. (2008). The generating curve was also used to calculate a posteriori the length of the meridian. Values were compared with those measured manually on the fruit.
Pericarp volume and cell-wall surface area in the whole fruit were estimated by summing the local values measured in the 3D images, weighted by their sampling probabilities. Each image was taken in one of the four sampling regions of the whole fruit (Fig. 1). The estimation from each image therefore corresponded to the estimation of the parameter for the corresponding sampling region. Estimates per tomato fruit were obtained by summing the estimates made for its four sampling regions. Estimates of cell-wall surface density for each sampling region and tomato were obtained by dividing cell-wall surface area estimates by pericarp volume estimates.
In order to assess the variations of morphology within the pericarp, profiles of cell-wall surface area and pericarp volume were constructed. The contribution of voxels located at the same distance to the external epidermis was summed to obtain estimates for a given distance from the external epidermis. Results are profiles of estimated parameters with a number of points proportional to the thickness of the pericarp. In order to reduce the size of the profiles and to make their comparison possible, synthetic profiles with identical numbers of points were created. Normalized profiles were built by dividing each profile into 40 classes equally spaced along the radial direction, each class representing 2·5 % of the total pericarp thickness. Truncated profiles were built by dividing the first 2·5 mm of the pericarp into ten classes, each class representing 250 µm. Profiles of cell-wall surface density were computed by dividing the profile of the surface area for each tomato by the corresponding profile of pericarp volume.
Statistical analysis
Data tables were built from morphological profiles using estimates for either tomatoes or sampling regions as observations, and classes of distance to the epidermis as variables. Principal component analyses (PCAs) were performed on the data tables to reveal similarities between observations. Applied to ordered signals such as morphological profiles, patterns are drawn from principal component loadings. The patterns highlight changes in the original profiles. PCAs were performed within the Matlab environment (The Mathworks, Natick, MA, USA).
Analyses of variance were applied to pericarp thickness to investigate the effect of genotype, of the sampling region and of their interaction, by using the tomato as a random effect. For estimates of whole tomato morphology, only the effect of the genotype was tested. Analyses of estimated profiles were performed on the first five principal components of morphological profiles, testing only the effect of the genotype. The linear models were fitted using the R software version 2.6.2 (R Foundation for Statistical Computing, 2009).
RESULTS
Image acquisition
A 3D image of reconstructed acquisition is represented using volume rendering in Fig. 3A. Because the longest cells were larger than 500 µm, the visualization of entire cells was not possible. The number of optical slices in each stack was variable and the dimensions of the stack were therefore not constant, the number of optical slices ranging from three (22·5 µm) to 11 (82·5 µm). For some tomatoes, it was impossible to acquire 3D images of pericarp (cells were dislocating) or to scan the pericarp outlines (too many holes in the tomato). Images that could not be processed were removed, keeping images from nine fruits of the wild-type and ten fruits of AS-DR12 for further analyses.
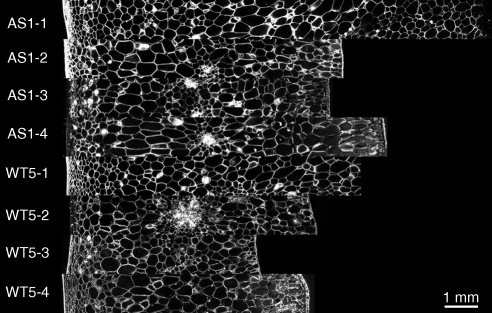
A selection of mosaic images is shown in Fig. 4. Cells exhibited different morphologies depending on their position in the pericarp. Cells located close to the external epidermis are small and orientated in a direction parallel to the epidermis, whereas cells in the median part of the pericarp are large and orientated in a radial direction. In some images, vascular bundles are visible (WT5-2, for example), inducing the presence of a large number of small cells in the middle of the pericarp. Cells near the internal epidermis were often elongated and orientated perpendicular to the epidermis.
Fig. 4.
Example of mosaic images for each sampling region (numbered from 1 to 4) of the wild-type tomato number 5 (WT5) and AS-DR12 tomato number 1 (AS1). External epidermises are on the left. Only the middle slice of the 3D images is shown.
Pericarp thickness was variable, and ranged from 6·5 to 13·5 mm. The internal epidermis was not always observed as it was necessary to cut the samples when radial pericarp was encountered.
Validation of image segmentation
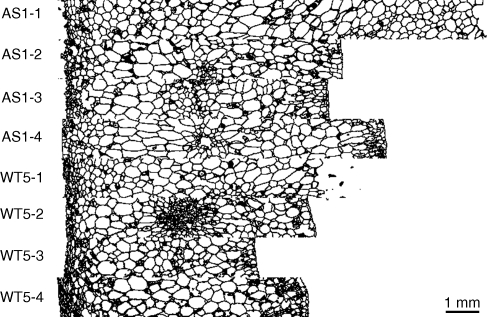
The segmented images corresponding to Fig. 4 are shown in Fig. 5. Cells appeared to be correctly segmented, except in regions containing many small cells. In addition, a large number of intercellular spaces were segmented and appear as cells.
Fig. 5.
Result of the segmentation procedure on the 3D stack images. Same images as in Fig. 4. Only the middle slice of each stack is shown.
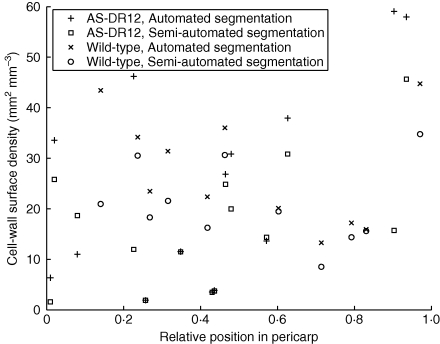
The comparison of 3D cell-wall surface area measurements in binary sub-images and in manually segmented images generally showed a reduction of the measured cell-wall surface area after manual segmentation (Fig. 6). The reduction corresponded on average to 20 % of the cell-wall surface area obtained from automatically segmented images. The differences did not appear to depend on the genotype; it was assumed that they would not interfere with genotype comparison.
Fig. 6.
Measurement of cell-wall surface density in validation images: comparison of automated and semi-automated segmentation. Images are plotted against their distance to the epidermis, normalized by the local pericarp thickness.
Fruit size and pericarp thickness
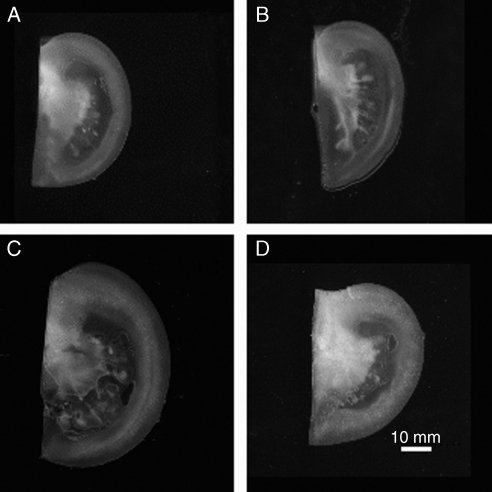
Figure 7 shows examples of quarters from each genotype, illustrating the variability in shape and size of the tomatoes. Tomato meridian lengths measured with a measuring tape were 10·46 cm (s.e. 0·23 cm) for AS-DR12 and 10·18 cm (s.e. 0·26 cm) for the wild-type. They were not found to be significantly different (P = 0·42). When modelling the shape of the tomatoes, meridian lengths were found to be 10·06 cm (s.e. 0·23 cm) for AS-DR12 and 9·41 cm (s.e. 0·13 cm) for the wild-type. The mean values were significantly different (P = 0·031).
Fig. 7.
Examples of tomato quarters for the wild-type (A,B) and for AS-DR12 (C,D) genotypes.
The measures of tomato meridians of the two genotypes did not present significant differences but meridian lengths obtained by modelling showed a difference. This surprising result can be interpreted by considering that modelling used between two and four quarters, whereas the measurement was made only once per tomato. The repetition may have reduced the variability and therefore improved the discriminatory power of the test.
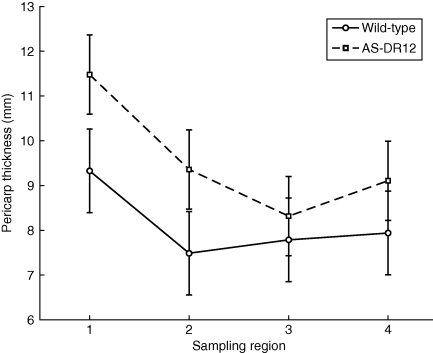
The mean pericarp thickness measured in microscopic images was 8·11 mm (s.e. 0·26 mm) for the wild-type and 9·56 mm (s.e. 0·26 mm) for AS-DR12. This difference was found to be significant (P = 0·0002).
Variations in pericarp thickness depending on the sampling region were investigated (Fig. 8). For the two genotypes, pericarp was found to be thicker for the sampling region close to the pedicel scar. The other sampling regions were not significantly different, although the pericarps of AS-DR12 were thicker than those of the wild-type in all regions.
Fig. 8.
Mean and standard error of the mean of the pericarp thickness plotted according to sampling region.
Estimation for the whole fruit
The mean values and the results of variance analyses for the estimations of total pericarp volume and cell-wall surface area are shown on Table 1. Pericarp volume and cell-wall surface area correspond to the true absolute value estimated for one fruit.
Table 1.
Estimates of pericarp volume, cell-wall surface area and cell-wall surface density
| Sample | Volume (cm3) | Surface area (m2) | Surface area density (mm2 mm−3) |
|---|---|---|---|
| Wild-type | 69·18 | 2·64 | 38·44 |
| s.e. | 4·01 | 0·15 | 1·34 |
| AS-DR12 | 93·25 | 3·51 | 37·80 |
| s.e. | 3·81 | 0·15 | 1·27 |
| P | 0·003 | 0·007 | 0·734 |
The estimated pericarp volume was greater for the AS-DR12 genotype (P = 0·0032), which is in accordance with the results for pericarp thickness. The estimated pericarp volume can be compared with that of a hollow sphere with the same outer diameter. Tomato meridian lengths were 10·06 cm for AS-DR12 and 9·41 cm for the wild-type, which corresponds to outer sphere radii of 3·2 and 3·0 cm, respectively. From the estimations of pericarp volume, pericarp thicknesses for spherical tomatoes would be 10·1 mm for AS-DR12 and 8·1 mm for the wild-type, which is consistent with measured thicknesses.
The surface area estimates of cell walls were found to be 2·64 m2 (s.e. 0·15 m2) for the wild type and 3·51 m2 (s.e. 0·15 m2) for AS-DR12. These values are high because they refer to the cell-wall surface area of all cells in the pericarp. If the tomato pericarp is assumed to contain 10 millions cells of equal diameter (Bertin et al., 2002), the surface area of an individual cell is about 0·35 mm2 for AS-DR12 and 0·27 mm2 for the wild-type. In the case of a spherical cell, this corresponds to diameters of 334 and 290 µm, respectively, which is consistent with the apparent cell size.
The estimated cell-wall surface area of the two genotypes was significantly different (P = 0·0074). This difference may relate to the differences either in pericarp volume or in cell morphology. Cell-wall surface area density assessed as the ratio of cell-wall surface area estimates over pericarp volume estimates were not significantly differences (P = 0·7342). There was no difference in the global cellular morphology of the two genotypes.
This similarity in global cell-wall density is helpful to investigate differences in pericarp volume. The increase in volume may be due to an increase in the number of cells or to a greater mean cell size. As the ratio of estimated cell-wall surface area by estimated pericarp volume did not show significant differences, the cells were assumed to have the same mean size and the increase in the pericarp volume of AS-DR12 was interpreted as being caused by an increase in the number of cells.
Profiles of cell-wall density in pericarp
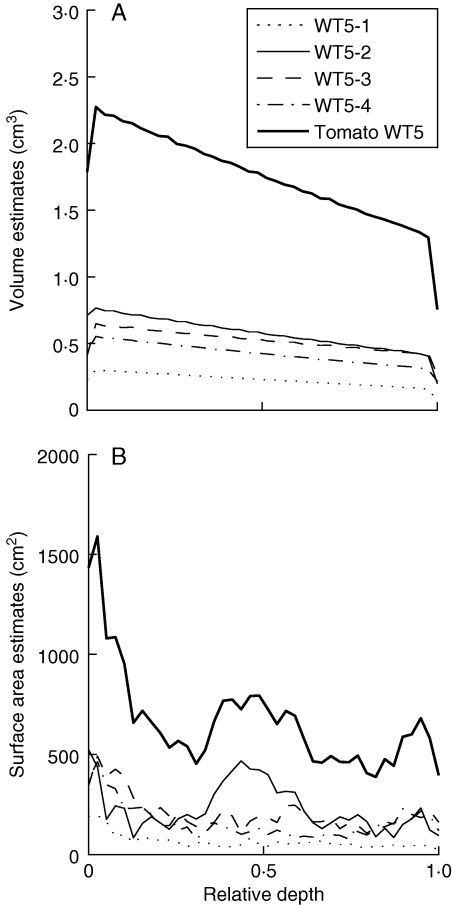
Figure 9 shows profiles of estimated pericarp volume for the tomato WT5. The estimated pericarp volume decreased with the distance to the epidermis. This effect is consistent if one considers the tomato as a ball: the volume of pericarp located at a given distance from the epidermis decreases as the distance to the epidermis grows. The theoretical profile is a quadratic function but appears to be linear due to the limited range of observation (10 mm) compared with the typical radius of a tomato (50 mm).
Fig. 9.
Estimation of (A) pericarp volume and (B) cell-wall surface area for each sampling region of the WT5 tomato and for the whole WT5 tomato. Profiles are plotted against the relative depth of the pericarp, between 0 (the external epidermis) and 1 (the internal epidermis).
The profile of pericarp volume for the whole tomato was obtained by summing the profiles for each sampling region. The estimated pericarp volume was greater for equatorial regions (WT5-2 and WT5-3). Again, this difference could be explained by the shape of the tomato: just as Earth parallels are longer closer to the equator than to the pole, there is more pericarp close to the equator than to the revolution axis of the fruit.
The profile of the cell-wall surface area for the whole tomato was obtained by summing profiles of the surface for each sampling region (Fig. 9B). Variations in the profile can be explained by comparing them with the corresponding 3D images. High values of cell-wall surface area correspond to regions where cells were small, for example close to the epidermises, or when a vascular bundle was encountered (for example, in images WT5-2).
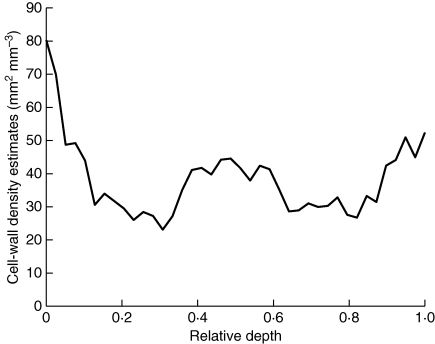
Because the pericarp volume decreases with the distance to the external epidermis, there is also a decrease in the cell-wall surface area profile. To interpret the global variations, profiles of cell-wall surface area were normalized by the profile of pericarp volume. Figure 10 shows the estimated cell-wall surface density profile for the WT5 tomato. Differences between small cells located close to the epidermis and the rest of the pericarp can be seen. A higher cell-wall density is visible in the middle of the pericarp, which corresponds to the vascular bundle for image WT5-2.
Fig. 10.
Profile of cell-wall density estimated for the WT5 tomato.
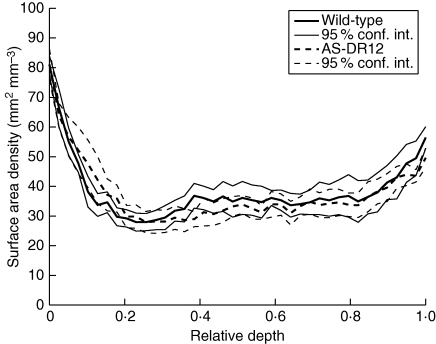
Figure 11 shows mean profiles of estimated cell-wall surface density for each genotype, obtained after averaging over tomatoes and computing a 95 % confidence interval for the mean for each class of distance to the external epidermis. The variability between tomatoes was integrated, revealing different cell-wall surface densities depending on region. The estimated surface area density is maximal close to the external epidermis. It is higher close to the internal epidermis than in the middle of the pericarp. The small cells located close to the epidermis are highlighted from the profiles. A small increase in surface area density is observed in the middle of the profiles, caused by the presence of vascular bundles in some images.
Fig. 11.
Profiles of estimated cell-wall surface density for each class of distance to the epidermis. The profiles are normalized by dividing the whole pericarp thickness into 40 classes. The curves formed by the 95 % confidence intervals for each depth and each genotype are also given.
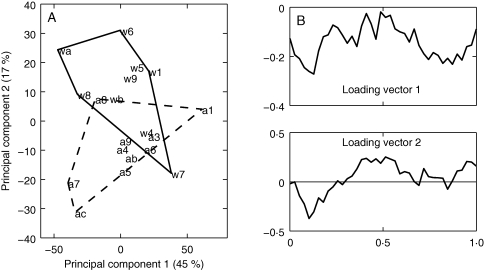
Mean profiles for each genotype do not show large differences. The largest differences are located in the beginning and in the middle of the pericarp. Differences in genotypes that take the whole profiles into account were analysed using PCA. The first two components described 45 and 17 % of inertia, respectively. In Fig. 12A, tomato scores are plotted for the first two principal components. Figure 12B shows the corresponding loadings that allow us to interpret differences between tomatoes. The first component described a general intensity effect: tomatoes located on the left had a lower cell-wall surface density than tomatoes on the right. Analyses of variance did not show any genotype effect.
Fig. 12.
Principal components analysis of morphological profiles of cell-wall surface area estimates for each tomato. (A) Similarity map of the first two principal components. (B) First and second loadings (arbitrary units).
The second component revealed differences in two regions of the pericarp, corresponding to distances between 5 and 20 % and between 35 and 65 % of the pericarp, respectively. Analysis of variance revealed an effect of genotype (P = 0·0066) for this component: AS-DR12 had a greater cell-wall surface density under the epidermis and a lower cell-wall surface density in the middle of the pericarp than the wild-type. The increase in cell-wall surface density was interpreted as being due to the presence of a greater quantity of small cells under the epidermis.
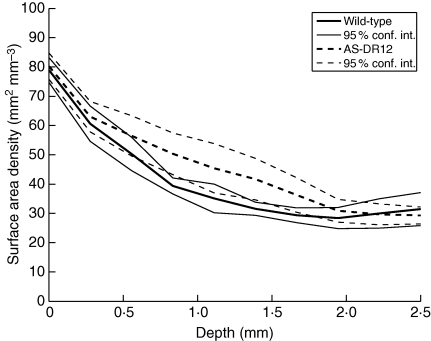
Normalized profiles of cell-wall surface density are well adapted for comparisons of the whole pericarp, but the actual distance to the epidermis and the pericarp thickness was lost during this processing. As the region located beneath the epidermis showed differences, truncated profiles of cell-wall surface density were used to study the first 2·5 mm of the pericarp more precisely. Mean truncated profiles are shown in Fig. 13. Analysis of variance for each depth class revealed differences between the genotypes for the depth classes between 0·75 and 1·75 mm under the epidermis: AS-DR12 showed an increase in cell-wall surface density under the epidermis.
Fig. 13.
Profiles of estimated cell-wall surface density for ten classes of distance to the epidermis. Each depth class represents 250 µm of pericarp. The curves formed by the 95 % confidence intervals for each depth and each genotype are also given.
Both the normalized profiles and the first 2·5 mm of the truncated profiles showed an increase in cell-wall surface density under the external epidermis for AS-DR12. The increase was observed between 0·5 and 2 mm under the epidermis. As this region is known to be the location of cell division (Jones et al., 2002), the difference in the cell-wall surface density may be related to an increase in cell division.
An increase in cell-wall surface density in the middle of the pericarp was observed for the wild-type but the reason for this is not clear. Because the number of images containing vascular bundles was the same for AS-DR12 and the wild-type, this cannot explain the differences. One hypothesis is that cells in the middle of the pericarp that do not belong to vascular bundles are larger in AS-DR12. Another possibility is that vascular bundles are larger in the wild-type, resulting in a greater number of small cells. Regardless, confirmation would require additional data.
DISCUSSION
The present study proposes a quantification method of the 3D cellular morphology of fresh tissue from 3D images. The key points of this method are: (1) the automated image processing procedure, which measures the actual 3D morphology of the cellular structure; (2) integration of the biological variability to quantify the morphology at the fruit scale; and (3) the localization of morphological measurements that could reveal morphological differences in a specific region.
Measurement of 3D morphology
As the aim of the study was to describe 3D morphology, a 3D acquisition device was chosen. An alternative was to use more classical stereological methods, which allow estimation of surface area or volume from measurements on planar slices with random orientation and position. 3D measurements coupled with the appropriate estimation procedure made it possible: (1) to use a sampling design adapted to the shape of the fruit that is more practical, and (2) to determine depths within images and to estimate profiles of surface density with respect to the distance to the epidermis.
An advantage of 3D confocal microscopy is the limited preparation of the sample, making it possible to access the real 3D structure without deformation due to fixation or freezing. Acquisition of 3D images is a time-consuming task compared with 2D acquisition. The complete acquisition of approximately 100 3D images (four images on 24 tomatoes) required 2 weeks of work.
The image segmentation procedure can be easily adapted to other images of 2D or 3D cellular structures. It was applied with few modifications to 2D mosaic images of apple parenchyma. The complete procedure depends on a reduced set of parameters, which can be set up depending on the visible cell-wall width and on image quality.
Image segmentation was a critical step in the quantification procedure because all measurements are based on binary images. Validation of the segmentation procedure was a difficult and time-consuming task. The comparison of automated and semi-automated segmentation gave an estimate of the error in measurements due to the segmentation. The over-measurement of the cell-wall surface area was quite large but the segmentation procedure was difficult to improve any further.
Two morphological parameters were measured and estimated for the whole fruit: the pericarp volume and the cell-wall surface area. Extension to additional parameters is not straightforward as the estimation procedure with a non-uniform sampling probability requires the parameters to have property of convergence in measure after digitization. Parameters such as orientation could possibly be estimated.
The quantification of local 3D heterogeneity would help to describe the global cellular structure of fleshy fruit. Higher-order statistics such as standard deviation could be used but their practical estimation from microscopic images requires further development.
Estimation for the whole fruit
The use of an appropriate sampling procedure, coupled with an adequate estimation method, led to the estimation of geometrical characteristics of the whole pericarp. The differences in sampling probabilities induced by the sampling procedure were taken into account to obtain unbiased estimates of the morphology for each tomato.
The estimation of the 3D morphology of the whole structure is a real advantage compared with the measurement of parameters on planar sections. It allows the comparison of the results obtained with physical measurements, such as cell counting. Moreover, it is crucial to have access to the actual 3D morphological description in order to model cellular structure.
The estimation procedure required computation of the sampling probability for each voxel in the images. This computation was possible for tomato by modelling it with a revolution surface. Practical procedures for other types of surfaces are lacking. Moreover, computation is limited to points located within a small distance (less than the radius of curvature) from the reference surface, making the method most effective for studying the outer layers of smooth organs.
Wide variability in the measurement of the cell-wall surface area was encountered due to the large size of the cells compared with that of the field of view. In order to deal with this variability, several acquisitions were required, making it possible to estimate global morphology together with confidence intervals.
The comparison of estimates obtained with other methods would be of interest. The development of 3D imaging systems allows measurements of 3D morphology (Mebatsion et al., 2009) whose resolution has increased over the years. However, the estimation at the fruit scale is rarely undertaken and, to our knowledge, except for the number of cells in the tomato fruit (Bertin et al., 2002), no reference value for 3D morphological parameters in fruit exist at this time.
Localization of measurements
The use of 3D measurements made it possible to estimate profiles of variation at the fruit scale. Such profiles are valuable tools for describing morphology variations. Hahn et al. (1999) also estimated surface density profiles of gradient structures on planar sections. Their method, however, assumed a horizontal reference surface, and produces biased estimates on curved fruit surfaces. Unbiased profiles obtained from 3D microscopy and biased profiles obtained from Hahn's method were compared in Legland (2005). The global shape of the profiles is similar, but genotypes could be better discriminated when using 3D profiles.
The AS-DR12 genotype was chosen for this study because it exhibited a difference in firmness of the mature fruit compared with the wild-type (Jones et al., 2002). Guillon et al. (2008) investigated the 2D cellular structure on the basis of cell morphological features. The present study investigated the cellular structure of the two genotypes in more depth by estimating the 3D pericarp cellular morphology. The localization of morphology measurements made it possible to identify regions in the pericarp where the cellular density varies, as well as quantifying differences between the genotypes.
The extraction of profiles from 3D images relies on adequate averaging of localized measurements in 3D images. In this study, profiles were normalized with respect to the internal and the external epidermis of the pericarp. An alternative was to consider the absolute distance to one of these. The localization with respect to another reference structure such as the nearest vascular bundle could also be of interest as it clearly induces variation in cell shape, size and organization. The only problem is to be able to locate each pixel with respect to this reference structure.
Four sampling regions were used for each tomato. Because the sampling regions presented both different thicknesses and different cellular morphologies, it would be of interest to produce profiles of variation with the distance to the pedicel scar by using an increased number of sampling regions. If the number of sampling regions is sufficient, it would be possible to develop morphological cartography of the cellular structure that estimates a given morphological parameter as a function both of the distance to the pedicel and of the distance to the pedicel scar.
Additional perspectives
The estimated morphological parameters could be used to generate geometrical models of cellular structure. Coupling such models with mechanical simulations would improve our understanding of the mechanical behaviour of tissues or the fruit as a whole.
The parameters could also be used to study the variations of 3D morphology for different fruit development stages. This approach would help us to better understand fruit development.
ACKNOWLEDGEMENTS
We thank Mathilde Causse for providing the samples used in these experiments. This work was supported by the Sixth Framework Programme of the European Union through the EU-SOL Project.
LITERATURE CITED
- Allan-Wojtas P, Sanford KA, McRae KB, Carbyn S. An integrated micro-structural and sensory approach to describe apple texture. Journal of the American Society for Horticultural Science. 2003;128:381–390. [Google Scholar]
- Allende A, Desmet M, Vanstreels E, Verlinden BE, Nicolaï BM. Micromechanical and geometrical properties of tomato skin related to differences in puncture injury susceptibility. Postharvest Biology and Technology. 2004;34:131–141. [Google Scholar]
- Ancin H, Roysam B, Dufresne TE, et al. Advances in automated 3-D image analysis of cell populations imaged by confocal microscopy. Cytometry. 1996;25:221–234. doi: 10.1002/(SICI)1097-0320(19961101)25:3<221::AID-CYTO3>3.0.CO;2-I. [DOI] [PubMed] [Google Scholar]
- Baddeley A, Jensen EBV. Stereology for statisticians. Boca Raton, FL: Chapman and Hall/CRC; 2005. [Google Scholar]
- Bengough AD, Ijima M, Barlow PW. Image analysis of maize root caps – estimating cell numbers from 2-D longitudinal sections. Annals of Botany. 2001;87:693–698. [Google Scholar]
- Bertin N, Gautier H, Roche C. Number of cells in tomato fruit depending on fruit position and source–sink balance during plant development. Plant Growth Regulation. 2002;36:105–112. [Google Scholar]
- Bertin N, Borel C, Brunel B, Cheniclet C, Causse M. Do genetic make-up and growth manipulation affect tomato fruit size by cell number, or cell size and DNA endoreduplication? Annals of Botany. 2003;92:415–424. doi: 10.1093/aob/mcg146. [DOI] [PMC free article] [PubMed] [Google Scholar]
- Bruce DM. Mathematical modelling of the cellular mechanics of plants. Philosophical Transactions of the Royal Society B. 2003;358:1437–1444. doi: 10.1098/rstb.2003.1337. [DOI] [PMC free article] [PubMed] [Google Scholar]
- Bünger-Kibler S, Bangerth F. Relationship between cell number, cell size and fruit size of seeded fruits of tomato (Lycopersicon esculentum Mill.), and those induced parthenocarpically by the application of plant growth regulators. Plant Growth Regulation. 1983;1:143–154. [Google Scholar]
- Cano-Medrano R, Darnell RL. Cell number and cell size in parthenocarpic vs. pollinated blueberry (Vaccinium ashei) fruits. Annals of Botany. 1997;80:419–425. [Google Scholar]
- Carpenter AE, Jones TR, Lamprecht MR, et al. CellProfiler: image analysis software for identifying and quantifying cell phenotypes. Genome Biology. 2006;7:R100. doi: 10.1186/gb-2006-7-10-r100. [DOI] [PMC free article] [PubMed] [Google Scholar]
- Causse M, Saliba-Colombani V, Lecomte L, Duffé P, Rousselle P, Buret M. QTL analysis of fruit quality in fresh market tomato: a few chromosome regions control the variation of sensory and instrumental traits. Journal of Experimental Botany. 2002;53:2089–2098. doi: 10.1093/jxb/erf058. [DOI] [PubMed] [Google Scholar]
- Causse M, Duffé P, Gomez MC, et al. A genetic map of candidate genes and QTLs involved in tomato fruit size and composition. Journal of Experimental Botany. 2004;55:1671–1685. doi: 10.1093/jxb/erh207. [DOI] [PubMed] [Google Scholar]
- Chaïb J, Devaux M-F, Grotte M-G, et al. Physiological relationships among physical, sensory, and morphological attributes of texture in tomato fruits. Journal of Experimental Botany. 2007;58:1915–1925. doi: 10.1093/jxb/erm046. [DOI] [PubMed] [Google Scholar]
- Cheniclet C, Rong WY, Causse M, et al. Cell expansion and endoreduplication show a large genetic variablilty in pericarp and contribute strongly to tomato fruit growth. Plant Physiology. 2005;139:1984–1994. doi: 10.1104/pp.105.068767. [DOI] [PMC free article] [PubMed] [Google Scholar]
- Coombe BG. The development of fleshy fruits. Annual Review of Plant Physiology. 1976;27:207–228. [Google Scholar]
- Devaux M-F, Bouchet B, Legland D, Guillon F, Lahaye M. Macro-vision and grey level granulometry for quantification of tomato pericarp structure. Postharvest Biology and Technology. 2008;47:199–209. [Google Scholar]
- Esau K. Anatomy of seed plants. New York: John Wiley & Sons; 1977. [Google Scholar]
- Fazekas A, Dendievel R, Salvo L, Bréchet Y. Effect of microstructural topology upon the stiffness and strength of 2D cellular structures. International Journal of Mechanical Sciences. 2002;44:2047–2066. [Google Scholar]
- Fromont L, Devaux M-F, Barba D. 9th European Congress for Stereology and Image Analysis. 10–13 May 2005, Zakopane (Poland): Polish Society for Stereology; 2005. Three-dimensional assembling of confocal images using multiresolution pyramids; pp. 71–78. Chraponski J, Cwajna J, Wojnar L. eds. [Google Scholar]
- Giovannoni JJ. Genetic regulation of fruit development and ripening. Plant Cell. 2004;16:170–180. doi: 10.1105/tpc.019158. [DOI] [PMC free article] [PubMed] [Google Scholar]
- Giovannoni JJ, Yen H, Shelton B, et al. Genetic mapping of ripening and ethylene-related loci in tomato. Theoretical and Applied Genetics. 1999;98:1005–1013. [Google Scholar]
- Gray JD, Kolesik P, Hoj PB, Coombe BG. Confocal measurement of the three-dimensional size and shape of plant parenchyma cells in a developing fruit tissue. Plant Journal. 1999;19:229–236. doi: 10.1046/j.1365-313x.1999.00512.x. [DOI] [PubMed] [Google Scholar]
- Guillemin F, Devaux M-F, Guillon F. Evaluation of plant histology by automatic clustering based on individual cell morphological features. Image Analysis and Stereology. 2004;23:13–22. [Google Scholar]
- Guillon F, Sully P, Bouchet B, et al. Down-regulation of an Auxin Response Factor in the tomato induces modification of fine pectin structure and tissue architecture. Journal of Experimental Botany. 2008;59:273–288. doi: 10.1093/jxb/erm323. [DOI] [PubMed] [Google Scholar]
- Guines F, Julier B, Ecalle C, Huyghe C. Among and within-cultivar variability for histological traits of lucerne. Euphytica. 2003;130:293–301. [Google Scholar]
- Gundersen HJG. Stereological estimation of the volume-weighted mean volume of arbitrary particles observed on random sections. Journal of Microscopy. 1985;138:127–142. doi: 10.1111/j.1365-2818.1985.tb02607.x. [DOI] [PubMed] [Google Scholar]
- Gundersen HJG. Stereology of arbitrary particles. Journal of Microscopy. 1986;143:3–45. [PubMed] [Google Scholar]
- Hahn U, Micheletti A, Pohlink R, Stoyan D, Wendrock H. Stereological analysis and modelling of gradient structures. Journal of Microscopy. 1999;195:113–124. doi: 10.1046/j.1365-2818.1999.00487.x. [DOI] [PubMed] [Google Scholar]
- Harada T, Kurahashi W, Yanai M, Wakasa Y, Satoh T. Involvement of cell proliferation and cell enlargement in increasing the fruit size of Malus species. Scientia horticulturae. 2005;105:447–456. [Google Scholar]
- Higashi K, Hosoya K, Ezura H. Histological analysis of fruit development between two melon (Cucumis melo L-reticulatus) genotypes setting a different size of fruit. Journal of Experimental Botany. 1999;50:1593–1597. [Google Scholar]
- Horiguchi G, Fujikura U, Ferjani A, Ishikawa N, Tsukaya H. Large-scale histological analysis of leaf mutants using two simple leaf observation methods: identification of novel genetic pathways governing the size and shape of leaves. Plant Journal. 2006;48:638–644. doi: 10.1111/j.1365-313X.2006.02896.x. [DOI] [PubMed] [Google Scholar]
- Jackman RL, Stanley DW. Perspectives in the textural evaluation of plant foods. Trends in Food Science and Technology. 1995;6:187–194. [Google Scholar]
- Jensen EB, Gundersen HJG. The stereological estimation of moments of particle volume. Journal of Applied Probability. 1985;22:82–98. [Google Scholar]
- Jones B, Frasse P, Olmos E, et al. Down-regulation of DR12, an auxin-response-factor homolog, in the tomato results in a pleiotropic phenotype including dark green and blotchy ripening fruit. Plant Journal. 2002;32:603–613. doi: 10.1046/j.1365-313x.2002.01450.x. [DOI] [PubMed] [Google Scholar]
- Kervrann C, Legland D, Pardini L. Robust incremental compensation of the light attenuation with depth in 3D fluorescence microscopy. Journal of Microscopy. 2004;214:297–314. doi: 10.1111/j.0022-2720.2004.01333.x. [DOI] [PubMed] [Google Scholar]
- Knee M. Fruit quality and its biological basis. Oxford: Wiley-Blackwell; 2002. [Google Scholar]
- Konstankiewicz K, Pawlak K, Zdunek A. Quantitative method for determining cell structural parameters of plant tissues. International Agrophysics. 2001;16:161–164. [Google Scholar]
- Lang C, Ohser J, Hilfer R. On the analysis of spatial binary images. Journal of Microscopy. 2001;203:303–313. doi: 10.1046/j.1365-2818.2001.00899.x. [DOI] [PubMed] [Google Scholar]
- Legland D. Morphométrie de structures cellulaires biologiques partiellement observées par imagerie 3D. 2005. PhD Thesis, Université René Descartes – Paris V, France. Available online: http://tel.archives-ouvertes.fr/tel-00081554/en/ , last accessed 20 October 2009. [Google Scholar]
- Legland D, Devaux M-F. Détection semi-automatique de cellules de fruits charnus observés par microscopie confocale 2D et 3D. Cahiers techniques de l'INRA, numéro spécial imagerie, 2009 in press. Available online: http://www.inra.fr/content/download/18562/289936/ version/1/file/07_Legland_imag.pdf . [Google Scholar]
- Legland D, Kiêu K, Devaux M-F. Computation of Minkowski measures on 2D and 3D binary images. Image Analysis and Stereology. 2007;26:83–92. [Google Scholar]
- Legland D, Devaux M-F, Kiêu K, Bouchet B. Stereological estimation for layered structures based on slabs perpendicular to a surface. Journal of Microscopy. 2008;232:44–55. doi: 10.1111/j.1365-2818.2008.02080.x. [DOI] [PubMed] [Google Scholar]
- Lelièvre J-M, Latché A, Jones B, Bouzayen M, Pech J-C. Ethylene and fruit ripening. Physiologia Plantarum. 1997;101:727–739. [Google Scholar]
- McAtee P, Hallett IC, Johnston JW, Schaffer RJ. A rapid method of fruit cell isolation for cell size and shape measurements. Plant Methods. 2009;5:5–11. doi: 10.1186/1746-4811-5-5. [DOI] [PMC free article] [PubMed] [Google Scholar]
- Mebatsion HK, Verboven P, Verlinden BE, Ho QT, Nguyen TA, Nicolaï BM. Microscale modelling of fruit tissue using Voronoi tessellations. Computers and Electronics in Agriculture. 2006;52:36–48. [Google Scholar]
- Mebatsion HK, Verboven P, Ho QT, Verlinden BE, Nicolaï BM. Modelling fruit (micro)structures, why and how? Trends in Food Science and Technology. 2008;19:59–66. [Google Scholar]
- Mebatsion HK, Verboven P, Melese Endalewa A, Billen J, Ho QT, Nicolaï BM. A novel method for 3-D microstructure modeling of pome fruit tissue using synchrotron radiation tomography images. Journal of Food Engineering. 2009;93:141–148. [Google Scholar]
- Mendoza F, Verboven P, Mebatsion HK, Kerckhof G, Wevers M, Nicolaï B. Three-dimensional pore space quantification of apple tissue using X-ray computed microtomography. Planta. 2007;226:559–570. doi: 10.1007/s00425-007-0504-4. [DOI] [PubMed] [Google Scholar]
- Ohser J, Steinbach B, Lang C. Efficient texture analysis of binary images. Journal of Microscopy. 1998;192:20–28. [Google Scholar]
- Olmstead JW, Iezzoni AF. Genotypic differences in sweet cherry fruit size are primarily a function of cell number. Journal of the American Society for Horticultural Science. 2007;132:697–703. [Google Scholar]
- R Development Core Team. R: A Language and Environment for Statistical Computing. 2009 R Foundation for Statistical Computing, Vienna, Austria. Available online: http://www.R-project.org . [Google Scholar]
- Ramamurty U, Paul A. Variability in mechanical properties of a metal foam. Acta Materialia. 2004;52:869–876. [Google Scholar]
- Redgwell RJ, MacRae E, Hallet I, Fisher M, Oerry J, Harker R. In vivo and in vitro swelling of cell walls during fruit ripening. Planta. 1997;203:162–173. [Google Scholar]
- Serra J. Image analysis and mathematical morphology. Vol. 1. London: Academic Press; 1982. [Google Scholar]
- Shibata D. Genome sequencing and functional genomics approaches in tomato. Journal of General Plant Pathology. 2005;71:1–7. [Google Scholar]
- Soille P. Morphological image analysis. New York: Springer; 2003. [Google Scholar]
- Tanksley SD. The genetic, developmental, and molecular bases of fruit size and shape variation in tomato. The Plant Cell. 2004;16:181–189. doi: 10.1105/tpc.018119. [DOI] [PMC free article] [PubMed] [Google Scholar]
- Thompson AJ, Tor M, Barry CS, et al. Molecular and genetic characterization of a novel pleiotropic tomato-ripening mutant. Plant Physiology. 1999;120:383–390. doi: 10.1104/pp.120.2.383. [DOI] [PMC free article] [PubMed] [Google Scholar]
- Verboven P, Kerckhofs G, Mebatsion HK, et al. Three-dimensional gas exchange pathways in pome fruit characterized by synchrotron X-ray computed tomography. Plant Physiology. 2008;147:518–527. doi: 10.1104/pp.108.118935. [DOI] [PMC free article] [PubMed] [Google Scholar]
- Zanchin A, Bonghi C, Casadoro G, Ramina A, Rascio N. Cell enlargement and cell separation during peach fruit development. International Journal of Plant Sciences. 1994;155:49–56. [Google Scholar]
- Zhang C, Tanabe K, Wang S, Tamura F, Yoshida A, Matsumoto K. The impact of cell division and cell enlargement on the evolution of fruit size in Pyrus pyrifolia. Annals of Botany. 2006;98:537–543. doi: 10.1093/aob/mcl144. [DOI] [PMC free article] [PubMed] [Google Scholar]
- Zhu HX, Windle AH. Effects of cell irregularity on the high strain compression of open-cell foams. Acta Materialia. 2002;50:1041–1052. [Google Scholar]


