

Abstract
Using a threshold model where a minimum level of host viremia is necessary to infect vectors affects our assessment of the relative importance of different host species in the transmission and spread of these pathogens. Other models may be more accurate descriptions of the relationship between host viremia and vector infection. Under the threshold model, the intensity and duration of the viremia above the threshold level is critical in determining the potential numbers of infected mosquitoes. A probabilistic model relating host viremia to the probability distribution of virions in the mosquito bloodmeal shows that the threshold model will underestimate the significance of hosts with low viremias. A probabilistic model that includes avian mortality shows that the maximum number of mosquitoes is infected by feeding on hosts whose viremia peaks just below the lethal level. The relationship between host viremia and vector infection is complex, and there is little experimental information to determine the most accurate model for different arthropod–vector–host systems. Until there is more information, the ability to distinguish the relative importance of different hosts in infecting vectors will remain problematic. Relying on assumptions with little support may result in erroneous conclusions about the importance of different hosts.
Keywords: viremia, vector infection, arboviruses, epidemiology
In many vector-borne zoonotic diseases, it can be difficult to determine the relative importance of different vertebrate hosts that serve as the reservoir or amplification hosts. Determining which species of vertebrates in a given environment serve as a source of the pathogen for vectors is essential for understanding the epidemiology of vector-borne diseases. Such information would allow a more precise understanding of the transmission cycle and how it changes in space and time and improve prediction and control strategies. Although this is a common problem in most vector-borne diseases with zoonotic reservoirs, we consider mosquito-borne arboviruses herein.
Which vertebrate species contribute the most to vector infection depends on their abundance, their frequency of contact with the vector, and their ability or competence in infecting the vector. Criteria for implicating vertebrates as reservoir hosts have been suggested (Milby and Reeves 1990, Woodring et al. 1996), but it is often difficult to interpret the roles of different species in systems with many potential hosts contributing to the epidemiological cycle. Host competence can be measured by laboratory studies or is inferred from the levels of the virus in the host blood. Although there have been many studies indicating that this is a complex, dynamic relationship (Hardy and Reeves 1990a,b; Brault et al. 2004; Reisen et al. 2005), it is sometimes assumed that the vertebrate species with the highest average virus load circulating in the peripheral blood is likely to be the most important for virus epidemiology. This may be true in some cases but may underestimate the epidemiological importance of other species.
The arboviruses addressed herein, although sharing the characteristics that the primary vectors are mosquitoes and the primary zoonotic hosts are avians, differ substantially in other attributes. The recently introduced West Nile virus (family Flaviviridae, genus Flavivirus, WNV) is unusual in that it causes significant avian mortality (Bernard et al. 2001, Hadler et al. 2001, Kulasekera et al. 2001, McLean et al. 2001, Petersen and Roehrig 2001, Swayne et al. 2001) and exceptionally high viremias in some bird species (Work et al. 1955, Komar et al. 2003, Weingartl et al. 2004, Reisen et al. 2005). In contrast, St. Louis encephalitis virus (family Flaviviridae, genus Flavivirus, SLEV) usually does not cause avian mortality and typically produces low-to-moderate viremias (Sudia and Chamberlain 1959; Aguirre et al. 1992; Reisen et al. 1994, 2001). The equine encephalitides eastern (family Togaviridae, genus Alphavirus, EEEV) and western (family Togaviridae, genus Alphavirus, WEEV) equine encephalomyelitis viruses typically show low-to-moderate avian viremias, rarely with mortality in native birds (Kissling et al. 1954; Hardy and Reeves 1990a; Aguirre et al. 1992; Reisen et al. 1994, 2001; McLean et al. 1995). However, high viremias and high mortality have been observed in experimental infections in some avian species (Kissling et al. 1954; Hardy and Reeves 1990a).
There have been many studies on the vector competence of different mosquito species for various arboviruses. In the laboratory, these mosquitoes are fed on artificial bloodmeals, infected hosts, or a combination, in this case, primarily birds, and then tested for infection, dissemination, or transmission. By also testing the birds or bloodmeal source for viral titer, the relationship between viremia titer and mosquito infection is inferred. However, it has been observed (Kramer et al. 1981, Hardy and Reeves 1990a) that infection and transmission rates are higher when viremic hosts are used as the bloodmeal source. The experimental design used, sample sizes, and resulting estimates of mosquito infection rates and thresholds for infection vary greatly (Chamberlain et al. 1954, 1959; Jupp 1976; Jupp et al. 1986; Turell et al. 2005). However, relatively few studies have examined transmission to mosquitoes over a sufficient range of viremias to determine the shape of the relationship between vector infection and host viremia. Hardy and Reeves (1990b) (and references therein) examined the relationship between viremia and infection rate for many strains of WEEV and SLEV, mosquito species, and populations and host species, whereas Jupp (1976) and Jupp et al. (1986) used three or more viremia levels of WNV and Sindbis virus to study infection in South African Culex species. However, the shape of the relationship between host viremia and mosquito infection rates is still unknown for many combinations of host, virus, and vector species.
The assumption that there are threshold host viremias needed to infect different mosquito species has been prominent in determining which bird and mosquito species contribute most to WNV transmission (Turell et al. 2005). Although authors often acknowledge that other factors play a role (Turell et al. 2005), discussion frequently then focuses on the corvids, which generally develop extremely high viremias, and hosts developing lower viremias are considered of lesser or no importance epidemiologically. The assumption of a threshold for infection underlies the assertion that hosts with viremias below such a threshold can be considered “dead end” hosts and play no role in the epidemiology of the virus. The infection of vectors should be considered in a probabilistic sense; at any given viremia, there is some probability that the vector will become infected. This probability may approach 0 at low viremias and 1 at high viremias but may or may not actually reach either limit. This then calls into question any possibility of a dead end host or a “safe dose” of virus (Reisen et al. 2005).
A complex series of events is required for a mosquito to become infected and then to be able to transmit an arbovirus. The mosquito must find a host and that host must have an active viremia. Sufficient virus must be imbibed during the bloodmeal for virions to migrate through the bloodmeal to the midgut wall, attach to receptors, and penetrate the midgut. This is likely to depend not only on the number of virions ingested in the bloodmeal but also on movement of virus within the bloodmeal, components of saliva and plasma, or other factors. Virus must be able to replicate in the hemocoel and other tissues and then virions must spread to the salivary glands, penetrate the salivary epithelium, and replicate sufficiently to deliver an infectious dose to a susceptible host during the next bloodmeal (Hardy et al. 1983, Lehane 1991). The number of infected mosquitoes produced from a single infected bird depends on the efficiency of each of these events plus the number of mosquitoes feeding on the host and the duration of the host viremia. There may be interactions between the intensity and duration of host viremia, dependent on the susceptibility of the host to the virus and other immunological factors. We currently do not have a sufficient understanding of many of these processes for many virus–host–vector combinations.
Mosquito infection after an infectious bloodmeal may follow a threshold model or some variant, but other relationships are likely (Hardy and Reeves 1990a, Reisen et al. 2005; Fig. 1). Similarly, the relationship between the intensity and duration of host viremia may vary among species. Assuming a threshold relationship between host viremia and mosquito infection or that hosts with the highest viremia are the most important may result in incorrect assessments of which host species are contributing to the population of infected mosquitoes and which bird species play a prominent role in the geographical distribution of the virus. This then decreases our ability to understand arbovirus epidemiology, to assess risk, and to design disease control programs. Interestingly, Chamberlain et al. (1954) used the term “threshold” to refer to the viremia that would infect 1–5% of the vectors rather than the all-or-nothing model often currently described as a threshold. Although biologically more informative, Chamberlain's definition does not fit the conventional or mathematical use of the term threshold. We use the term in the mathematical sense such that infection does not occur below the threshold. We use Chamberlain's definition in developing alternative models. Herein, we model the relationships between host viremia and mosquito infection to explore the importance of the assumptions used to assess relative host importance. We focus on conditions that make it more likely that hosts that produce lower viremias contribute significantly to infection of vectors.
Fig. 1.

Possible shapes for the relationship between host viremia and the probability of infection of a mosquito. Solid line, threshold; see equation 1 in the text, with vT = 5 (log PFU/ml). Dashed line, sigmoidal; see equation 9 in the text. Dotted line, exponential; P(inf) = exp(−0.4v). Parameter values were chosen simply for illustration to demonstrate some possible shapes for the relationship.
Materials and Methods
We developed a series of models examining factors including the relationship between maximum viremia and the duration of viremia, the probability of virions in the bloodmeal taken up from the host, and host mortality. These are simple mathematical equations examined analytically and graphically. Models were numerically solved for illustration using either Maple version 8 (Waterloo Maple Inc., Waterloo, Ontario, Canada) or Excel Professional 2003 (Microsoft, Redmond, WA). Each model is outlined below. For simplicity, it was assumed that a host, herein a bird, received 100 mosquito bites per day, and there was no effect of host infection or level of viremia on the number of bites a host received. In addition, we assumed that all infected mosquitoes can transmit virus. There is evidence that the dose of virus ingested can affect the transmission rate as well as the dissemination or infection rate (Kramer et al. 1981, Reisen et al. 2005); however, there is little information available. These assumptions were made to focus attention on the relationship between viremia and vector infection, and the consequences of changing these assumptions will be examined in future work. Parameters are listed in Table 1.
Table 1. Model parameters.
| Parameter | Description | Used in model |
|---|---|---|
| v | Viremia (log PFU/ml) | I, II, III |
| vT | Threshold viremia (log PFU/ml) | I |
| d | Duration of viremia, d | I, II, III |
| Ninf | No. infected mosquitoes | I, II, III |
| B | No. mosquito bites per day per host | I, II, III |
| P(inf) | Probability of a mosquito becoming infected | I, II, III |
| z, Z | No. virions | II |
| Zcrit | Critical number of virions needed for infection | II |
| z̄ | Avg no. of virions | II |
| σ | SD of virion distribution | II |
| vp | Theoretical peak viremia (log virions/ml) | III |
| t | Time since infection, d | III |
| s | Regulates duration of viremia | III |
Model I: Threshold for Infection
We assumed that mosquito infection exhibited a threshold response where all mosquitoes are infected above a threshold of viremia, and below this level no mosquitoes are infected (Fig. 1, solid line). This model is used to infer dead end hosts or hosts that do not develop sufficient viremia to infect mosquitoes and therefore play no role in the infection of mosquitoes with an arbovirus. It is an extreme case and is used to develop the baseline for comparison with the other models and to consider the consequences of a true threshold for vector infection. If P(inf) is the probability of infection of a mosquito that bites a host with viremia v and vT is the threshold viremia required for infection, then
| [1] |
We then consider the effect of two different relationships between the duration (d) and intensity of viremia (v). For simplicity, the viremia is assumed to be constant during the entire infectious period. In the first case, we assume that the duration of the host viremia above the threshold for infection lasts longer with increasing viremias. This is modeled by a linear equation in our example, with parameters set to result in a duration of 5 d when the viremia is five log10 virions/ml:
| [2] |
The second case considered is the reverse, where higher intensities of virus occur with shorter duration of infection above the threshold. This may occur if birds die as a result of the high viremia. Again, we use a linear equation with parameters set to give d = 5 when v = 5:
| [3] |
Note that these examples are chosen purely for purposes of illustration; many other relationships, both linear and nonlinear, between d and v are possible. We then calculate the number of infected mosquitoes produced by one infected bird (Ninf) as
| [4] |
where B is the number of mosquito bites per day on a host (set at B = 100 for all examples shown herein).
Model II: Probabilistic Model
Infection of a mosquito likely depends on the dose of virus (number of virions) ingested during the bloodmeal. Low host viremias, e.g., 102 PFU/ml, will result in a high percentage of mosquito bloodmeals that contain no or very few virions assuming virions are randomly distributed in the blood. Therefore, the likelihood of vector infection depends not only on the number of virions in a vector bloodmeal (a probability distribution based on the overall viremia and the size of the bloodmeal) but also on the distribution of virions in the blood, movement of virions within the midgut, receptor interactions, and facilitation or inhibition by salivary or immunological components. Observed nonrandom distributions of virus in bloodmeals (Weaver et al. 1993) are likely to be the result of virus movement during digestion, but the effects of this on vector infection are not known. Herein, we consider one potential scenario: a random distribution of virions in the blood, such that the number of virions per microliter blood follows a normal distribution with mean z̄ (Fig. 2a), a 5-μl bloodmeal volume, and a viremia lasting 5 d (with the same distribution of virions in the blood on each day). We then examine the probability that a mosquito becomes infected after ingesting a bloodmeal sampled from a host with mean z̄ over a range of virions needed for successful infection of the mosquito. Note that 500 virions in a 5-μl bloodmeal is equivalent to an overall host viremia of 105 virions/ml or 5 logs of virus. Thus, the probability of Z virions in the bloodmeal is the probability density function (pdf) of the normal distribution:
Fig. 2.

Theoretical distributions of virions per bloodmeal and the resulting probability of infection. (a) Normal probability distribution with mean z̄ and standard deviation √z; see equation in the text. (b) Probability of infection given the distribution in (a) and the number of virions required to infect a mosquito; the full equation is given in the text.
| [5] |
The probability of infection then depends on the number of virions needed to infect the mosquito, Zcrit. Note that Zcrit is a threshold, but that in this model the threshold is acting at a finer level (the mosquito gut). The goal of this probability model is to investigate the effect of the probability of having different numbers of virions in the bloodmeal. The probability of less than Zcrit virions in the bloodmeal is the cumulative density function (cdf); therefore, the probability of at least Zcrit virions in the bloodmeal is
| [6] |
The cdf of the normal distribution cannot be solved analytically and was estimated numerically using the cdf(normal) routine in Maple.
Figure 2b shows the probability of infection for different values of z̄ and Zcrit. Note that these curves are sigmoidal in shape, similar to some experimental results (Hardy and Reeves 1990b, Reisen et al. 2005) and similar in principle to the idea of Chamberlain et al. (1954) of a threshold where 1–5% of the vectors are infected.
The number of infected mosquitoes from one bird is then
| [7] |
Model III: Probabilistic Model with Bird Mortality
In this model, viremia changes over time in an individual host, and high viremias kill the host. We assume that viremias >8 log10 virions/ml are lethal. We use three examples of possible patterns of viremia (Fig. 3a). These patterns could represent averages for three different host species, populations within a host species, or three different individuals. For convenience, we treat them as three representative individuals of three different species: one individual with low susceptibility, developing a low viremia that resolves after 10 d (species 1); one individual with moderate susceptibility and a higher titer viremia (species 2); and a third individual that is highly susceptible to the virus, developing high titers and dying quickly (species 3). We differentiate the curves by considering the theoretical peak viremias (vp); the peak viremia that would be achieved if the host did not die (see the dashed lines in Fig. 3a). Mathematically, the patterns are calculated as
Fig. 3.

Probabilistic model with bird mortality. (a) Viremia over time. Three possible patterns are shown, designated by the theoretical peak viremia, vp. See text for equations. Species 1, vp = 5; species 2, vp = 8; species 3, vp = 10. In all cases, the birds die when v ≥8. (b) Probability of mosquito infection at different viremias. This curve is based on the model shown in Fig. 2b but is formulated mathematically using equation 9 in the text for convenience. (c) Probability of mosquito infection over the time course of bird viremia.
| [8] |
where t is the day postinfection, and s is a parameter describing the duration of the viremia. For all examples shown here, the peak viremia occurs on day 5 after infection. Note that the shape and equation of these curves were chosen for convenience; other patterns for viremia over time are possible and indeed probable. Similar results to ours will be obtained with any shape for viremia over time which is concave down, i.e., rises to a peak and then declines back to zero.
For simplicity, we assume that the probability of infection is related to viremia by a sigmoidal function (Fig. 3b). This is based on the curves developed in model II, but it is described by the equation
| [9] |
The parameter values for this equation were chosen to give a mosquito infection rate of 50% at a host viremia of 5 log10 virions/ml.
By substitution, the probability of infection over time is (Fig. 3c):
| [10] |
As in models I and II, Ninf is then given by
| [11] |
Results
Model I: Threshold for Infection
With a threshold viremia for mosquito infection, the number of mosquitoes infected depends on the relationship between the duration and the intensity of host viremia (Fig. 4a and b). If the duration of infectiousness increases with peak viremia, the number of infected mosquitoes also increases with viremia. In this case, birds with the highest viremias contribute the most to the population of infected mosquitoes (Fig. 4a). If, however, higher levels of viremia also have shorter durations, birds with viremias at the threshold for mosquito infection contribute the most infected mosquitoes (Fig. 4b).
Fig. 4.

Results from model I. (a) Number of infected mosquitoes produced from one infected bird assuming that the duration of infectiousness increases with the level of viremia. The surface shows the number of infected mosquitoes given different levels of constant viremia in the host and different thresholds required for mosquito infection. (b) The same surface but when the duration of infectiousness decreases with the level of viremia. See text for details and equations.
Model II: Probabilistic Model
With the probabilistic model of infection, the number of mosquitoes infected is dependent on the viremia in the blood, which determines the probability of different numbers of virions in different bloodmeals, and the number of virions required for vector infection (Fig. 5). If this model is more accurate, assuming there is a threshold viremia for vector infection will miss significant contributions to the infected mosquito population from birds with viremias below the assumed threshold.
Fig. 5.
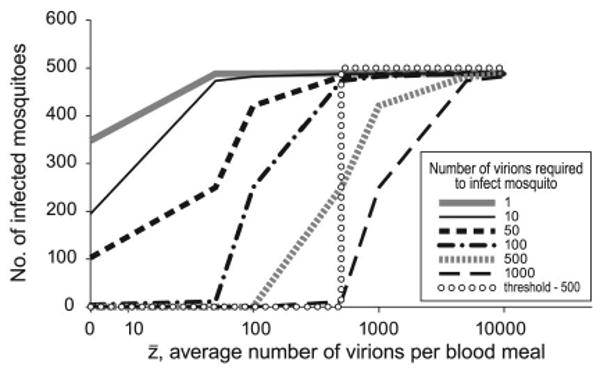
Results from model II. If a threshold model (dotted line) is assumed, but the true curve follows model II, the number of infected mosquitoes produced will be underestimated (the area under each curve to the left of the dotted line). This underestimate increases when fewer virions are required to infect a mosquito or if the threshold under model I is assumed to be higher.
Model III: Probabilistic Model with Bird Mortality
If high viremias cause bird mortality, the probability of infection goes to zero at the lethal viremia (when the bird dies) in the time course of the infection. As a result, birds whose peak viremia occurs just below the lethal level produce the highest number of infected mosquitoes (Fig. 6). In our example, we considered three species of birds, but this lethal level may vary between individuals of the same species or populations as well.
Fig. 6.

Results from model III. The maximum number of infected mosquitoes is produced when the theoretical peak viremia is just below the lethal level.
Discussion
The models and examples shown here indicate that the relationship between host viremia and resulting number of infected mosquitoes is complex. These cases were not chosen to reflect a particular species of host, vector, or virus, because the data necessary for this level of accuracy are not available for many combinations of virus, vector, and host. Rather, they were chosen to illustrate different scenarios that may occur and to demonstrate that there are conditions where hosts with low viremias may contribute significantly to the population of infected vectors. The relative frequency of these conditions compared with conditions where birds with higher viremias are more important is unknown and will require detailed fieldwork on the relative abundances of bird species and host choice by mosquitoes. The assumption that there is a threshold level of viremia below which a vector species will not be infected needs to be evaluated. Further data on the relationships between the intensity and duration of viremia, host mortality levels, and vector infection are needed for accurate assessment of the relative importance of different vertebrate hosts. Variation among individual hosts, as well as at the population and species level, also needs to be considered.
Support for a threshold model of vector infection is often inferred from studies that have not fully considered the effect of host viremia and low sample sizes of vectors to determine the infection rates. The difficulty in conducting these experiments, particularly with human pathogens, prohibits extensive but essential studies of the dose–response between host viremia and vector infection for all possible combinations of viruses, vectors, and hosts. However, these types of studies are needed to accurately assess the importance of different species in virus epidemiology.
The statistical methodology required to accurately assess the parameters and shape of these relationships is not trivial and has not been well developed for this specific problem. There has been extensive work on statistics for dose–response relationships in the medical literature, mostly in cancer research (Williams 1988, Neuhäuser and Hothorn 1999, Hothorn and Bretz 2000, Bretz and Hothorn 2002). More research on this issue for arbovirus infection rates is needed, particularly for estimation of sample sizes needed to detect differences.
Currently, almost all vector competence experiments characterizing the relationship between host viremia and vector infection suffer because of the low numbers of mosquitoes used in the test. Below viremias of 103 virions/ml, there will be many bloodmeals that contain no virions or very few virions because of chance alone and hence few mosquitoes will become infected. Tabachnick et al. (1996) showed that only 35% of Culicoides sonorensis Wirth & Jones intrathoracically inoculated with 0.2-μl aliquots of blood from a host with a viremia of 3 log10 plaque-forming units (PFU)/ml of bluetongue virus became infected. This is consistent with the random distribution of virus in the blood because the expected distribution of virions (based on a Poisson distribution) resulted in ≈65% of the inoculums not containing virus. For mosquito bloodmeals at 102 virions/ml, ≈60% of 5-μl bloodmeals will not contain a virion because of chance alone, and at 103 virions/ml, ≈60% of 5-μl bloodmeals will contain five or less virions. In these cases, if few vectors become infected because of chance, such hosts may be viewed as not contributing to the spread of the virus to vectors. However, in nature such low viremias could still result in infected and transmitting mosquitoes, depending on the numbers of hosts with this viremia, the duration of the viremia, dose–infection–transmission relationships, and the numbers of mosquitoes that are biting these hosts. There may be little difference in the numbers of mosquitoes infected by a single bird with 105 viremia and 100 birds with viremias of 103. Low viremic hosts may play a far greater role in the spread of the virus than hosts with high viremias. However, there is some evidence that the viremia in the bloodmeal affects not only the probability of infection but also the probability of transmission by the mosquito (Kramer et al. 1981, Hardy and Reeves 1990a), with higher viremias resulting in higher transmission rates. Low viremias (hence, low doses of virus ingested) could therefore result in reduced transmission rates, potentially to zero. However, we do not have sufficient data to assume that low doses of virus never result in vectors that can transmit. This requires further research to assess the implications for virus epidemiology.
The importance of low host viremias has not been fully explored, and the number of virions in an individual bloodmeal needed to infect vectors requires study. Most reports of host viremia and vector infection variation can be explained largely by the random distribution of virus in mosquito bloodmeals that are dependent on the level of viremia. Methodological issues may also be a factor. Our theoretical studies consider the number and distribution of virions in the blood of a host. It is likely that this does not correspond precisely to measured virions per milliliter, because the sensitivity of many of the methods used to measure virus concentration was not known exactly, and the sensitivity has changed as technology and methods improved. For theoretical studies, considering virions per milliliter is appropriate; however, to compare with experimental data, we need an assessment of measurement accuracy for different methods.
The recent discovery of nonsystemic transmission of WNV (Higgs et al. 2005) also calls into question the idea of dead end hosts. In this case, virus is transmitted between two mosquitoes feeding simultaneously, without the host becoming viremic. The epidemiological implications are not yet fully understood and may vary between locations, host, and mosquito species. Lord and Tabachnick (2002) considered the implications for another fly-borne arbovirus, vesicular stomatitis, but the results are not directly comparable because of the lack of viremic transmission in that system. Similar studies will be required with WNV and other arboviruses to understand the implications in systems with both viremic and nonviremic transmission, as has been done for tick-borne pathogens (Randolph et al. 1996).
The significance of different host species for arbovirus epidemiology requires information on the variation in host viremias, the numbers of the host species receiving mosquito bites, the number of virions required to initiate a replicating infection in a mosquito and the probability of infecting different vector species, coupled with an understanding of the dynamics caused by environmental factors such as temperature. Experiments to address these issues require at least three, and ideally more, levels of viremia chosen to span the range of <5% infection to >90%. Mosquitoes should be tested for both infection and transmission rates, with sufficient sample sizes to differentiate low rates of infection from zero and analyze the shape of the curve. Until sufficient data are available to clearly differentiate between potential models, assuming a threshold of infection for mosquito vectors will underestimate the contribution of hosts with low viremia. This, in turn, may lead to erroneous conclusions about which avian species are most important in the epidemiology and in the spread of the pathogen and lead to imprecise predictions of where and when to expect high levels of transmission.
Acknowledgments
We thank G. F. O'Meara, J. F. Day, W. K. Reisen, and two anonymous reviewers for constructive comments. This work was supported by National Institutes of Health Grant AI42164 (to C.C.L., C.R.R., and W.J.T.). This is paper R-10927 from the University of Florida, Florida Agricultural Experiment Station.
References Cited
- Aguirre AA, McLean RG, Cook RS. Experimental inoculation of three arboviruses in black-bellied whistling ducks (Dendrocygna autumnalis) J Wildl Dis. 1992;28:521–525. doi: 10.7589/0090-3558-28.4.521. [DOI] [PubMed] [Google Scholar]
- Bernard KA, Maffei JG, Jones SA, Kauffman EB, Ebel GD, Dupuis AP, Ngo KA, Nicholas DC, Young DM, Shi PY, et al. West Nile virus infection in birds and mosquitoes, New York State, 2000. Emerg Infect Dis. 2001;7:679–685. doi: 10.3201/eid0704.010415. [DOI] [PMC free article] [PubMed] [Google Scholar]
- Bretz F, Hothorn LA. Detecting dose-response using contrasts: asymptotic power and sample size determination for binomial data. Stat Med. 2002;21:3325–3335. doi: 10.1002/sim.1324. [DOI] [PubMed] [Google Scholar]
- Brault AC, Langevin SA, Bowen RA, Panella NA, Biggerstaff BJ, Miller BR, Komar N. Differential virulence of West Nile strains for American crows. Emerg Infect Dis. 2004;10:2161–2168. doi: 10.3201/eid1012.040486. [DOI] [PMC free article] [PubMed] [Google Scholar]
- Chamberlain RW, Sikes RK, Nelson DB, Sudia WD. Studies on the North American arthropod-borne encephalitides. VI. Quantitative determinations of virus-vector relationships. Am J Hyg. 1954;60:278–285. doi: 10.1093/oxfordjournals.aje.a119721. [DOI] [PubMed] [Google Scholar]
- Chamberlain RW, Sudia WD, Gillett JD. St. Louis encephalitis virus in mosquitoes. Am J Hyg. 1959;70:221–236. doi: 10.1093/oxfordjournals.aje.a120072. [DOI] [PubMed] [Google Scholar]
- Hadler J, Nelson R, Andreadis T, Lis MJ, French R, Beckwith W, Mayo D, Archambault G, Cartter M. West Nile virus surveillance in Connecticut in 2000: an intense epizootic without high risk for severe human disease. Emerg Infect Dis. 2001;7:636–642. doi: 10.3201/eid0704.010406. [DOI] [PMC free article] [PubMed] [Google Scholar]
- Hardy JL, Houk EJ, Kramer LD, Reeves WC. Intrinsic factors affecting vector competence of mosquitoes for arboviruses. Annu Rev Entomol. 1983;28:229–262. doi: 10.1146/annurev.en.28.010183.001305. [DOI] [PubMed] [Google Scholar]
- Hardy JL, Reeves WC. Experimental studies on infection in vectors. In: Reeves WC, editor. Epidemiology and control of mosquito-borne arboviruses in California, 1943–1987. California Mosquito and Vector Control Association; Sacramento, CA: 1990a. pp. 145–253. [Google Scholar]
- Hardy JL, Reeves WC. Experimental studies on infection in vertebrate hosts. In: Reeves WC, editor. Epidemiology and control of mosquito-borne arboviruses in California, 1943–1987. California Mosquito and Vector Control Association; Sacramento, CA: 1990b. pp. 66–127. [Google Scholar]
- Higgs S, Schneider BS, Vanlandingham DL, Klingler KA, Gould EA. Nonviremic transmission of West Nile virus. Proc Natl Acad Sci U S A. 2005;102:8871–8874. doi: 10.1073/pnas.0503835102. [DOI] [PMC free article] [PubMed] [Google Scholar]
- Hothorn LA, Bretz F. Evaluation of animal carcinogenicity studies: Cochran-Armitage trend test vs. multiple contrast tests. Biom J. 2000;42:553–567. [Google Scholar]
- Jupp PG. The susceptibility of four South African species of Culex to West Nile and Sindbis viruses by two different infecting methods. Mosq News. 1976;36:166–173. [Google Scholar]
- Jupp PG, McIntosh BM, Blackburn NK. Experimental assessment of the vector competence of Culex (Culex) neavei Theobald with West Nile and Sindbis viruses in South Africa. Trans Roy Soc Trop Med Hyg. 1986;80:226–230. doi: 10.1016/0035-9203(86)90019-2. [DOI] [PubMed] [Google Scholar]
- Kissling RE, Chamberlain RW, Sikes RK, Eidson ME. Studies on the North American arthropod-borne encephalitides III. Eastern equine encephalitis in wild birds. Am J Hyg. 1954;60:251–265. doi: 10.1093/oxfordjournals.aje.a119718. [DOI] [PubMed] [Google Scholar]
- Komar N, Langevin SA, Hinten SR, Nemeth N, Edwards E, Hettler D, Davis B, Bowen R, Bunning M. Experimental infection of North American birds with the New York 1999 strain of West Nile virus. Emerg Infect Dis. 2003;9:311–322. doi: 10.3201/eid0903.020628. [DOI] [PMC free article] [PubMed] [Google Scholar]
- Kramer LD, Hardy JL, Presser SB, Houk EJ. Dissemination barriers for western equine encephalomyelitis virus in Culex tarsalis infected after ingestion of low viral doses. Am J Trop Med Hyg. 1981;30:190–197. doi: 10.4269/ajtmh.1981.30.190. [DOI] [PubMed] [Google Scholar]
- Kulasekera V, Kramer L, Nasci R, Mostashari F, Cherry B, Trock SC, Glaser C, Miller JR. West Nile virus infection in mosquitoes, birds, horses, and humans, Staten Island, New York, 2000. Emerg Infect Dis. 2001;7:722–725. doi: 10.3201/eid0704.010421. [DOI] [PMC free article] [PubMed] [Google Scholar]
- Lehane MJ. Biology of blood-sucking insects. Harper Collins Academic; London, United Kingdom: 1991. [Google Scholar]
- Lord CC, Tabachnick WJ. Influence of non-systemic transmission on the epidemiology of insect borne arboviruses: a case study of vesicular stomatitis epidemiology in the western United States. J Med Entomol. 2002;39:417–426. doi: 10.1603/0022-2585-39.3.417. [DOI] [PubMed] [Google Scholar]
- McLean RG, Crans WJ, Caccamise DF, McNelly J, Kirk LJ, Mitchell CJ, Calisher CH. Experimental infection of wading birds with eastern equine encephalitis virus. J Wildl Dis. 1995;31:502–508. doi: 10.7589/0090-3558-31.4.502. [DOI] [PubMed] [Google Scholar]
- McLean RG, Ubico SR, Docherty DE, Hansen WR, Sileo L, McNamara TS. West Nile virus transmission and ecology in birds. Ann N Y Acad Sci. 2001;951:54–57. doi: 10.1111/j.1749-6632.2001.tb02684.x. [DOI] [PubMed] [Google Scholar]
- Milby MM, Reeves WC. Natural infection in vertebrate hosts other than man. In: Reeves WC, editor. Epidemiology and control of mosquito-borne arboviruses in California, 1943–1987. California Mosquito and Vector Control Association; Sacramento, CA: 1990. pp. 26–65. [Google Scholar]
- Neuhäuser M, Hothorn LA. An exact Cochran-Armitage test for trend when dose-response shapes are a priori unknown. Comput Stat Data Anal. 1999;30:403–412. [Google Scholar]
- Petersen LR, Roehrig JT. West Nile virus: a reemerging global pathogen. Emerg Infect Dis. 2001;7:611–614. doi: 10.3201/eid0704.010401. [DOI] [PMC free article] [PubMed] [Google Scholar]
- Randolph SE, Gern L, Nuttall PA. Co-feeding ticks: epidemiological significance for tick-borne pathogen transmission. Parasitol Today. 1996;12:472–479. doi: 10.1016/s0169-4758(96)10072-7. [DOI] [PubMed] [Google Scholar]
- Reisen WK, Presser SB, Lin J, Enge B, Hardy JL, Emmons RW. Viremia and serological responses in adult chickens infected with western equine encephalomyelitis and St. Louis encephalitis viruses. J Am Mosq Control Assoc. 1994;10:549–555. [PubMed] [Google Scholar]
- Reisen WK, Kramer LD, Chiles RE, Green EN, Martinez VM. Encephalitis virus persistence in California birds: preliminary studies with house finches. J Med Entomol. 2001;38:393–399. doi: 10.1603/0022-2585-38.3.393. [DOI] [PubMed] [Google Scholar]
- Reisen WK, Fang Y, Martinez VM. Avian host and mosquito (Diptera: Culicidae) vector competence determine the efficiency of West Nile and St. Louis encephalitis virus transmission. J Med Entomol. 2005;42:367–375. doi: 10.1093/jmedent/42.3.367. [DOI] [PubMed] [Google Scholar]
- Sudia WD, Chamberlain RW. The virus of St. Louis encephalitis in chickens. Am J Hyg. 1959;70:197–207. doi: 10.1093/oxfordjournals.aje.a120070. [DOI] [PubMed] [Google Scholar]
- Swayne DE, Beck JR, Smith CS, Shieh WJ, Zaki SR. Fatal encephalitis and myocarditis in young domestic geese Anser anser domesticus caused by West Nile virus. Emerg Infect Dis. 2001;7:751–753. doi: 10.3201/eid0704.010429. [DOI] [PMC free article] [PubMed] [Google Scholar]
- Tabachnick WJ, MacLachlan NJ, Thompson LH, Hunt GJ, Patton JF. Susceptibility of Culicoides variipennis sonorensis to infection by polymerase chain reaction-detectable bluetongue virus in cattle blood. Am J Trop Med Hyg. 1996;54:481–485. doi: 10.4269/ajtmh.1996.54.481. [DOI] [PubMed] [Google Scholar]
- Turell MJ, Dohm DJ, Sardelis MR, O'Guinn ML, Andreadis TG, Blow JA. An update on the potential of North American mosquitoes (Diptera: Culicidae) to transmit West Nile virus. J Med Entomol. 2005;42:57–62. doi: 10.1093/jmedent/42.1.57. [DOI] [PubMed] [Google Scholar]
- Weaver SC, Lorenz LH, Scott TW. Distribution of western equine encephalomyelitis virus in the alimentary tract of Culex tarsalis (Diptera: Culicidae) following natural and artificial blood meals. J Med Entomol. 1993;30:391–397. doi: 10.1093/jmedent/30.2.391. [DOI] [PubMed] [Google Scholar]
- Weingartl HM, Neufeld JL, Copps J, Marszal P. Experimental West Nile virus infection in blue jays (Cyanocitta cristata) and crows (Corvus brachyrhynchos) Vet Pathol. 2004;41:362–370. doi: 10.1354/vp.41-4-362. [DOI] [PubMed] [Google Scholar]
- Williams DA. Tests for differences between several small proportions. Appl Stat. 1988;37:421–434. [Google Scholar]
- Woodring JL, Higgs S, Beaty BJ. Natural cycles of vector-borne pathogens. In: Beaty BJ, Marquardt WC, editors. The biology of disease vectors. University Press of Colorado; Niwot, CO: 1996. pp. 51–72. [Google Scholar]
- Work TH, Hurlbut HS, Taylor RM. Indigenous wild birds of the Nile Delta as potential West Nile virus circulating reservoirs. Am J Trop Med Hyg. 1955;4:872–888. doi: 10.4269/ajtmh.1955.4.872. [DOI] [PubMed] [Google Scholar]