

Abstract
While the etiology of most childhood cancers is largely unknown, epidemiologic studies have consistently found an association between exposure to medical radiation during pregnancy and risk of childhood cancer in offspring. The relation between early life diagnostic radiation exposure and occurrence of pediatric cancer risks is less clear. This review summarizes current and historical estimated doses for common diagnostic radiologic procedures as well as the epidemiologic literature on the role of maternal prenatal, children’s postnatal and parental preconception diagnostic radiologic procedures on subsequent risk of childhood malignancies Risk estimates are presented according to factors such as the year of birth of the child, trimester and medical indication for the procedure, and the number of films taken. The paper also discusses limitations of the methods employed in epidemiologic studies to assess pediatric cancer risks, the effects on clinical practice of the results reported from the epidemiologic studies, and clinical and public health policy implications of the findings. Gaps in understanding and additional research needs are identified. Important research priorities include nationwide surveys to estimate fetal and childhood radiation doses from common diagnostic procedures, and epidemiologic studies to quantify pediatric and lifetime cancer risks from prenatal and early childhood exposures to diagnostic radiography, computed tomography, and fluoroscopically-guided procedures.
Keywords: ionizing radiation, pediatric neoplasms, cancer risks, diagnostic radiography, CT
Introduction
Childhood cancers represent less than one percent of total cancer occurrence [1]. The International Classification of Childhood Cancer [2] recognizes twelve major categories of pediatric cancer (Figure 1). The major categories of the leukemias, brain tumors and lymphomas represent close to 70 percent of all pediatric cancers (Figure 1), in contrast to the primarily epithelial origin of the most common forms of adult malignancies (e.g., prostate, breast, lung, and colon carcinomas) [1]. Most categories of childhood cancer include subtypes characterized by specific histologic and molecular features [3]. Pediatric cancer subtypes may also vary in age, gender, and race patterns [4, 5].
Figure 1.

Incidence of cancer in children and adolescents under 20 years of age both sexes, all races, and by ICCC group, SEER program 2001–2005 [1]
Internationally, incidence of total childhood cancer varies substantially less than most types of adult malignancies. Overall, the cumulative risk to age 15 for total childhood cancer is in the range of 1.0–2.5 per thousand [6]. The greatest variation occurs in comparisons of high-income to low-income countries [4] and may derive from incomplete ascertainment of pediatric cancer occurrence, different risk factors (e.g., pediatric Burkitt lymphoma in sub-Saharan Africa is associated with Epstein-Barr virus infection in conjunction with malaria, whereas Burkitt lymphoma in developed countries is not associated with these infectious conditions), or differences in risk among different ethnic or racial population subgroups [3, 5, 7]. Risk factors for most childhood cancers are largely unknown, except for increased occurrence with certain chemotherapeutic agents, specific genetic and constitutional disorders, and exposure to radiation from prenatal diagnostic medical radiologic examinations.
It has been more than 50 years since Stewart and colleagues conducted the large epidemiologic case-control study known as the Oxford Survey of Childhood Cancers (OSCC) that linked maternal in utero medical diagnostic radiation exposure to pediatric cancer mortality in offspring. [8, 9]. Many epidemiologic studies have subsequently replicated the results [10–14]. Meta-analyses and other summaries have quantified the magnitude of the increased cancer risk as approximately 50% greater than baseline [15, 16], although this has been debated [17]. Fewer epidemiologic investigations have studied pediatric cancer risks associated with postnatal diagnostic medical radiation procedures [12, 14]. This paper summarizes the epidemiologic literature on pediatric cancer risks associated with maternal prenatal, children’s postnatal, and parental preconception diagnostic medical radiation exposures, following a brief review of estimated radiation doses from current and past diagnostic radiologic examinations commonly carried out in pregnant women and children. Also discussed are the effects of the reported epidemiologic results on clinical practice, the difficulty of assessing the impact of the results on trends in childhood cancer occurrence, and methodological aspects of the epidemiologic data.
Estimated Doses Characterizing Diagnostic Medical Radiologic Procedures
Variability in estimated doses among different diagnostic examinations and over time
In recent years, the largest source of general population exposure to radiation has shifted from environmental radiation to medical diagnostic and therapeutic procedures [18, 19]. As illustrated in Tables 1-4, there is tremendous variation in estimated doses from different diagnostic radiologic procedures (Table 1), in estimated doses over time (Table 2), and in estimated doses toembryos and fetuses (Table 3) adn to children (Table 4). For example, estimated effective doses are 15-fold higher from screening mammograms, 70-fold higher from barium swallow examinations and 750-fold higher from chest computed tomography (CT) than doses from a single chest radiograph (Table 1). At a given point in time, notable differences in radiation doses have been reported from a single medical center, among medical institutions in the same country and among medical centers in different countries [20]. Based on nationwide surveys of diagnostic medical radiological exposures carried out in the United Kingdom (UK) since the mid-1980s, there has been a continuing downward trend in dose to adult patients for many, but not all, common types of radiographic procedures and CT examinations [21–26] (Table 2). Decreasing radiation doses to patients may reflect improvements in protocols for conducting radiologic procedures, technological advances in equipment, implementation of diagnostic reference doses, and a variety of efforts to mitigate exposure stemming from greater awareness of adverse radiation effects. On the other hand, some of the notable technical achievements in imaging have led to greater use of diagnostic radiologic procedures (including CT, nuclear medicine, and fluoroscopically-guided procedures) for screening of healthy persons and to monitor patients with serious disease [19, 27].
Table 1.
Typical effective doses from different diagnostic examinations
| Type of Examination | Effective dose (mSv) f |
|---|---|
| Radiography (Single radiograph)b | |
| Skull AP or PA | 0.015 (1) |
| Chest PA | 0.013 (1) |
| T-spine AP | 0.27 (20) |
| L-spine AP | 0.44 (30) |
| Abdomen AP | 0.46 (35) |
| Pelvis AP | 0.48 (35) |
| Mammography (4 views)c | |
| Screening | 0.2 (15) |
| Dental Radiographyd | |
| Intra oral | 0.013 (1) |
| Panoramic | 0.012 (1) |
| Diagnostic Fluoroscopy Procedures | |
| Barium swallow b | 1 (70) |
| Barium meal b | 2 (150) |
| Barium enema b | 5 (350) |
| Angiography cerebral d | 2 (150) |
| Angiography cardiac d | 7 (500) |
| Computed Tomographye | |
| Head | 2 (150) |
| Chest | 10 (750) |
| Abdomen | 10 (750) |
| Pelvis | 7 (500) |
| Abdomen/Pelvis | 15 (1100) |
| C-spine | 5 (400) |
| T-spine | 8 (550) |
| L-spine | 7 (500) |
| Diagnostic Nuclear Medicinef | |
| Bone (99mTc phosphate) | 3 (200) |
| Heart (201Tl thallous chloride) | 13 (950) |
| Lung (99mTc MAA g) | 0.9 (70) |
| Tumor- PET(18F FDG g) | 7 (500) |
| Kidney (99mTc MAG3 g) | 0.6 (40) |
| Thyroid (99mTc Pertechnetate) | 0.9 (70) |
Number in parenthesis indicates number of chest x-ray exams resulting in the same effective dose from each diagnostic examination
Effective dose was calculated using entrance surface dose (ESD) from a nationwide survey during 2001–2006 in the UK and effective dose conversion factor [22, 45]
Effective dose was calculated using mean glandular dose found in Mammography Quality Standards Act (MQSA) inspection in 2006 in the US [126]
Average effective dose for health-care level I countries given in United Nations Scientific Committee on the Effects of Atomic Radiation (UNSCEAR) report [20]
Average of effective doses from axial and helical scans from a nationwide survey in 2000–2001 in the US [55]
Based on a nationwide survey in 2003–2004 in the UK [22]
MAA: macro aggregated albumin, FDG: fluorodeoxyglucose, MAG: mertiatide
Table 4.
Radiation dose to children by age at exposure from diagnostic examination
| Type of Examination | Dose Quantity 1 | Radiation Dose to Children (by Age at Exposure) |
|||||
|---|---|---|---|---|---|---|---|
| 0 year | 1 year | 5 year | 10 year | 15 year | Adults | ||
| Radiography a | |||||||
| Skull AP | ESD (mGy) | - | 0.60 | 1.25 | - | - | 2.3 |
| Skull LAT | ESD (mGy) | - | 0.34 | 0.58 | - | - | 1.2 |
| Chest PA | ESD (mGy) | 0.06 | 0.08 | 0.11 | 0.07 | 0.11 | 0.15 |
| Abdomen AP | ESD (mGy) | 0.11 | 0.34 | 0.59 | 0.86 | 2.01 | 4.7 |
| Pelvis AP | ESD (mGy) | 0.17 | 0.35 | 0.51 | 0.65 | 1.30 | 3.6 |
| Dental Radiography b | |||||||
| Intra oral | PED (mGy) | 1.15 g | 1.85 | ||||
| Panoramic | DAP (mGy cm2) | 70 g | 70 | ||||
| Diagnostic Fluoroscopy Procedures | |||||||
| MCU b | DAP (mGy cm2) | 274 | 483 | 740 | 1155 | 1911 | 9260 |
| Barium swallow b | DAP (mGy cm2) | 529 | 863 | 858 | 2272 | 2528 | 6350 |
| Barium meal b | DAP (mGy cm2) | 378 | 765 | 845 | 2012 | 3466 | 9980 |
| Cardiac-ASD occlusion c | ED (mSv) | 3.88 g | |||||
| Cardiac-PDA occlusion c | ED (mSv) | 3.21 g | |||||
| Cardiac-VSD occlusion c | ED (mSv) | 12.1 g | |||||
| Computed Tomography d | |||||||
| Brain | ED (mSv) | 2.3 | 2.2 | 1.9 | 2.0 | 2.2 | 1.9 |
| Facial bone/Sinuses | ED (mSv) | 1.4 | 0.5 | 0.5 | 0.5 | 0.6 | 0.9 |
| Chest | ED (mSv) | 1.9 | 2.2 | 2.5 | 3.0 | 3.3 | 5.9 |
| Entire Abdomen | ED (mSv) | 3.6 | 4.8 | 5.4 | 5.8 | 6.7 | 10.4 |
| Spine | ED (mSv) | 4.4 | 11.4 | 8 | 7.6 | 6.9 | 10.1 |
| Diagnostic Nuclear Medicine e | |||||||
| 99mTc MAG3 (renal function) | ED (mSv) | 0.6 | 0.6 | 0.7 | 0.8 | 0.7 | |
| 99mTc DTPA (renal function) | ED (mSv) | 0.5 | 0.5 | 0.7 | 0.5 | 0.6 | |
| 99mTc IDA (biliary function) | ED (mSv) | 3.7 | 3.0 | 2.9 | 2.4 | 2.3 | |
| 99mTc MIBI (resting) | ED (mSv) | 5.4 | 4.8 | 4.4 | 4.0 | 3.3 | |
| 201Tl chloride | ED (mSv) | 86 | 95 | 129 | 30 | 20 | |
| 123I sodium iodide (thyroid uptake) | ED (mSv) | 19 | 16 | 12 | 10 | 7.2 | |
| 67Ga citrate | ED (mSv) | 28 | 23 | 23 | 19 | 15 | |
MCU: micturating cystourethrography: MAG: mertiatide, DTPA: diethylenetriaminepentaacetic acid, IDA: iminodiacetic acid, MIBI: methyloxyisobutylisonitrile, ESD entrance surface dose, PED patient entrance dose, DAP dose area product, ED effective dose
Source: the UK nationwide survey [22]
Source: Onnasch et al. 2007 [31]. Mean age of patients is 2.5 years
Source: German nationwide survey Galanski et al. 2006 [30]. Radiation doses to adults are based on German nationwide survey on multi-slice computed tomography (MSCT) [28]. Radiation dose in age group category 1-year is dose to pediatric patients (up to 1-year), 5 y (1–5y), 10y (6–10y), and 15y (11–15y)
Source: Gadd et al. 1999 [29]. Effective dose was calculated assuming that scaling factors of administered activity are 0.27 (1 y), 0.44 (5 y), 0.69 (10 y), 0.9 (15 y), and 1 (adults) Table 5
Different dosimetric quantities have been used to quantity radiation dose to patients depending on modality. Dosimetric quantities in the given table include ESD (entrance surface dose), PED (patient entrance dose), DAP (dose area product), and ED (effective dose)
Age is not specified
Table 2.
Temporal trend in radiation doses
| Type of Examination | Dose Quantity d | Radiation Dose over Time e |
||||||||
|---|---|---|---|---|---|---|---|---|---|---|
| 1985 | 1987–1988 | 1989 | 1995 | 1995–1998 | 1996–2000 | 2001–2005 | 2002–2004 | 2003 | ||
| Radiographya | ||||||||||
| Skull AP | ESD (mGy) | 5(1) | 3(0.6) | 2.3(0.5) | 1.4(0.3) | |||||
| Chest PA | ESD | 0.3(1) | 0.2(0.7) | 0.2(0.5) | 0.1(0.4) | |||||
| Abdomen AP | ESD | 8(1) | 6(0.8) | 4.7(0.6) | 3.5(0.4) | |||||
| Pelvis AP | ESD | 6.5(1) | 4.5(0.7) | 3.6(0.6) | 3.1(0.5) | |||||
| Dental Radiograph b | ||||||||||
| Intra oral | PED (mGy) | 5.1(1) | 3.3(0.6) | 1.9(0.4) | ||||||
| Panoramic | DAP | 77(1) | 68(0.9) | |||||||
| Diagnostic Fluoroscopy Procedures a | ||||||||||
| Barium swallow | DAP (mGy cm2) | 10(1) | 8(0.8) | 6(0.6) | ||||||
| Barium meal | DAP | 19(1) | 13(0.7) | 10(0.6) | 10(0.5) | |||||
| Barium enema | DAP | 41(1) | 26(0.6) | 24(0.6) | 18(0.4) | |||||
| Computed Tomography c | ||||||||||
| Head | ED (mSv) | 1.8(1) | 1.5(0.8) | |||||||
| Chest | ED | 7.8(1) | 5.8(0.7) | |||||||
| Abdomen | ED | 7.6(1) | 5.3(0.7) | |||||||
ESD entrance surface dose, PED patient entrance dose,DAP dose area product, and ED effective dose
Different dosimetric quantities have been used to quantity radiation dose to patient. Dosimetric quantities and units in this table include ESD (entrance surface dose), PED (patient entrance dose), DAP (dose area product), and ED (effective dose)
Number in parenthesis is relative dose ratio
Table 3.
Radiation dose to embryo/fetus from maternal diagnostic examination
| Type of Examination | Embryo/fetus dose (mGy) |
|---|---|
| Radiography a | |
| Chest AP or PA | <0.01 |
| T-spine AP or LAT | <0.01 |
| Abdomen AP | 2.9 |
| Abdomen PA | 1.3 |
| L-spine AP | 7.5 |
| L-spine LAT | 0.91 |
| Pelvis AP | 3.4 |
| Special Diagnostic Proceduresa | |
| Barium meal | 1.5 |
| Barium enema | 6.1 |
| Cholecystography | 0.6 |
| Intravenous pyelogram | 4.8 |
| Urinary bladder AP | 3.9 |
| Computed Tomography a | |
| Lung | 1.2 |
| Liver | 3.6 |
| L-spine | 2.8 |
| Pelvis | 89 |
| Diagnostic Nuclear Medicine b | |
| 99mTc MDP (bone) | 4.6 |
| 99mTc MAA (lung) | 0.6 |
| 123I sodium iodide (thyroid) | 0.6 |
| 67Ga citrate | 18 |
| 133Xe (lung) | 0.005 |
| 201Tl chloride (lung) | 5.3 |
| 99mTc MAG3 3(kidney) | 14 |
| 99mTc MIBI-rest 3 (heart) | 17 |
MDP: methyenediphosponate, MAA: macro aggregated albumin, MAG: mertiatide, MIBI: methyloxyisobutylisonitrile
Source Osei and Faulkner 1999 [44]. Gestational ages range between 2 and 24 weeks
Source Russell et al. 1997 [49]. Radiation doses to embryo/fetus vary depending on gestation age Radiation doses given in the table are during early pregnancy time. Organs examined by nuclear medicine studies are given in parenthesis
Dose metrics
Depending on the modality, radiation doses can be reported using different dose quantities and associated dose units, including: entrance surface dose (ESD) in milliGrays (mGy), patient entrance dose (PED) in mGy, dose area product (DAP) in mGy cm2 and effective dose in milliSieverts (mSv) (Tables 2 and 4). Further, the methods for deriving effective doses vary, and have included such considerations as type of examination, exposure settings, age, weight, and scaling factors [28–32]. Differences in the radiologic dose units for different radiologic examinations complicate comparisons among procedures.
Estimated doses for in-utero and early childhood radiation from diagnostic medical radiation procedures
Overview
Even though cancer risks associated with a given radiation dose are known to be higher for exposures during childhood and adolescence than for exposures during adulthood [33–35], and have been thought to be greater for prenatal than postnatal exposures, published radiation dose estimates for medical diagnostic procedures in children [36] and data based on nationwide surveys are limited [22,24,30].
In utero exposures
In utero exposures: early surveys
In light of concern about medical radiation-related genetic hazards in the UK, action initiated in 1956 to review practices in diagnostic radiology led to the establishment in 1957 of the Adrian Committee, which sponsored nationwide surveys of obstetric radiology practice to estimate radiation-related doses to the fetus [37]. Two main obstetrical diagnostic radiological procedures were used at that time: obstetrical abdominal x-rays, which were intended to image the entire fetus and utilized a large film, resulting in relatively uniform radiation dose to the entire fetus; and pelvimetry x-rays, which were used to show the bony structure of the maternal pelvis and the part of the fetus within the pelvis to provide information to facilitate delivery. Because maternal intrauterine and ovary radiation doses cannot be measured in vivo, the surveys estimated fetal and maternal gonad doses using phantom measurements and scaling factors derived by Bewley et al [38] and Clayton et al [39]. Data from the nationwide surveys revealed that while estimated doses to a woman’s ovaries from general medical diagnostic radiological procedures ranged over five orders of magnitude (in part due to lack of restriction of x-ray beams to useful areas of x-ray films) [37, 40], estimated doses to the maternal ovary and fetal gonad for specific obstetrical abdominal examinations, in contrast, ranged over two orders of magnitude [37, 41]. Pelvimetry, a diagnostic procedure which rapidly expanded in use in the late 1940s and 1950s, included several different radiologic projections that were associated with notable variation in the estimated fetal doses (ranging from 1.6 to 26 mGy per exposure [37,42]. From these surveys, the estimated whole body fetal doses from obstetric abdomen and pelvimetry examinations (which were based on estimated fetal bone marrow dose in late pregnancy when most in utero medical radiologic examinations were carried out) were 5,8 mGy and 13 mGy, respectively, [37,43].
In utero exposures: more recent surveys
While the decline in prenatal obstetrical radiologic procedures and replacement of diagnostic procedures involving ionizing radiation with sonography in the 1970s has resulted in notable reduction of an important source of early life exposures to ionizing radiation, pregnant women continue to undergo imaging procedures to evaluate such non-obstetric medical conditions as pulmonary embolus, renal colic, appendicitis, and injuries from trauma. Substantial variation in estimated radiation doses was also reported from a retrospective UK study in the 1990s of 50 pregnant women undergoing radiologic and CT examinations [44], that utilized normalized uterine doses for a range of technical factors [26, 45] and reported estimated fetal doses ranging from <0.01 mGy to 89 mGy depending on the type of examination, the level of radiation exposure to the mother, and the anatomic site irradiated (Table 3). In general, CT examinations, certain fluoroscopic procedures, and a few nuclear medicine procedures were characterized by higher fetal doses than other types of diagnostic examinations (Table 3). For a given modality, radiation dose to the fetus was much higher when the primary x-ray beam irradiated the maternal pelvic area. Recent dosimetry studies suggest that estimated fetal radiation doses from multi-detector CT (MDCT) protocols may be greater than doses from single-detector CT [46]. The estimated range in radiation doses to the fetus at 0 and 3 months for implementation of the MDCT protocols for pulmonary embolus was 0.24–0.47 mGy and 0.61–0.66 mGy, respectively and the range was substantially higher at 0 and 3 months for renal stone colic (8–12 mGy and 4–7 mGy) and appendicitis protocols (15.2–16.8 mGy and 20–40 mGy) [47].
Factors affecting radiation dose to the fetus from diagnostic nuclear medicine procedures include the time-dependent distribution of radiopharmaceuticals in the human body, physical properties of the radionuclides, and administered activity. From a survey of 30 medical institutions that utilized Medical Internal Radiation Dose (MRID) schema [48, 49], the estimated fetal doses from diagnostic nuclear medicine procedures most commonly carried out in women of childbearing age and utilizing approximately 80 radiopharmaceuticals were generally less than 10 mGy, although some studies with 67Ga citrate, 201Tl chloride, 99mTc MAG3, and 99mTc exceeded this exposure level (Table 3).
Russell et al. estimated absorbed dose to the fetus by gestational age (for four time periods, including early pregnancy, 3 month, 6 month, and 9 month gestations) and found that fetal dose varied with gestational age depending on the physical and biokinetic characteristics of radiopharmaceuticals in vivo [49]. In general, fetal dose declines with increasing gestational age because the increase in body mass of the fetus is more dominant than the increase in radiation level to the larger fetus. Fetal dose may increase when the fetal and placental uptake of radiopharmaceuticals such as 123I sodium iodide increases with increasing gestational age.
Pediatric exposure to diagnostic medical radiation
Data collection
Several surveys on radiation doses to pediatric patients have been carried out in the UK, with each focusing on a narrow range of different types of examinations. These data are thus limited for assessing temporal trends in radiation doses. Pediatric dose data for radiographic and fluoroscopic procedures were first collected on patients in four age categories (1 year-old, 5 year-old, 10 year-old, and 15 year-old) during 1996–2000 [24]. A second survey of doses according to age of pediatric patients was carried out during 2001–2006 [22]. The second survey included doses for dental radiographic procedures for the first time. Dose data on CT examinations was first collected in 2003 [25]. Although a 2003–2004 nationwide survey collected information on nuclear medicine procedures, pediatric patients were assumed to receive the same effective doses as adults [22]. A nationwide survey in Germany collected dose and practice information on pediatric CT examinations during 2005-2006 [30]. In the U.S., a nationwide survey focusing on doses of pediatric patients was carried out in 1998, but data collection was restricted to chest radiography [50].
Estimated doses to the pediatric patient according to age at radiological examination
Radiation doses to infants, children, and adolescents vary by age at diagnostic procedure and other parameters (Table 4). In general, the average estimated entrance surface dose for radiographic procedures and the dose area product for fluoroscopic procedures increases with increasing age. While increasing effective dose with age is apparent for some CT procedures (e.g., chest and abdomen), for others (e.g., brain) a different pattern is evident. A major reason for differences in estimated effective doses between pediatric patients of different ages and between pediatric and adult patients is body size. For a given intensity of x-ray beam, younger pediatric patients receive higher radiation doses than older children, and, overall, pediatric patients receive higher radiation doses than adult patients. This is because the smaller the size of a patient, the less the attenuation of the primary x-ray beam, and thus the higher the radiation dose. In addition, the organs and tissues of pediatric patients are smaller and thinner, respectively, and organs are closer together in children, so that scatter from the primary beam can reach adjacent organs and tissues in children more easily than in adults.
Patterns in CT use in pediatric patients
Use of CT diagnostic examinations varies depending on country, facility, and time period of examination [20]. The proportion of pediatric patients aged 0–15 years old undergoing CT scans ranged from 3 to 16 percent depending on country [20]. Survey data from Israel [51], Japan [52], the UK [53], and the U.S.[54] reveal substantial variability in overall use of CT, evaluation of head trauma or abdominal pain with CT, level of repeat CT examinations, and implementation of standardized guidelines for CT use. The average proportion of children aged 0–15 undergoing CT in the US ranges between 6.5–11 percent, compared to 6 percent in countries with higher levels of medical care other than the U.S. [55, 56].
The proportion of children undergoing CT examinations varies by age. A recent study in Israel reported that about 5 percent of the pediatric CT examinations were carried out among infants, the fraction declined with increasing age to a nadir at age 3 years, and then rose with age [51]. The same pattern was observed in a UK study [57]. Most studies reported higher rates of CT examination for boys than girls, which has been attributed to higher trauma rates among boys [20]. The head is the most common anatomic region for CT examinations in children, whereas the trunk (e.g., chest, abdomen, and pelvis) is the region most frequently evaluated in adults [30, 51, 55, 57]. In Israel, 78 percent of total CT examinations for children under age five were cranial examinations, compared to only 39 percent in adolescents aged 16 to 18 years old [51],. In contrast, CT examinations of the face and neck comprised 3 percent, CT of the extremities 1 percent, and CT of the trunk 18 percent of the total CT in children under age five versus 16 percent, 10 percent, and 35 percent, respectively, in adolescents. For children and adolescents undergoing CT, the most common diagnoses were respiratory diseases and ill-defined conditions such as headaches and dizziness [51], whereas for CT in infants congenital anomalies and conditions were the most common diagnoses. For children and adolescents, CT examinations declined with increasing age for diseases of the nervous system, but rose with increasing age for musculoskeletal and connective tissue disorders.
Trends in CT procedures in pediatric patients
The limited long-term dose data for pediatric patients complicates efforts to describe temporal trends. It is noteworthy that the use of CT for patients of all ages in the United States (U.S.) has increased from an estimated 3 million annually in 1980 to more than 60 million, including 4–7 million annually in children, in 2006. Annual growth in CT examinations is estimated at about 10 percent per year. Pediatric diagnostic procedures are among the most rapidly increasing groups of CT procedures [27, 58, 59]. The Israeli study, which evaluated the time period 1999–2003, reported a reduction in CT use in the last year of the study (Figure 2). The reduction was attributed to a new requirement for prior consultation before referring a patient for CT examination to reduce inappropriate or excessive use of imaging procedures [51].
Figure 2.
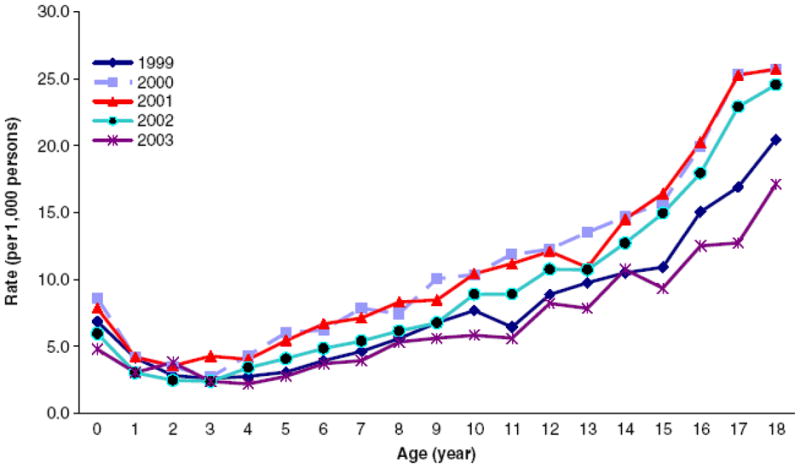
Age-specific rates of CT examination among pediatric patients in Israel [51]
Prenatal, postnatal, and preconception diagnostic radiation and pediatric cancer risks
Study designs
Epidemiologists have employed two major study designs to evaluate the relationship of diagnostic radiation with risk of developing pediatric cancers. In case-control studies, investigators have compared past history of diagnostic radiological procedures carried out during the prenatal period in the mothers or in the postnatal period in the children among the offspring or children, respectively, for children diagnosed with cancer (‘cases’) versus the offspring or children, respectively, for children without cancer (‘controls’). In cohort studies, researchers have followed up retrospectively or prospectively offspring of mothers who have undergone (‘exposed’) versus offspring of mothers who have not undergone (‘unexposed’) diagnostic medical radiological procedures and compared pediatric cancer occurrence in the two groups of offspring.
Pre-natal diagnostic medical radiation and childhood cancer risks: case-control studies
Study population inclusion criteria
Numerous case-control studies have assessed risks of pediatric cancer in offspring of mothers who underwent diagnostic radiological examinations during pregnancy. Studies with at least 200 total pediatric cancer cases, at least 100 cases of acute lymphoblastic leukemia, or at least 80 cases for each of the other types of pediatric cancer are included in Table 5.
Table 5.
Risk of specific and total childhood cancers in offspring of women undergoing prenatal diagnostic x-rays: case-control studiesa
| Authors, Year, Country, Birth Years | No. Cases/ No. Controls | Type of Control | Source of X-ray Information | % Controls with Abdominal X-rays | Estimated Relative Risk |
||
|---|---|---|---|---|---|---|---|
| Any X-ray | Abdominal | Pelvimetry | |||||
| ACUTE LYMPHOBLASTIC LEUKEMIA | |||||||
|
Bithell & Stewart, 1975a United Kingdom, 1943–67 |
2007 / 8,513 | population | interview, medical records, questionnaire | 11.5 | - | 105 | - |
| Van Steensel Moll et al, 1985 The Netherlands, 1959–80 |
517 / 509 | population | questionnaire | 3.7 | - | 2.2 | - |
| Shu et al, 1988 Shanghai, China, 1960–86 |
172 / 618 | population | interview | 7.1 | 1.6 | 2.0 | - |
| Magnani et al, 1990 Turin, Italy, years not provided |
142 / 307 | hospital | interview | 5.5 | - | 1.1 | - |
| Naumberg et al, 2001 Sweden, 1973–89 |
449 / 450 | population | medical records | 9.8 | 1.04 | 1.01 | - |
| Shu et al, 2002 USA and Canada, 1972–92 |
1842 / 1986 | population | interview | 6.0 before 1980 2.3 1981–86 1.8 after 1986 |
- - |
1.2 (all ages) 2.4 (ages 11–14) |
- |
| ACUTE MYELOID LEUKEMIA | |||||||
| Bithell & Stewart, 1975a United Kingdom, 1943–67 |
866/ 8,513 | population | interview, medical records, questionnaire | 11.5 | - | 1.5 | - |
| Shu et al, 1988 Shanghai, China, 1960–86 |
92 / 618 | population | interview | 7.1 | 1.4 | 0.6 | - |
| Van Duijn et al, 1994 The Netherlands, 1969–79 |
80 / 240 | population | questionnaire | 3.0 | 1.7 | 2.0 | - |
| ALL LEUKEMIAS | |||||||
| Kaplan, 1958 | 150 / 150 | siblings | interview | 16.0 | --- | 1.5 | --- |
| California, USA, 1943–67 | 125 / 125 | friends | 21.6 | --- | 1.3 | --- | |
| Polhemus & Koch, 1959 | 251 / 251 | hospital | questionnaire | 23.1 | --- | 1.2 | --- |
| Los Angeles, CA, yrs not provided Graham et al, 1966 Baltimore, Minneapolis, New York State (Tristate Study), 1969–1979 |
313 / 854 | population | medical records | 23.4 | 1.6 | 1.4 | 2.0 |
| Salonen & Saxen, 1975 Finland, 1945–68 | 373 / 373 | population | medical records | 49.3 | 1.1 | 1.9 | --- |
| Hirayama, 1979 Japan, 1955–77 | 4,607 / 5,968 | other cancers | not provided | 10.6 | 1.6 | ||
| Monson & MacMahon, 1984b Northeast USA, 1947–60 | 704 / 14,294 | hospital | medical records | 9.4 | --- | 1.5 | 1.6 |
| Shu et al., 1998, Shanghai, China, 1986–1991 | 166/166 | population | Interview | 7.1 | 2.4 | ||
| Infante-Rivard et al, 2000, 2003 Canada |
701/701 | population | interview | --- | 0.8 | --- | |
| CENTRAL NERVOUS SYSTEM | TUMORS | ||||||
| Bithell & Stewart, 1975a United Kingdom, 1943–67 |
1,332 / 8,513 | population | interview, records, questionnaire | 11.5 | --- | 1.4 | --- |
| Salonen & Saxen, 1975 Finland, 1945–68 |
245 / 245 | population | medical records | 49.3 | 0.8 | 1.1 | --- |
| Preston-Martin et al, 1982 Los Angeles, CA, 1948–77 |
209 / 209 | friends, neighborhood | Interview | 15.0 | --- | 1.3 | --- |
| Monson & MacMahon, 1984b Northeast USA, 1947–60 |
298 / 14,294 | hospital | medical records | 9.4 | --- | 1.2 | --- |
| Bunin et al, 1994 Greater Delaware Valley |
155 astrocytomas 166 PNET/321 | population | interview | --- | 0.9 | --- | |
| Schuz et al, 2001 Germany | 466/2458 | population | interview | --- | 0.8 | --- | |
| Bithell & Stewart, 1975 United Kingdom 1943–67 |
590 / 8,513 | population | interview, records, questionnaire | 11.5 | --- | 1.6 | --- |
| Olshan et al, 1993 USA multicenter, 1969–86 |
251 / 251 | hospital | Questionnaire | 23.1 | --- | 1.2 | --- |
| NEUROBLASTOMA | |||||||
| Bithell & Stewart, 1975a United Kingdom 1943–67 |
720 / 8,513 | population | interview, records, questionnaire | 11.5 | --- | 1.5 | --- |
| BONE TUMORS | |||||||
| Bithell & Stewart, 1975a United Kingdom 1943–67 |
244 / 8,513 | population | interview, records, questionnaire | 11.5 | --- | 1.1 | --- |
| EWING’S SARCOMA | |||||||
| Winn et al, 1992 | 204 / 204 | population | Interview | 27.5 | --- | 0.8 | --- |
| USA multicenter, yrs not provided | 191 / 191 | siblings | interview | 17.3 | --- | 1.5 | --- |
| RHABDOMYOSARCOMA | |||||||
| Grufferman et al, 1993 USA multicenter, 1962–88 |
322 / 322 | population | Interview | 7.1 | --- | 2.1 | --- |
| Monson & MacMahon, 1984b Northeast USA, 1947–60 |
298 / 14,294 | hospital | medical records | 9.4 | --- | 1.2 | --- |
| TOTAL CHILDHOOD | CANCER | ||||||
| Stewart et al, 1958a United Kingdom, 1943–55 |
1,299 / 1,299 | population | interview, medical records, questionnaire | 14.1 | 1.6 | 1.5 | --- |
| Bithell & Stewart, 1975a United Kingdom, 1943–67 |
8,513 / 8,513 | population | interview, medical records, questionnaire | 11.5 | --- | 1.5 | --- |
| Knox et al, 1987a United Kingdom, 1948–78 |
8,059 / 8,059 | population | interview, medical records, questionnaire | 12.2 | --- | 1.9 | --- |
| MacMahon, 1962b Northeast USA, 1947–54 |
556 / 7,242 | Hospital | medical records | 10.6 | --- | 1.4 | 1.6 |
Source: Little 1999 [12]
Initial Oxford Survey of Childhood Cancer case-control childhood cancer study [9] was extended to include 12 additional birth years and an increase to 8,513 cancer cases from 1,299 in the original study [60]. A third publication from the same investigation included cases born during 1948–78 who died during 1953–79 [127]
Risks for all pediatric cancers combined with exposure to in utero diagnostic medical radiation
The Oxford Survey of Childhood Cancers (OSCC) case-control study in the UK first reported statistically signficant 1.6-fold and 2.1-fold mortality excesses in pediatric cancer (based on 1,299 total childhood cancer cases and 1,299 control children) among offspring of pregnant women who underwent diagnostic medical radiologic examinations involving any anatomic sites or abdominal sites, respectively, compared to offspring of pregnant mothers unexposed to diagnostic radiation procedures [9] (Table 5). The ongoing OSCC re-assessed the association by interviewing mothers after 12 additional years and 6-fold more total childhood cancers (8,513 cases), and reported 1.5-fold and 2.5-fold significant mortality increases in all pediatric cancers combined among children of women who underwent diagnostic procedures involving abdominal radiation or pelvimetry, respectively, compared to mortality risks in children of women who had no medical radiologic procedures during pregnancy [60]. Similar results were reported from a nested case-control investigation carried out in hospitals in the northeast U.S. where the investigators observed significant 1.4-fold and 1.6-fold increases in total childhood cancer mortality (involving 556 pediatric cancer cases) among offspring of mothers who underwent diagnostic medical radiologic examinations of any anatomic site or pelvimetry, respectively, compared to occurrence in children of women who underwent no radiologic procedures during pregnancy based on medical records [61]. The initial medical record-based U.S. study findings were confirmed in an expansion of the original study population that included approximately twice the target population of children identified at five additional hospitals and 7 additional years of childhood cancer deaths [62].
Concerns that the observed associations between prenatal maternal exposure to diagnostic medical radiation and subsequent elevated pediatric cancer risk in offspring might be confounded by the reasons or medical problems that led to ordering of the diagnostic medical radiologic examinations led to statistical evaluation according to the reasons for the x-ray tests [63] or other factors [62]. These analyses demonstrated that the associations were still apparent when the data were separately examined according to the reason for the diagnostic radiologic examination. There was no evidence of confounding by many other factors, and the association was specific for childhood cancer and not other causes of death in children.
Risks for childhood leukemia with exposure to in utero diagnostic medical radiation
The OSCC and other case-control studies have also assessed risks for most of the major categories of pediatric cancers. Earlier case-control studies, which assessed risks for all types of childhood leukemia combined, reported elevated estimated risks ranging from 1.2- to 1.9-fold increased for occurrence of leukemia in offspring of mothers who had received diagnostic x-rays to the abdominal region. Risks were slightly higher for studies based on medical record data (odds ratios ranged from 1.4 to 1.9) [62, 64, 65] compared with those based on questionnaire or interview information (odds ratios ranged from 1.2 to 1.3) [66, 67], although there was notable variation in the proportion of control mothers who had undergone diagnostic radiological procedures during pregnancy (ranging from 9.4 percent to 49.3 percent). For acute lymphoblastic leukemia specifically, risks were elevated 1.5 to 2.2-fold in offspring of mothers from the OSCC [60], the Netherlands [68], and Shanghai [69] undergoing radiological examinations of the abdomen during pregnancy, but substantially lower risks or no association (odds ratios ranged from 1.0 to 1.2) were observed in more recent studies from Italy [70], Sweden [71], China [72], and the U.S. and Canada [73], except for higher risks observed among older U.S. children diagnosed at ages 11–14 [73] (Table 5). Risks of acute myeloid leukemia were 1.5- to 2.0-fold increased among children in three studies [60, 72, 74] studies but not a fourth [69] in which mothers reported undergoing diagnostic x-ray examinations of the abdominal region, although only the OSCC investigation [60] included more than 100 cases of childhood acute myeloid leukemia (Table 5). Except for the OSCC and Swedish studies, which reported that 11.5 percent and 9.8 percent, respectively, of control mothers underwent diagnostic radiologic examinations of the abdominal region during pregnancy, other case-control studies of acute lymphoblastic and acute myeloid leukemia reported that 2.4 to 7.1 percent of mothers had abdominal x-rays (Table 5).
Risks for childhood brain tumors with exposure to in utero diagnostic medical radiation
Six case-control studies shown in Table 5 reported risks of pediatric brain tumors in offspring of mothers undergoing diagnostic radiologic procedures with abdominal radiation exposures. Odds ratios ranged from 0.8 to 1.4 [60, 62, 65, 75–77], with no increases in risk apparent in the most recent studies.
Risks for other childhood malignancies with exposure to in utero diagnostic medical radiation
Fewer case-control studies have assessed risks of other pediatric tumors (reviewed in Little [12]), and most of these included smaller numbers of subjects than the population size required to be included in Table 5. The OSCC reported odds ratios of 1.6, 1.5, and 1.1 respectively, for Wilms’ tumor, neuroblastoma, and bone tumors, and odds ratios ranging from 1.4 to 1.6 for other pediatric cancers in offspring of mothers undergoing diagnostic medical radiology examinations involving exposure to the abdomen during pregnancy [60] (Table 6). Small increases [62, 78] or no increase [79] were reported for neuroblastoma, rhabdomyosarcoma, and Ewing’s sarcoma, respectively.
Table 6.
Risk of specific types of childhood cancer in offspring of women undergoing prenatal diagnostic x-rays in the Oxford Survey of Childhood Cancer case-control study.
| Type of Cancer | Total Number Of Deaths | No. Deaths Associated with Prenatal X-rays | Estimated Relative Risk (95%CI) |
|---|---|---|---|
| Lymphatic leukemia | 2007 | 290 | 1.5 (1.3–1.8) |
| Myeloid leukemia | 866 | 120 | 1.5 (1.2–1.8) |
| Other & unspecified leukemia | 1179 | 159 | 1.4 (1.2–1.7) |
| Lymphoma | 719 | 92 | 1.4 (1.1–1.7) |
| Wilms’ tumor | 590 | 87 | 1.6 (1.2–2.0) |
| Central nervous system tumors | 1332 | 179 | 1.4 (1.2–1.7) |
| Neuroblastoma | 720 | 99 | 1.5 (1.2–1.8) |
| Bone | 244 | 26 | 1.1 (0.7–1.7) |
| Other | 856 | 129 | 1.6 (1.3–2.0) |
| All leukemias | 4052 | 569 | 1.5 (1.3–1.7) |
| All solid tumors | 4461 | 612 | 1.4 (1.3–1.6) |
| All childhood cancers | 8513 | 1181 | 1.5 (1.3–1.6) |
Risks of pediatric cancer by trimester
Although most of the case-control studies assessed history of any diagnostic medical radiologic examinations during pregnancy and anatomic site of the examination, a few obtained more detailed information. OSCC data showed that most of the diagnostic radiologic procedures were performed in the third trimester of pregnancy, but the excess risks of childhood cancer were associated only with medical radiation exposures in the first trimester [80] (Table 7). Using UNSCEAR (1972 [81] estimates of average uterine dose per film, Bithell and Stiller [15] determined that risk was significantly higher for diagnostic medical procedures to the abdomen in the first compared with the third trimester (estimated excess relative risk (ERR)/mGy = 0.28 (95%CI=0.08–1.14) in the first trimester vs. ERR/mGy = 0.03 (95%CI=0.02–0.04) in the third trimester). Monson and MacMahon (1984) [62] reported higher risks in the first and second trimesters (1.9-fold increased) than in the third trimester (1.3-fold increased).
Table 7.
Risk of childhood cancer according to the trimester of prenatal diagnostic x-ray exposure based on medical records: Oxford Survey of Childhood Cancer case-control study.
| Trimester of Exposure | Fetal Age in Weeks | No. Cases / No. Controls | Odds Ratiosa |
|---|---|---|---|
| First trimester | 0 - 13 | 51 / 16 | 2.7 |
| Second trimester | 14 - 26 | 75 / 58 | 0.9 |
| Third trimester | 27 - 40 | 1317 / 1014 | 1.0 |
Source: Gilman et al. 1988 [128]
Adjusted for sex, birth year, social class, maternal age, birth order, exposure-age or film number (e.g., average number of films was higher for the first trimester than for later diagnostic x-ray assessment)
Reasons for diagnostic radiological examinations of pregnant women
The OSCC data revealed that most (95 percent) of the diagnostic x-rays during pregnancy were obtained for obstetrical reasons, including about one-third for twin births, one-quarter for malposition, and one-sixth for pelvimetry (Table 8). Only a small number of radiologic examinations in pregnancy were for non-obstetrical problems, and half of these procedures involved examinations with contrast media. Pediatric cancer in offspring was on average 30 percent increased (odds ratios ranged from 1.0 to 1.8) among mothers undergoing radiologic examinations for obstetrical reasons, and on average 70 percent increased (odds ratios ranged from 1.4 to 2.1) among mothers x-rayed for non-obstetrical reasons [80].
Table 8.
Risk of childhood cancer according to the reason and timing of the prenatal diagnostic x-ray exposure based on medical records: Oxford Survey of Childhood Cancer case-control study
| Reason for X-ray | # Cases X-rayed |
# Controls X-rayed |
Odds Ratios | ||||||
|---|---|---|---|---|---|---|---|---|---|
| Trimester |
Trimester |
||||||||
| 1 | 2 | 3 | All | 1 | 2 | 3 | All | ||
| All Obstetric | 15 | 58 | 1,299 | 1,372 | 7 | 44 | 996 | 1,047 | 1.3 |
| Twins | 3 | 27 | 429 | 459 | 1 | 18 | 316 | 335 | 1.4 |
| Malposition | 0 | 4 | 318 | 322 | 0 | 7 | 271 | 278 | 1.2 |
| Disproportion | 0 | 0 | 133 | 133 | 0 | 0 | 125 | 125 | 1.1 |
| Fetal Abnormality | 0 | 7 | 60 | 67 | 0 | 3 | 34 | 37 | 1.8 |
| Placenta previa | 0 | 0 | 48 | 48 | 0 | 0 | 41 | 41 | 1.2 |
| Pelvimetry | 10 | 14 | 212 | 236 | 5 | 12 | 134 | 151 | 1.6 |
| Prolonged labor | 0 | 0 | 2 | 2 | 0 | 0 | 2 | 2 | 1.0 |
| Fetal maturity | 2 | 6 | 97 | 105 | 1 | 4 | 73 | 78 | 1.4 |
| All Non-Obstetric | 36 | 17 | 18 | 71 | 9 | 14 | 18 | 41 | 1.7 |
| Pyelogram | 7 | 8 | 1 | 16 | 4 | 4 | 3 | 11 | 1.4 |
| Other contrast | 15 | 3 | 1 | 19 | 4 | 4 | 1 | 9 | 2.1 |
| X-ray, no contrast | 14 | 6 | 16 | 36 | 1 | 6 | 14 | 21 | 1.7 |
| All Reasons | 51 | 75 | 1,317 | 1,443 | 16 | 58 | 1,014 | 1,088 | 1.3 |
Source: Gilman et al. 1988 [128]
Risks of pediatric cancer by year of birth and mean numbers of films per examination
The OSCC reported that the proportion of control mothers whose children were x-rayed during pregnancy rose from 2.7 percent for births during 1946–47 to 12.9 percent for births during 1954–55, before declining to 8.3 percent for children born in 1962–63 [82] (Table 9). Within a decade, however, the proportion of mothers x-rayed during pregnancy increased to the same levels as before initial reports by Stewart et al (Table 10) [37, 83]. In the northeast U.S., medical records revealed that 9.8 to 10.5 percent of control mothers were x-rayed for births during 1947–50 through 1955–57, before decreasing to 7.1 percent x-rayed for births during 1958–60 (Table 12). Data are lacking for the period 1961–71 in the U.S.; hence, it is not possible to ascertain whether the declining trend continued or reversed.
Table 9.
Trends in the proportion of children ages 0–15 in the United Kingdom whose mothers underwent abdominal x-ray examinations during pregnancy by year of birth (1946–47 through 1962–63; data from cases and controls enrolled in the Oxford Survey of Childhood Cancer case-control study).
| Year of birth | Numbers of Cases/Controls | % Control Mothers X-rayed | % Case Mothers X-rayed | Odds Ratios |
|---|---|---|---|---|
| 1946 - 47 | 329 / 329 | 2.7 | 13.1 | 5.4 |
| 1948 - 49 | 578 / 578 | 7.8 | 14.2 | 2.0 |
| 1950 - 51 | 827 / 827 | 8.9 | 16.9 | 2.1 |
| 1952 - 53 | 1,008 / 1,008 | 12.2 | 15.9 | 1.4 |
| 1954 - 55 | 957 / 957 | 12.9 | 19.4 | 1.6 |
| 1956 - 57 | 864 / 864 | 12.7 | 19.6 | 1.7 |
| 1958 - 59 | 805 / 805 | 9.4 | 11.2 | 1.2 |
| 1960 - 61 | 509 / 509 | 9.0 | 11.8 | 1.4 |
| 1962 - 63 | 278 / 278 | 8.3 | 10.4 | 1.3 |
Sources: Totter and MacPherson 1981 [82] and Gilman et
Table 10.
Trends in the proportion of children in the United Kingdom whose mothers underwent abdominal x-ray examinations during pregnancy by year of birth (1940–78) and age of the child (data from control children enrolled in the Oxford Survey of Childhood Cancer case-control study)
| Ages 0–5 | Ages 6–9 | Ages 10–15 | ||||
|---|---|---|---|---|---|---|
| Year of Birth | % X-rayed | Mean films per examination | % X-rayed | Mean films per examination | % X-rayed | Mean films per Examination |
| 1940–41 | --- | --- | --- | --- | 18.2 | 1.0 |
| 1942–43 | --- | --- | 11.1 | 1.0 | 3.9 | 1.0 |
| 1944–45 | --- | --- | 8.3 | 1.4 | 7.0 | 1.0 |
| 1946–47 | 4.0 | 2.3 | 2.0 | 4.5 | 2.7 | |
| 1948–49 | 7.2 | 2.0 | 7.3 | 1.9 | 6.3 | 1.8 |
| 1950–51 | 9.9 | 2.4 | 8.0 | 2.4 | 11.1 | 1.8 |
| 1952–53 | 11.8 | 2.3 | 13.2 | 2.5 | 13.8 | 2.1 |
| 1954–55 | 10.7 | 2.2 | 16.4 | 2.2 | 12.5 | 1.9 |
| 1956–57 | 13.8 | 2.0 | 13.0 | 1.7 | 13.1 | 2.2 |
| 1958–59 | 9.3 | 1.7 | 11.8 | 1.5 | 12.8 | 1.0 |
| 1960–61 | 9.7 | 1.5 | 9.0 | 1.1 | 11.1 | 1.1 |
| 1962–63 | 10.4 | 1.3 | 17.1 | 1.5 | 10.7 | 1.6 |
| 1964–65 | 12.9 | 1.3 | 13.4 | 1.3 | 8.1 | 1.0 |
| 1966–67 | 11.3 | 1.4 | 13.9 | 1.5 | 11.3 | 1.5 |
| 1968–69 | 12.8 | 1.5 | 8.7 | 1.6 | 12.5 | 1.0 |
| 1970–71 | 14.3 | 1.3 | 19.8 | 1.4 | --- | --- |
| 1972–73 | 17.3 | 1.4 | 0.0 | --- | --- | --- |
| 1974–75 | 16.3 | 1.5 | --- | --- | --- | --- |
| 1976–77 | 8.9 | 1.3 | --- | --- | --- | --- |
| 1978 | 50.0 (6 pairs) | 1.7 | --- | --- | --- | --- |
| Total | 11.7 | 1.7 | 11.2 | 1.8 | 10.3 | 1.7 |
Table 12.
Trends in the proportion of children in the Northeast United States whose mothers underwent abdominal x-ray examinations during pregnancy by year of birth (1947–60) and corresponding rate of childhood cancer in birth cohorts
| Year of birth | Total Number of Children | % X-rayed | Leukemia Rate/10,000 | Solid Cancers Rate/10,000 |
|---|---|---|---|---|
| 1947–1950 | 3,752 | 9.9 | 5.2 | 3.8 |
| 1951–1954 | 4,175 | 10.5 | 4.5 | 4.2 |
| 1955–1957 | 3,129 | 9.8 | 3.7 | 3.2 |
| 1958–1960 | 3,220 | 7.1 | 3.1 | 2.7 |
Source: Monson and MacMahon 1984 [62]
Despite the short-lasting reduction in the proportion of control mothers x-rayed during pregnancy and in the mean number of films per examination in the UK following the 1956 and 1958 publications from the OSCC [37, 83] (Table 10,11), there was a dramatic decrease in pediatric cancer risks in offspring of mothers undergoing diagnostic medical radiation during pregnancy compared with offspring of unexposed mothers during the period 1946–67 through 1962–63. From a 5.4-fold excess of pediatric cancer among offspring born during 1946–47 to exposed vs unexposed mothers, risk dropped dramatically to a 1.3-fold increase among children born in 1962–63 to exposed vs unexposed mothers in the UK (Table 9). Similarly, U.S. mortality rates for pediatric leukemia declined from 5.2 to 3.1 per 10,000 children for children born during 1947–50 and 1958–60, respectively, and mortality for pediatric solid tumors decreased from 3.8 to 2.7 per 10,000 children during the same time period, although some of this decline may have reflected improvements in treatment (Table 12).
Nationwide U.S. data revealed a decline in the proportion of mothers undergoing abdominal x-rays during pregnancy from 6.0 percent for children born during 1972–80 to 1.8 percent for children born during 1987–92 that paralleled a decrease in the estimated relative risk for childhood leukemia among offspring of mothers reporting diagnostic medical radiation during pregnancy compared with offspring of mothers reporting no exposure. Risks of pediatric acute lymphoblastic leukemia declined from an excess estimated relative risk of 2.4 to no excess risk for offspring born during 1972–80 and during 1987–92, respectively, for children born to exposed vs unexposed mothers [73] (Table 13). The decreases in risk of pediatric cancer in the UK and US correlated with the estimated exponential declines in fetal doses during the same period (see section describing impact on clinical practice below) [37, 60, 81]. The parallel in trends between the notable decline in risks and estimated fetal doses has been interpreted as consistent with a causal association [16].
Table 13.
Trends in the proportion of children in multiple centers throughout the United States and parts of Canada whose mothers underwent abdominal x-ray examinations during pregnancy by year of birth (1972–92) and corresponding risk of childhood acute lymphoblastic leukemia.
| Year of birth | Age at Leukemia Diagnosis | # Case Mothers with Abdominal X-rays | Odds Ratios | 95% CI | % Case Mothers with Abdominal X-rays | % Control Mothers with Abdominal X-rays |
|---|---|---|---|---|---|---|
| 1972 - 1980 | 11 - 14 | 24 | 2.4 | (1.2 – 5.0) | 10.2 | 6.0 |
| 1981 - 1986 | 6 - 10 | 11 | 0.7 | (0.3 – 1.5) | 2.4 | 2.3 |
| 1987 - 1992 | 0 - 5 | 15 | 1.0 | (0.5 – 2.0) | 1.3 | 1.8 |
Source: Shu et al. 2002 [73]
Pre-natal diagnostic medical radiation and childhood cancer risks: cohort studies
Singletons
Several cohort studies have examined risks of pediatric cancer in offspring whose mothers underwent medical diagnostic radiation exposures during pregnancy compared with risks in offspring of unexposed mothers (reviewed in [16]) (Table 14). The rarity of childhood cancer resulted in 13 or fewer childhood cancer cases in each of the various cohorts that included 491 to 19,889 exposed and 468 to 35,753 unexposed mothers. Doll and Wakeford (1997) [16], reported a summary overall risk of 1.2 from most of these cohorts (95% confidence intervals = 0.7–2.0), and interpreted these results as statistically compatible with an excess risk of 40 percent from the case-control studies. A more recent assessment of the cohort studies by the International Commission on Radiation Protection (ICRP) [13] estimated an overall relative risk of 1.08 (95% confidence intervals = 0.78–1.50), again interpreted as compatible with risks from the OSCC and other case-control studies. The ICRP Committee noted that three case-cohort [62] or nested case-control studies [84, 85], which incorporated study designs based on cohort studies and relied exclusively on medical records to ascertain prenatal x-ray exposures, together demonstrated a combined relative risk estimate of 1.47 (95% confidence interval 1.24–1.75) based on 199 pediatric cancer cases in the irradiated group.
Table 14.
Cancer mortality rates in cohorts of children whose mothers underwent diagnostic-x-rays during pregnancya
| Number of cancer deaths in exposed and unexposed |
|||||
|---|---|---|---|---|---|
| Study, Yr Published, Location | Years of Birth | Exposed | Unexposed | Observed - Expected | Var (O-E) |
| Diamond EL et al, 1973 Baltimore |
1947–59 | 13/19,889 | 23/35,753 | 0.1 | 8.3 |
| Lejeune J et al, 1960 Paris |
1947–52 | 2/491 | 0/468 | 1.0 | 0.5 |
| Lewis TLT, 1960 London |
1943–58 | 1/11,443 | 7/33,752 | −1.0 | 1.5 |
| Magnin P, 1962 Lyon |
1948–56 | 1/5,353 | 1/5,353 | 0.0 | 0.5 |
| Griem ML et al, 1967 Chicago |
1947–49 | 4/982 | 6/1,759 | 0.4 | 2.3 |
| Hagstrom RM et al, 1969 Nashville |
1945–49 | 4/634 | 0/655 | 2.0 | 1.0 |
| Total | 2.5 | 14.1 | |||
Source: Doll and Wakeford 1997 [16]
Twins
Because a large fraction of mothers of twins (e.g., up to half) had undergone prenatal diagnostic radiologic examinations, pediatric cancer risks were evaluated in several cohorts of twins. Risks of pediatric cancer were not increased in these twin populations (reviewed in [17]) (Table 15).
Table 15.
| Study, Yr Published, Location | Years of Birth | Number of Twins | Cancer |
Relative Risk | |
|---|---|---|---|---|---|
| Observed | Expected | ||||
| Hewitt D et al, 1966 United Kingdom |
1943–63 | Not provideda | 121 | 152 | 0.80 |
| Jackson EW et al, 1969, California | 1940–64 | 145,708 | 100 | 110.6 | 0.90 |
| Inskip PD et al, 1991, Connecticut | 1930–69 | 30,925 | 31 | 46.4 | 0.67 |
| Windham CC et al, 1985 Norway |
1967–79 | 14,504 | 14 | 15.6 | 0.96 |
| Rodvall Y et al, 1992, Sweden | 1952–67 | 35,582 | 59 | 61.7 | 0.96 |
Source: Boice and Miller 1999 [17]
Proportion undergoing pelvimetry x-rays was not determined, but range reported was 30–55%
Data are based on the first 5,763 deaths included in the Oxford Survey of Childhood Cancers
Impact on clinical practice of reports linking prenatal radiation and pediatric cancer
Although the rationale for establishing the Adrian Committee in the UK in 1957 was to review practices in obstetric diagnostic radiology in light of concerns about medical radiation-related genetic hazards, the surveys implemented by the Committee provided useful information about obstetrical practices and estimated radiation doses from the perspective of the OSCC studies of prenatal diagnostic medical radiologic procedures and pediatric cancer risks in offspring. Recommendations from the Adrian committee included limiting the x-ray beam to useful areas of film, implementation of standardized methodology in pelvimetry, reducing the number of projections in a pelvimetric examination to a single lateral view, and reducing the film number per examination [41] The surveys and subsequent monitoring of radiologic procedures and associated radiation dose estimates in obstetrical practice suggested that the impact of the reports from the initial OSCC epidemiologic studies lasted for only a few years [41, 86–89] (Table 10), and that use of obstetrical diagnostic radiologic procedures continued to vary substantially by locality [37, 83, 90]. The faster films, rare earth screens and other technical changes introduced in the late 1950s (as reviewed in Mole, [37]) may have played a more important role in the 50 percent reduction in fetal gonadal dose that was apparent from 1978–79 measurement data [37, 89]. However, the development and growth in use of sonography for fetal surveillance did not have as large an impact as expected in reducing the use of x-rays in pregnancy [83].
Prenatal sonography and pediatric cancer risk
As sonography began to replace obstetrical abdominal radiography and pelvimetry during the 1970s in evaluation of fetal growth, abnormalities, and medical aspects related to delivery [91], concerns arose about potential carcinogenicity of single and repeated sonography examinations. Case-control studies in the UK [92–94] showed no evidence of an excess of childhood leukemia or solid tumors in offspring of mothers undergoing sonography during pregnancy. No relationship was observed for sonography with childhood leukemia in Mexico [95], childhood leukemia in China [72], pediatric acute myeloid leukemia in the Netherlands [74], or pediatric acute lymphoblastic leukemia in the U.S. or Canada [73].
Postnatal early life exposures to diagnostic radiation and pediatric cancer risks
Compared to the effects of in-utero radiation exposure on childhood cancer, the effects of post-natal diagnostic exposure have been much less studied. While there are several large, well-conducted studies of therapeutic radiation in childhood (e.g. therapeutic radiation for childhood cancer, or radiation treatment for benign conditions) that indicate an elevated risk of cancer later in life, in this review we focus on studies of diagnostic radiation exposure and risk of childhood cancer. Table 16 summarizes those studies with at least 75 cancer cases. In instances where both diagnostic and therapeutic x-rays were examined, both estimates are included for comparison of risk magnitude.
Table 16.
Risk of specific and total childhood cancers associated with early postnatal medical radiation exposure
| Author, Year published Country, Study duration |
Upper age limit |
No, cases/no. controls |
Type of Cases |
Type of Controls | Method of exposure assessment |
Type of Exposure | Exposure prevalence in controls |
Estimated Medical Risk |
|
|---|---|---|---|---|---|---|---|---|---|
| Leukemia | |||||||||
| Stewart, 1958 Great Britain, 1953–55 |
10 | 619 / 619 | Deceased | Population | Interview, Medical Records | Diagnostic Therapeutic |
12.9 0.2 |
1.2 5.0 |
|
| Polhemus and Koch, 1959 USA, Los Angeles 1950–7 |
NS | 251 / 251 | Incident | Hospital | Questionnaire | Diagnostic Fluoroscopy Therapeutic |
41.4 3.2 3.6 |
2.1* 3.5* 3.7* |
|
| Ager, 1965 USA, Minnesota, 1953–7 |
4 | 109/ 102 (sibs) 110 (neigh) |
Deceased | Siblings Neighborhood |
Interview, Medical Records | Any | 16.7 18.2 |
1.3 1.1 |
|
| Graham, 1966 USA, New York State, Baltimore and Minneapolis-St Paul, 1959–62 |
14 | 319 / 884 | Incident | Population | Medical Records | Any >1 site |
36.0 7.6 |
1.2 2.1 |
|
| Shu, 1988 China, Shanghai, 1974–86 |
14 | 309 / 618 | Incident, Prevalent | Population | Interview | Any | 27.3 | 0.9 | |
| Fajardo-Gutierrez 1993 Mexico, Mexico city |
14 | 79 / 148 | Incident, Prevalent | Population, Hospital | Interview | Any | 27.0 | 1.1 | |
| Acute lymphoblastic leukemia | |||||||||
| Shu, 1988 China, Shanghai, 1974–86 |
14 | 172 / 618 | Incident, Prevalent | Population | Interview | Any | 27.3 | 0.9 | |
| Magnani, 1990 Italy, Turin 1981–84 |
n/s | 142 / 307 | Incident, Prevalent | Hospital | Interview | Diagnostic | 45.9 | 0.7 | |
| Shu et al, 1994 China, Shanghai, 1986–91 |
14 | 166 / 166 | Incident | Population | Interview | Any | -- | 1.6 | |
| Shu, 2002 USA, 1989–93 |
15 | 1842 / 1986 | Incident | Population | Interview | Diagnostic | 39 | 1.1 | |
| Infante-Rivard, 2003 Canada, Quebec, 1980–98 |
14 | 701 / 701 | Incident | Population | Interview | Diagnostic 1 2 or more |
19.1 18.8 |
1.1 1.5* |
|
| Acute myeloid leukemia | |||||||||
| Shu, 1988 China, Shanghai, 1974–86 |
14 | 92 / 618 | Incident, Prevalent | Population | Interview | Any | 27.3 | 1.0 | |
| Lymphoma | |||||||||
| Shu et al, 1994a China, Shanghai, 1981–91 |
14 | 87/166 | Incident | Population | Interview | Any | -- | 1.6* | |
| Brain tumors | |||||||||
| Howe et al, 1989 Canada, Toronto, 1977–83 |
19 | 74 / 138 | Incident | Population | Interview | Chest diagnostic Skull diagnostic |
8.0 4.3 |
2.1 6.7* |
|
| McCredie, 1994 Australia, NSW, 1985–89 |
14 | 82 / 164 | Incident | Population | Interview | Dental, Skull diagnostic | 9.1 2.4 |
0.4 2.3 |
|
| Shu, 1994 China, Shanghai, 1981–91 |
14 | 107 / 107 | Incident | Population | Interview | Any | -- | 1.5 | |
| Schuz, 2001 Germany, 1993–1997 |
15 | 466 / 2458 | Incident | Population | ** | ** | ** | ** n.s. | |
| Astrocytoma | |||||||||
| Kuijten, 1990 Usa, pa, nj, de, 1980–86 |
14 | 163 / 163 | Incident | Rdd | Interview | Head or neck Dental |
N/s N/s |
1.0 0.9 |
|
| Bunin, 1994 Usa, canada (ccg), 1986–89 |
5 | 155 / 155 | Incident | Rdd | Interview | Head, neck or dental Dental Head |
13.5 9.0 3.2 |
1.2 1.0 1.1 |
|
| Pnet | |||||||||
| Bunin, 1994 Usa, canada (ccg), 1986–89 |
5 | 166 / 166 | Incident | Rdd | Interview | Head, neck or dental Dental Head |
12.0 8.4 4.2 |
1.1 0.5 0.9 |
|
| Neuroblastoma | |||||||||
| Greenberg, 1983 Usa, north carolina, 1972–81 |
14 | 104 / 208 (hosp) 105 (wilm) |
Incident | Hospital Wilm’s |
Medical records | Chest x-ray Cranial x-ray Abdominal x-ray |
33.2 11.7 6.2 1.3 6.7 3.9 |
0.3* 2.0 0.3 1.6 0.4 0.8 |
|
| Osteosarcoma | |||||||||
| Gelberg, 1997 Usa, new york state |
24 | 130 / 130 | Incident | Population | Interview | Medical | N/s | 1.0 | |
| Ewing’s sarcoma | |||||||||
| Daigle, 1987 Usa, minnesota, 1975–81 |
20 | 98 / 98 95 / 95 |
Incident, prevalent | Rdd Siblings |
Interview | Any | N/s N/s |
1.0 1.0 |
|
| Winn, 1992 Usa, multicenter, 1983–85 |
22 | 204 / 204 191 / 191 |
Incident | Rdd Siblings |
Interview Interview |
Diagnostic Dental Diagnostic Dental |
37.7 50.0 39.8 53.9 |
1.6* 1.2 1.6 0.9 |
|
| All sites | |||||||||
| Stewart, 1958 Great britain, 1953–55 |
10 | 1299 / 1299 | Deceased | Population | Interview, Medical records | Diagnostic Therapeutic |
13.6 0.2 |
1.0 2.7 |
|
| Hartley, 1988 UK: North West, West midlands, Yorkshire, 1980–83 |
14 | 535 / 1068 465 / 928 |
Incident | General Practitioner, Hospital |
Interview, Medical records |
Neonatal diagnostic | 0.3 1.0 |
2.0 1.1 |
|
| Shu, 1994 China, Shanghai |
14 | 642 / 642 | Incident | Population | Interview | Any | -- | 1.3* | |
Source: Little, 1999 [12]
Statistically significant
Risks for all pediatric cancers combined with exposure to early life diagnostic radiation
The Oxford Childhood Cancer Survey noted no association between early life diagnostic exposure and risk of all childhood cancers [9]. Although another UK study observed a non-statistically significant association between childhood cancer risk and diagnostic radiation using interview data, this association disappeared when medical records data were used, suggesting the possibility of reporting bias [96].
Risks for childhood leukemia with exposure to early life diagnostic radiation
While two studies detected a significantly elevated risk of leukemia with exposure to diagnostic radiation [67, 97, 98], these studies used questionnaire data to assess exposure to diagnostic x-rays. Other investigations, including studies using medical records to verify x-ray exposure, did not report significantly increased risk of leukemia (Table 16). It is worth noting that in one U.S. study, a slightly elevated risk was observed when exposure was ascertained using interview data, but this association was not seen when medical record data were used, suggesting the possibility of recall or reporting bias with interview data [99]. Although one study reported possible effect modification by variants in the DNA mismatch repair genes hMSH3 (ex23 variant) and hMLH1 (ex8 variant), results were sex-specific and were not consistent between the first and second phase of the study [97, 98]. Examination of risk childhood acute lymphoblastic leukemia by immunophenotype indicated a possible increased susceptibility to diagnostic x-rays for individuals with pre-B cell ALL (OR=1.7, 95% CI=1.1, 2.7) [73].
Risks for childhood brain tumors with exposure to early life diagnostic radiation
In general, studies of diagnostic x-ray examinations and risk of childhood brain tumors, including studies of astrocytoma specifically, have not observed an increased risk with exposure (reviewed in Little [12]). Although one study of brain tumors observed an increased risk of childhood brain tumors in individuals with a history of five or more full mouth dental x-rays at least 10 years before diagnosis [76], this has generally not been confirmed in other studies. A positive dose-response for chest and skull x-rays taken 5 or more years before diagnosis was noted in one study, but the investigators also noted an increased risk of brain tumors with head/neck injuries requiring medical attention, raising the possibility that the observed association could have been due to reverse causality (i.e. early symptoms of brain tumors led to brain x-ray) [100].
Risks for other childhood cancers with exposure to early life diagnostic radiation
While other specific cancer sites have been less studied, no consistent association has been observed for diagnostic radiation exposure and risk of childhood lymphoma, osteosarcoma, Ewing’s sarcoma, soft-tissue sarcoma, or neuroblastoma (reviewed in Little [12]). One Chinese study reported increased risk of lymphoma with diagnostic x-rays, but exposure was ascertained using interview data, and this finding has not been replicated [72]. Increased risk of Ewing’s sarcoma with interview-assessed diagnostic x-ray exposure was reported by one US study [101], but not another [79].
Overall, there is very little evidence that exposure to post-natal diagnostic exposure increases childhood cancer risk. However, it is noteworthy that repeated exposure to diagnostic exams during adolescence has been associated with increased risk of breast cancer later in life in patients with scoliosis [102, 103], and there has been some suggestion that exposure to dental x-rays in childhood may increase risk of meningioma later in life [104]. Exposure to low-to-moderate levels of environmental ionizing radiation at an early age has also been shown to increase later-life cancer risk in individuals exposed to atomic bomb radiation [105]. It is thus possible that if a small increased risk of cancer due to diagnostic radiation exposure exists, most studies are not adequately powered or have limited assessment of childhood and adolescent cancer occurrence, and thus failed to be able to detect onset of cancer later in life.
Preconception parental exposures to diagnostic radiation and pediatric cancer risks
Maternal preconception diagnostic radiation
Studies examining risk of pediatric cancer associated with maternal preconception exposure to diagnostic medical radiation are difficult to evaluate and to compare because the time window of exposure is difficult to standardize, the key anatomic sites of exposure are not emphasized, the role of the medical indication for the radiologic examination is not examined, therapeutic radiation and occupational radiation exposures are sometimes not considered, and the modest body of literature is inconsistent and difficult to interpret. In the first report of the OSCC on this topic [9], risk of total childhood cancer was associated with abdominal x-ray exposures prior to marriage, but there was a deficit of exposed mothers of cases between marriage and conception of the relevant child. Risk was not increased in a subsequent OSCC investigation of this issue [106]. Most studies found no associations [69, 70, 72, 107–112], although a few reported increased risks [64, 113].
Paternal preconception diagnostic radiation
Studies of paternal preconception exposure to diagnostic medical radiation and risk of pediatric cancer are characterized by the same methodological problems as those focusing on maternal exposures, and the findings have been inconsistent. Most epidemiologic investigations of paternal preconception diagnostic radiation exposures have found no association with risk of pediatric cancer [70, 72, 106, 108].
Trends in childhood cancer
It is difficult to ascertain whether the notably decreasing diagnostic medical radiation exposures were responsible for declining rates of total childhood cancer or specific forms of pediatric cancer between the late 1950s and throughout the 1960s because the primary pediatric cancer outcomes monitored were death rates and childhood cancer treatment advances resulted in decreasing mortality during the same time period. Population-based monitoring of pediatric cancer incidence began in most cancer registries in the 1970s or later, after ultrasonography largely replaced obstetrical abdominal x-rays and pelvimetry. Long-standing cancer incidence trend data from the oldest population-based cancer registries demonstrate notable increases in incidence of acute leukemia among children ages 0–4, but not among older children during the period 1935–39 through 1975–79 in Connecticut [114] and Denmark (where ascertainment of cancer incidence commenced in 1943), although there was little evidence of an increase in rates of childhood cancer at all ages in Denmark during 1943–80 [115]. Increases in incidence of childhood acute lymphoblastic leukemia in Great Britain among children born after 1964 and diagnosed during 1968–78 primarily reflected statistically significant increases among boys aged 0–4 years old at diagnosis and to a lesser extent for girls in this age group [116]. There was no clear explanation for these findings in the UK, although the investigators noted that data from Denmark and Sweden provided some support for an increase in pediatric acute lymphoblastic leukemia among children at the youngest ages [116].
Methodological Issues
Given the rarity of childhood cancer, particularly when specific sub-types are considered, it can be difficult to assemble large studies with adequate power to detect small to moderate increases in risk. Furthermore, the accurate classification of pediatric cancers, especially with regards to histological sub-types, poses a further challenge, as does the classification of radiation exposure status in study subjects, particularly when exposure assessment relies on interview data or medical records or radiologic reports are missing.
The majority of the evidence regarding in-utero/early childhood radiation exposure and childhood cancer risk comes from case-control studies. Although case-control studies generally have more cases and therefore higher statistical power than cohort studies, they are more prone to reporting or recall bias, which can occur if parents of cases classify exposure differently than do control parents. These biases can lead to inflated measures of risk. Cohort studies, while less susceptible to recall bias, are particularly vulnerable to small numbers of outcomes of rare conditions such as childhood cancers.
While most information concerning possible cancer risks attributable to diagnostic x-ray exposures comes from studies in which history of diagnostic radiologic examinations was ascertained by interview or questionnaire, substantial disagreement has been observed between numbers of x-ray examinations reported in the interview and number of x-ray exams in medical records, with reporting generally being poorer among controls [117]. In a situation where reporting errors are non-differential between cases and controls, one would expect estimates of risk to be attenuated but unbiased. In populations with a high frequency of exposure, however, spurious associations with numbers of x-ray examinations or radiation dose could arise because of recall differences.
As with all epidemiological studies, the relationship between radiation and childhood cancer risk can be masked by confounding factors which are associated with both exposure and disease, but not part of the causal pathway. Further, models of radiation exposure and cancer risk are subject to a number of statistical uncertainties, and for accurate assessment of these risks, uncertainties should be taken into account.
Clinical and public health policy implications
Results from epidemiologic studies of cancer risks associated with medical diagnostic radiation exposures during the prenatal period (summarized above), radiation therapy during childhood and adolescence [118–122], radiation exposures to pregnant women [105] and to children [35] from the atomic bombings of Hiroshima and Nagasaki, and the environmental radiation exposures to young persons from the Chernobyl accident [123, 124] have demonstrated that cancer risks from all forms of ionizing radiation exposure are cumulative, and cancer continues to increase decades after the initial radiation exposures [35, 105]. Evidence from radiobiology and epidemiology has demonstrated that radiation exposure is linked with acute and chronic health effects and potential molecular changes, and that risks increase with radiation dose (although the specific form of the dose-response curve remains unclear at low levels of exposure). For cancer induction in utero, the ICRP has concluded that it is likely that cancer risks exist from the beginning of major organogenesis to the end of pregnancy [13]. An important consideration from the clinical and radiation protection perspective is that adult women may be unaware that they are pregnant at the time of diagnostic radiological examination.
An important issue for clinical practice is whether radiologic machine exposure settings have been appropriately adjusted for pediatric patients. Results suggest that increasing attention is being paid to this issue based on data from recent surveys in the UK and Germany (Table 2), but assessment is needed in other countries. More effort should be given to development of standardized protocols for optimizing exposure settings according to patient size and clinical indication for a given examination.
From the policy perspective, radiologists and other physicians ordering and performing procedures involving ionizing radiation should make every effort to reduce the types and numbers of unnecessary radiologic procedures. Additional efforts are needed from professional medical societies to promote education in radiation sciences, particularly for non-radiologists who are performing radiologic procedures, and to provide recommendations and standardized protocols to reduce radiation exposures. Physicians and public health practitioners can play an important role through education of patients on the risks as well as the benefits associated with radiologic procedures. Professional societies, regulators, and the public should strongly encourage manufacturers to identify and implement new technologies for reducing radiation doses while maintaining image quality. Regulators should support ongoing surveys to estimate radiation doses from all radiologic procedures, and should report widely the results of the surveys, underscore the need for education and training of all physicians who order and perform radiologic procedures, and ensure written reporting of estimated doses from radiologic procedures to patients.
Gaps in understanding and research needs
Compared to adults, pediatric patients receive a higher radiation dose for the same exposure setting, are more sensitive to radiation, and have more years of life expectancy and thus more years at risk of cancer occurrence compared to adults. However, nationwide survey data on radiation doses from medical radiologic procedures carried out in pediatric patients are more limited than those for adults. Although there have been several national surveys in the UK and recently in Germany and the U.S., there are few surveys in other countries. Data are also limited for ascertaining temporal trends (e.g., to ascertain whether radiation doses to pediatric patients from medical procedures are decreasing or increasing and whether exposure settings are well optimized). Limited data from single or multiple institutions suggest that radiation doses vary within and between medical institutions and among countries. Thus, nationwide surveys are needed in many countries, particularly for higher-dose procedures such at CT, nuclear medicine studies and fluoroscopically-guided diagnostic procedures. It is also critical to collect population-based dose data to estimate doses to embryos and fetuses from maternal obstetric and non-obstetric medical radiologic procedures.
Notable advances in imaging technology in conjunction with increasing employment of computed tomography (CT) scans, nuclear medicine and fluoroscopically-guided procedures have led to medical radiation overtaking environmental radiation sources in accounting for the largest fraction of the population collective dose [18]. Although radiographic procedures accounted for close to two-thirds, while CT comprises 18 percent and interventional procedures 3 percent of the estimated number of radiologic procedures at all ages in the U.S. in 2006, CT was responsible for 50 percent of the estimated collective population dose, compared with 13 percent from interventional procedures and 10 percent from radiography [18]. Gaps remain in understanding of radiation-related carcinogenesis of in utero diagnostic medical radiation exposures including reasons for the stronger associations shown by case-control than by cohort studies, uncertainty about whether risks of pediatric solid tumors are lower than those for pediatric leukemia, lack of information about lifetime cancer risks from prenatal exposures and the magnitude of the risks during adult years [125]. Carcinogenic risks associated with exposures very early in pregnancy are not well quantified. Forthcoming follow-up data from cohorts exposed during pregnancy to ionizing radiation (e.g., those experiencing environmental radiation exposures from the Chernobyl accident and those exposed to radionuclides contaminating the Techa River in Russia) will be useful for clarifying the results from the long-term follow-up of the atomic bomb survivors who were in utero at the time of the bombings [105]. In addition, it would be helpful to determine the feasibility of assembling and following up large cohorts comprised of offspring of women who underwent CT procedures during pregnancy. More knowledge is also needed on cancer risks associated with protracted or fractionated radiation exposures during pregnancy.
Information is limited on cancer risks associated with diagnostic radiographic, CT and fluoroscopically guided procedures during early childhood. Because of the dramatic increase in the numbers of children undergoing CT examinations internationally, it is particularly urgent to study occurrence of pediatric, adolescent, and adult cancer risks associated with these procedures. No epidemiologic studies have reported cancer risks associated with childhood and adolescent exposures to CT scans, but newly launched investigations should provide such information within a few years.
Table 11.
Trends in the mean number of films per X-ray examination in childhood cancer cases and controls according to birth year and age at death for cases and corresponding age for matched controls
| Film Number per examination in birth year cohorts |
||||
|---|---|---|---|---|
| Age at Death of Cases & Corresponding Age for Controls | 1940–47 | 1948–57 | 1958–65 | 1966–69 |
| Cancer Cases | ||||
| 0 - 5 | --- | 2.3 | 1.7 | 1.4 |
| 6 - 9 | 3.1 | 2.4 | 1.5 | 1.3 |
| 10 - 15 | 2.1 | 1.7 | 1.4 | 1.0b |
| All Ages | 2.6 | 2.2 | 1.6 | 1.3 |
| Controls | ||||
| 0 - 5 | --- | 2.2 | 1.4 | 1.5 |
| 6 - 9 | 1.6 | 2.1 | 1.3 | 1.5 |
| 10 - 15 | 1.7 | 2.0 | 1.2 | 1.5a |
| All Ages | 1.7 | 2.1 | 1.4 | 1.5 |
Abbreviations
- CT
computed tomography
- DAP
dose area product
- ESD
entrance surface dose
- ICCC
International Classification of Childhood Cancer
- ICRP
International Commission on Radiation Protection
- MIRD
Medical Internal Radiation Dose
- mGy
milliGray
- mSv
milliSievert
- OSCC
Oxford Survey of Childhood Cancers
- UK
United Kingdom
References
- 1.Ries LAG, Melbert D, Krapcho M, et al., editors. SEER Cancer Statistics Review, 1975–2005. National Cancer Institute; Bethesda, MD: 2008. based on November 2007 SEER data submission, posted to the SEER web site( http://seer.cancer.gov/csr/1975_2005/), 2008. [Google Scholar]
- 2.Steliarova-Foucher E, Stiller C, Lacour B, et al. International Classification of Childhood Cancer, third edition. Cancer. 2005;103:1457–1467. doi: 10.1002/cncr.20910. [DOI] [PubMed] [Google Scholar]
- 3.Ross JA, Spector LG. Cancers in Children. In: Schottenfeld D, Fraumeni JF Jr, editors. Cancer Epidemiology and Prevention. 3. Oxford University Press; Bethesda, Maryland: 2006. pp. 1251–1261. [Google Scholar]
- 4.Parkin DM, Kramarova E, Draper GJ, et al. IARC Scientific Publications No. 144: International Incidence of Childhood Cancer. II. International Agency for Research on Cancer (IARC); Lyon, France: 1998. [Google Scholar]
- 5.Ries LAG, Smith MA, Gurney JG, et al. Cancer incidence and survival among children and adolecents: United States SEER program 1975–1995. National Cancer Institute, SEER program, NIH; Bethesda, Maryland: 1999. Pub. No. 99-4649. [Google Scholar]
- 6.Stiller CA, Parkin DM. Geographic and ethnic variations in the incidence of childhood cancer. British medical bulletin. 1996;52:682–703. doi: 10.1093/oxfordjournals.bmb.a011577. [DOI] [PubMed] [Google Scholar]
- 7.Parkin DM. Epidemiology of cancer: global patterns and trends. Toxicology letters. 1998;102–103:227–234. doi: 10.1016/s0378-4274(98)00311-7. [DOI] [PubMed] [Google Scholar]
- 8.Stewart AM, Webb J, Giles D, et al. Malignant disease in childhood and diagnostic irradiation in utero. Lancet. 1956;ii:447. doi: 10.1016/s0140-6736(56)91923-7. [DOI] [PubMed] [Google Scholar]
- 9.Stewart A, Webb J, Hewitt D. A survey of childhood malignancies. British medical journal. 1958;1:1495–1508. doi: 10.1136/bmj.1.5086.1495. [DOI] [PMC free article] [PubMed] [Google Scholar]
- 10.Wakeford R. The risk of childhood cancer from intrauterine and preconceptional exposure to ionizing radiation. Environmental health perspectives. 1995;103:1018–1025. doi: 10.1289/ehp.951031018. [DOI] [PMC free article] [PubMed] [Google Scholar]
- 11.Boice JD, Jr, Land CE, Preston DL. Ionizing radiation. In: Schottenfeld D, Fraumeni JF Jr, editors. Cancer Epidemiology and Prevention. 2. Oxford University Press; New York, New York: 1996. pp. 319–346. [Google Scholar]
- 12.Little J. IARC Scientific Publication No. 149: Epidemiology of Childhood Cancer. International Agency for Research on Cancer (IARC); Lyon, France: 1999. pp. 132–147. [Google Scholar]
- 13.ICRP. Publication 90: Biological effects after prenatal irradiation (embryo and fetus) 2003. pp. 167–170. [PubMed] [Google Scholar]
- 14.Schulze-Rath R, Hammer GP, Blettner M. Are pre- or postnatal diagnostic X-rays a risk factor for childhood cancer? A systematic review. Radiation and environmental biophysics. 2008;47:301–312. doi: 10.1007/s00411-008-0171-2. [DOI] [PubMed] [Google Scholar]
- 15.Bithell JF, Stiller CA. A new calculation of the carcinogenic risk of obstetric X-raying. Statistics in medicine. 1988;7:857–864. doi: 10.1002/sim.4780070804. [DOI] [PubMed] [Google Scholar]
- 16.Doll R, Wakeford R. Risk of childhood cancer from fetal irradiation. The British journal of radiology. 1997;70:130–139. doi: 10.1259/bjr.70.830.9135438. [DOI] [PubMed] [Google Scholar]
- 17.Boice JD, Jr, Miller RW. Childhood and adult cancer after intrauterine exposure to ionizing radiation. Teratology. 1999;59:227–233. doi: 10.1002/(SICI)1096-9926(199904)59:4<227::AID-TERA7>3.0.CO;2-E. [DOI] [PubMed] [Google Scholar]
- 18.Mettler FA., Jr . Annual meeting program -advances in radiation protection in medicine. Arlington, Virginia: 2007. Magnitude of radiation uses and doses in the United States: NCRP scientific committee 6-2 analysis of medical exposures; pp. 9–10. [Google Scholar]
- 19.Kim KP, Miller DL, Balter S, et al. Occupational radiation doses to operators performing cardiac catheterization procedures. Health physics. 2008;94:211–227. doi: 10.1097/01.HP.0000290614.76386.35. [DOI] [PubMed] [Google Scholar]
- 20.UNSCEAR. Sources and effects of ionizing radiation. United Nations Scientific Committee on the Effects of Atomic Radiation; New York. 2000. [Google Scholar]
- 21.Hewitt JM, Shuttleworth PG, Nelthorpe PA, et al. Improving protection standards in dental radiography. In: Goldfinch EP, editor. Radiation protection - Theory and practice. Institute of Physics; 1989. pp. 81–84. [Google Scholar]
- 22.Hart D, Hillier MC, et al. Dose to patients from radiographic and fluoroscopic x-ray imaging procedures in the UK - 2005 Review. Health Protection Agency; Chilton, UK: 2007. [Google Scholar]
- 23.Napier ID. Reference doses for dental radiography. British dental journal. 1999;186:392–396. doi: 10.1038/sj.bdj.4800121. [DOI] [PubMed] [Google Scholar]
- 24.Hart D, Hillier MC, et al. Dose to patients from medical x-ray examinations in the UK - 2000 Review. National Radiological Protection Board; Chilton, UK: 2002. [DOI] [PubMed] [Google Scholar]
- 25.Shrimpton PC, Hillier MC, et al. NRPB. Doses from computed tomography (CT) examinations in the UK - 2003 Review. National Radiological Protection Board; Chilton, UK: 2005. [Google Scholar]
- 26.Shrimpton PC, Jones DG, et al. NRPB. Survey of CT practice in the UK. Part 2 -Dosimetric aspects. National Radiological Protection Board; Chilton, UK: 1991. [Google Scholar]
- 27.Brenner DJ, Hall EJ. Computed tomography--an increasing source of radiation exposure. The New England journal of medicine. 2007;357:2277–2284. doi: 10.1056/NEJMra072149. [DOI] [PubMed] [Google Scholar]
- 28.Brix G, Nagel HD, Stamm G, et al. Radiation exposure in multi-slice versus single-slice spiral CT: results of a nationwide survey. European radiology. 2003;13:1979–1991. doi: 10.1007/s00330-003-1883-y. [DOI] [PubMed] [Google Scholar]
- 29.Gadd R, Mountford PJ, Oxtoby JW. Effective dose to children and adolescents from radiopharmaceuticals. Nuclear medicine communications. 1999;20:569–573. doi: 10.1097/00006231-199906000-00012. [DOI] [PubMed] [Google Scholar]
- 30.Galanski M, Nagel HD, Stamm G. Paediatric CT exposure practice in the Federal Republic of Germany - Results of a nation-wide survey in 2005/2006. Hannover Medical School; Hannover, Germany: 2006. [Google Scholar]
- 31.Onnasch DGW, Schroder FK, Fischer G, et al. Diagnostic reference levels and effective dose in paediatric cardiac catheterization. Brit J Radiol. 2007;80:177–185. doi: 10.1259/bjr/19929794. [DOI] [PubMed] [Google Scholar]
- 32.Piepsz A, Hahn K, Roca I, et al. A radiopharmaceuticals schedule for imaging in paediatrics. Paediatric Task Group European Association Nuclear Medicine. European journal of nuclear medicine. 1990;17:127–129. doi: 10.1007/BF00811439. [DOI] [PubMed] [Google Scholar]
- 33.Land CE. Studies of cancer and radiation dose among atomic bomb survivors. The example of breast cancer. Jama. 1995;274:402–407. [PubMed] [Google Scholar]
- 34.Preston DL, Kusumi S, Tomonaga M, et al. Cancer incidence in atomic bomb survivors. Part III. Leukemia, lymphoma and multiple myeloma, 1950–1987. Radiation research. 1994;137:S68–97. [PubMed] [Google Scholar]
- 35.Preston DL, Ron E, Tokuoka S, et al. Solid cancer incidence in atomic bomb survivors: 1958–1998. Radiation research. 2007;168:1–64. doi: 10.1667/RR0763.1. [DOI] [PubMed] [Google Scholar]
- 36.Rosenstein M, Beck T, et al. FDA. Handbook of selected tissue doses for projections common in diagnostic radiology. Food and Drug Administration; Rockville MD: 1979. [Google Scholar]
- 37.Mole RH. Childhood cancer after prenatal exposure to diagnostic X-ray examinations in Britain. British journal of cancer. 1990;62:152–168. doi: 10.1038/bjc.1990.249. [DOI] [PMC free article] [PubMed] [Google Scholar]
- 38.Bewley DK, Laws JW, Myddleton CJ. Maternal and foetal radiation dosage during obstetric radiographic examinations. The British journal of radiology. 1957;30:286–290. doi: 10.1259/0007-1285-30-354-286. [DOI] [PubMed] [Google Scholar]
- 39.Clayton CG, Farmer FT, Warrick CK. Radiation doses to the foetal and maternal gonads in obstetric radiography during late pregnancy. The British journal of radiology. 1957;30:291–294. doi: 10.1259/0007-1285-30-354-291. [DOI] [PubMed] [Google Scholar]
- 40.Matthews JC, Miller H. Radiation hazards from diagnostic radiology. A repeat survey over a small area. The British journal of radiology. 1969;42:814–817. doi: 10.1259/0007-1285-42-503-814. [DOI] [PubMed] [Google Scholar]
- 41.HMSO. Great Britain, Ministry of Health Committee on Radiological Hazards to Patients: Second report of the Committee; London, United Kingdom: HMSO; 1960. [Google Scholar]
- 42.Clark KC. Positioning in Radiography. 7. Heineman Medical; London: 1956. [Google Scholar]
- 43.HMSO. Great Britain, Ministry of Health Committee on Radiological Hazards to Patients: Final report of the Committee; London: HMSO; 1966. [Google Scholar]
- 44.Osei EK, Faulkner K. Fetal doses from radiological examinations. The British journal of radiology. 1999;72:773–780. doi: 10.1259/bjr.72.860.10624343. [DOI] [PubMed] [Google Scholar]
- 45.Hart D, Jones DG, et al. Normalised organ doses for medical x-ray examinations calculated using Monte Carlo techniques; Chilton, UK: National Radiological Protection Board; 1994. [Google Scholar]
- 46.Thomton FJ, Paulson EK, Yoshizumi TT, et al. Single versus multi-detector row CT: comparison of radiation doses and dose profiles. Academic radiology. 2003;10:379–385. doi: 10.1016/s1076-6332(03)80026-0. [DOI] [PubMed] [Google Scholar]
- 47.Hurwitz LM, Yoshizumi T, Reiman RE, et al. Radiation dose to the fetus from body MDCT during early gestation. Ajr. 2006;186:871–876. doi: 10.2214/AJR.04.1915. [DOI] [PubMed] [Google Scholar]
- 48.Loevinger R, Budinger TF, Watson EE. MIRD primer for absorbed dose calculations. Society of Nuclear Medicine; New York, NY: 1991. [Google Scholar]
- 49.Russell JR, Stabin MG, Sparks RB, et al. Radiation absorbed dose to the embryo/fetus from radiopharmaceuticals. Health physics. 1997;73:756–769. doi: 10.1097/00004032-199711000-00003. [DOI] [PubMed] [Google Scholar]
- 50.CRCPD. Nationwide evaluation of x-ray trends (NEXT): Tabulation and graphical summary of 2001 survey of adult chest radiography; Conference of Radiation Control Program Directors; Frankfort, KY. 2005. p. 77. [Google Scholar]
- 51.Chodick G, Ronckers C, Ron E, et al. The utilization of pediatric computed tomography in a large Israeli Health Maintenance Organization. Pediatric radiology. 2006;36:485–490. doi: 10.1007/s00247-005-0091-0. [DOI] [PubMed] [Google Scholar]
- 52.Ghotbi N, Ohtsuru A, Ogawa Y, et al. Pediatric CT scan usage in Japan: results of a hospital survey. Radiation medicine. 2006;24:560–567. doi: 10.1007/s11604-006-0072-8. [DOI] [PubMed] [Google Scholar]
- 53.Macgregor DM, McKie L. CT or not CT--that is the question. Whether ‘tis better to evaluate clinically and x ray than to undertake a CT head scan! Emerg Med J. 2005;22:541–543. doi: 10.1136/emj.2004.017160. [DOI] [PMC free article] [PubMed] [Google Scholar]
- 54.Broder J, Fordham LA, Warshauer DM. Increasing utilization of computed tomography in the pediatric emergency department, 2000–2006. Emergency radiology. 2007;14:227–232. doi: 10.1007/s10140-007-0618-9. [DOI] [PubMed] [Google Scholar]
- 55.CRCPD. Nationwide evaluation of x-ray trends (NEXT): Tabulation and graphical summary of 2000 survey of computed tomography; Conference of Radiation Control Program Directors; Frankfort, KY. 2007. p. 154. [Google Scholar]
- 56.Mettler FA, Jr, Wiest PW, Locken JA, et al. CT scanning: patterns of use and dose. J Radiol Prot. 2000;20:353–359. doi: 10.1088/0952-4746/20/4/301. [DOI] [PubMed] [Google Scholar]
- 57.Shrimpton PC, Hart D, et al. NRPB. Survey of CT practice in the UK. Part 1 -Aspects of examination frequency and quality assurance. National Radiological Protection Board; Chilton, UK: 1991. [Google Scholar]
- 58.NCI. Radiation risks and pediatric computed tomography (CT): A guide for health care providers. 2008 Available via: http://www.cancer.gov/cancertopics/causes/radiation-risks-pediatric-CT.
- 59.Linton OW, Mettler FA., Jr National conference on dose reduction in CT, with an emphasis on pediatric patients. Ajr. 2003;181:321–329. doi: 10.2214/ajr.181.2.1810321. [DOI] [PubMed] [Google Scholar]
- 60.Bithell JF, Stewart AM. Pre-natal irradiation and childhood malignancy: a review of British data from the Oxford Survey. British journal of cancer. 1975;31:271–287. doi: 10.1038/bjc.1975.62. [DOI] [PMC free article] [PubMed] [Google Scholar]
- 61.Macmahon B. Prenatal x-ray exposure and childhood cancer. Journal of the National Cancer Institute. 1962;28:1173–1191. [PubMed] [Google Scholar]
- 62.Monson RR, Macmahon B. Prenatal x-ray exposure and cancer in children. In: Boice JD Jr, Fraumeni JF Jr, editors. Radiation carcinogenesis: epidemiology and biological significance. Raven Press; New York, New York: 1984. pp. 97–105. [Google Scholar]
- 63.Stewart A, Kneale GW. Prenatal radiation exposure and childhood cancer. Lancet. 1971;1:42–43. doi: 10.1016/s0140-6736(71)80048-x. [DOI] [PubMed] [Google Scholar]
- 64.Graham S, Levin ML, Lilienfeld AM, et al. Preconception, intrauterine, and postnatal irradiation as related to leukemia. National Cancer Institute monograph. 1966;19:347–371. [PubMed] [Google Scholar]
- 65.Salonen T, Saxen L. Risk indicators in childhood malignancies. International journal of cancer. 1975;15:941–946. doi: 10.1002/ijc.2910150609. [DOI] [PubMed] [Google Scholar]
- 66.Kaplan HS. An evaluation of the somatic and genetic hazards of the medical uses of radiation. The American journal of roentgenology, radium therapy, and nuclear medicine. 1958;80:696–706. [PubMed] [Google Scholar]
- 67.Polhemus DW, Koch R. Leukemia and medical radiation. Pediatrics. 1959;23:453–461. [PubMed] [Google Scholar]
- 68.van Steensel-Moll HA, Valkenburg HA, Vandenbroucke JP, et al. Are maternal fertility problems related to childhood leukaemia? International journal of epidemiology. 1985;14:555–559. doi: 10.1093/ije/14.4.555. [DOI] [PubMed] [Google Scholar]
- 69.Shu XO, Gao YT, Brinton LA, et al. A population-based case-control study of childhood leukemia in Shanghai. Cancer. 1988;62:635–644. doi: 10.1002/1097-0142(19880801)62:3<635::aid-cncr2820620332>3.0.co;2-3. [DOI] [PubMed] [Google Scholar]
- 70.Magnani C, Pastore G, Luzzatto L, et al. Parental occupation and other environmental factors in the etiology of leukemias and non-Hodgkin’s lymphomas in childhood: a case-control study. Tumori. 1990;76:413–419. doi: 10.1177/030089169007600501. [DOI] [PubMed] [Google Scholar]
- 71.Naumburg E, Bellocco R, Cnattingius S, et al. Intrauterine exposure to diagnostic X rays and risk of childhood leukemia subtypes. Radiation research. 2001;156:718–723. doi: 10.1667/0033-7587(2001)156[0718:ietdxr]2.0.co;2. [DOI] [PubMed] [Google Scholar]
- 72.Shu XO, Jin F, Linet MS, et al. Diagnostic X-ray and ultrasound exposure and risk of childhood cancer. British journal of cancer. 1994;70:531–536. doi: 10.1038/bjc.1994.340. [DOI] [PMC free article] [PubMed] [Google Scholar]
- 73.Shu XO, Potter JD, Linet MS, et al. Diagnostic X-rays and ultrasound exposure and risk of childhood acute lymphoblastic leukemia by immunophenotype. Cancer Epidemiol Biomarkers Prev. 2002;11:177–185. [PubMed] [Google Scholar]
- 74.van Duijn CM, van Steensel-Moll HA, Coebergh JW, et al. Risk factors for childhood acute non-lymphocytic leukemia: an association with maternal alcohol consumption during pregnancy? Cancer Epidemiol Biomarkers Prev. 1994;3:457–460. [PubMed] [Google Scholar]
- 75.Bunin GR, Buckley JD, Boesel CP, et al. Risk factors for astrocytic glioma and primitive neuroectodermal tumor of the brain in young children: a report from the Children’s Cancer Group. Cancer Epidemiol Biomarkers Prev. 1994;3:197–204. [PubMed] [Google Scholar]
- 76.Preston-Martin S, Yu MC, Benton B, et al. N-Nitroso compounds and childhood brain tumors: a case-control study. Cancer research. 1982;42:5240–5245. [PubMed] [Google Scholar]
- 77.Schuz J, Kaletsch U, Kaatsch P, et al. Risk factors for pediatric tumors of the central nervous system: results from a German population-based case-control study. Med Pediatr Oncol. 2001;36:274–282. doi: 10.1002/1096-911X(20010201)36:2<274::AID-MPO1065>3.0.CO;2-D. [DOI] [PubMed] [Google Scholar]
- 78.Olshan AF, Breslow NE, Falletta JM, et al. Risk factors for Wilms tumor. Report from the National Wilms Tumor Study. Cancer. 1993;72:938–944. doi: 10.1002/1097-0142(19930801)72:3<938::aid-cncr2820720345>3.0.co;2-c. [DOI] [PubMed] [Google Scholar]
- 79.Winn DM, Li FP, Robison LL, et al. A case-control study of the etiology of Ewing’s sarcoma. Cancer Epidemiol Biomarkers Prev. 1992;1:525–532. [PubMed] [Google Scholar]
- 80.Gilman EA, Kneale GW, Knox EG, et al. Pregnancy x-rays and childhood cancers. J Radiol Prot. 1988;8:3–8. [Google Scholar]
- 81.UNSCEAR. A report of the United Nations Scientific Committee on the Effects of Atomic Radiation to the General Assembly, with annexes; United Nations Scientific Committee on the Effects of Atomic Radiation; New York. 1972. [Google Scholar]
- 82.Totter JR, MacPherson HG. Do childhood cancers result from prenatal x-rays? Health physics. 1981;40:511–524. doi: 10.1097/00004032-198104000-00008. [DOI] [PubMed] [Google Scholar]
- 83.Gilman EA, Stewart AM, Knox EG, et al. Trends in obstetric radiography. J Radiol Prot. 1989;9:93–102. [Google Scholar]
- 84.Harvey EB, Boice JD, Jr, Honeyman M, et al. Prenatal x-ray exposure and childhood cancer in twins. The New England journal of medicine. 1985;312:541–545. doi: 10.1056/NEJM198502283120903. [DOI] [PubMed] [Google Scholar]
- 85.Rodvall Y, Pershagen G, Hrubec Z, et al. Prenatal X-ray exposure and childhood cancer in Swedish twins. International journal of cancer. 1990;46:362–365. doi: 10.1002/ijc.2910460304. [DOI] [PubMed] [Google Scholar]
- 86.Carmichael JH, Berry RJ. Diagnostic x-rays in late pregnancy and in the neonate. Lancet. 1976;1:351–352. doi: 10.1016/s0140-6736(76)90101-x. [DOI] [PubMed] [Google Scholar]
- 87.Chamberlain J. Human benefits and costs of a national screening programme for neural-tube defects. Lancet. 1978;2:1293–1296. doi: 10.1016/s0140-6736(78)92053-6. [DOI] [PubMed] [Google Scholar]
- 88.Kendall BE, Darby SC, Harries SV, et al. National Radiological Protection Board Report. London: HSMO; 1980. A frequency survey of radiological examination carried out in national health service hospitals in Great Brittain in 1977 for diagnostic purposes. [Google Scholar]
- 89.Wall BF, Shrimpton PC. Bone marrow dose in chest radiography: the posteroanterior vs. anteroposterior projection. Radiology. 1980;137:258–259. doi: 10.1148/radiology.137.1.7422856. [DOI] [PubMed] [Google Scholar]
- 90.Kendall GM, Wall BF, Darby SC. X-ray exposures of the foetus. J Radiol Prot. 1989;9:285–293. [Google Scholar]
- 91.Levi S. The history of ultrasound in gynecology 1950–1980. Ultrasound in medicine & biology. 1997;23:481–552. doi: 10.1016/s0301-5629(96)00196-2. [DOI] [PubMed] [Google Scholar]
- 92.Cartwright RA, McKinney PA, Hopton PA, et al. Ultrasound examinations in pregnancy and childhood cancer. Lancet. 1984;2:999–1000. doi: 10.1016/s0140-6736(84)91105-x. [DOI] [PubMed] [Google Scholar]
- 93.Kinnier Wilson LM, Waterhouse JA. Obstetric ultrasound and childhood malignancies. Lancet. 1984;2:997–999. doi: 10.1016/s0140-6736(84)91104-8. [DOI] [PubMed] [Google Scholar]
- 94.Sorahan T, Lancashire R, Stewart A, et al. Pregnancy ultrasound and childhood cancer: a second report from the Oxford Survey of Childhood Cancers. British journal of obstetrics and gynaecology. 1995;102:831–832. doi: 10.1111/j.1471-0528.1995.tb10851.x. [DOI] [PubMed] [Google Scholar]
- 95.Fajardo-Gutierrez A, Garduno-Espinosa J, Yamamoto-Kimura L, et al. Risk factors associated with the development of leukemia in children. Boletin medico del Hospital Infantil de Mexico. 1993;50:248–257. [PubMed] [Google Scholar]
- 96.Hartley AL, Birch JM, McKinney PA, et al. The Inter-Regional Epidemiological Study of Childhood Cancer (IRESCC): past medical history in children with cancer. Journal of epidemiology and community health. 1988;42:235–242. doi: 10.1136/jech.42.3.235. [DOI] [PMC free article] [PubMed] [Google Scholar]
- 97.Infante-Rivard C, Deadman JE. Maternal occupational exposure to extremely low frequency magnetic fields during pregnancy and childhood leukemia. Epidemiology (Cambridge, Mass) 2003;14:437–441. doi: 10.1097/01.ede.0000078421.60231.bc. [DOI] [PubMed] [Google Scholar]
- 98.Infante-Rivard C, Mathonnet G, Sinnett D. Risk of childhood leukemia associated with diagnostic irradiation and polymorphisms in DNA repair genes. Environmental health perspectives. 2000;108:495–498. doi: 10.1289/ehp.00108495. [DOI] [PMC free article] [PubMed] [Google Scholar]
- 99.Ager EA, Schuman LM, Wallace HM, et al. An Epidemiological Study of Childhood Leukemia. Journal of chronic diseases. 1965;18:113–132. doi: 10.1016/0021-9681(65)90096-2. [DOI] [PubMed] [Google Scholar]
- 100.Howe GR, Burch JD, Chiarelli AM, et al. An exploratory case-control study of brain tumors in children. Cancer research. 1989;49:4349–4352. [PubMed] [Google Scholar]
- 101.Daigle AE. Epidemiologic study of etiologic factors in ewing’s sarcoma (abstract) Dissertation Abstracts International. 1987;47:2861-B. [Google Scholar]
- 102.Hoffman DA, Lonstein JE, Morin MM, et al. Breast cancer in women with scoliosis exposed to multiple diagnostic x rays. Journal of the National Cancer Institute. 1989;81:1307–1312. doi: 10.1093/jnci/81.17.1307. [DOI] [PubMed] [Google Scholar]
- 103.Ronckers CM, Doody MM, Lonstein JE, et al. Multiple diagnostic X-rays for spine deformities and risk of breast cancer. Cancer Epidemiol Biomarkers Prev. 2008;17:605–613. doi: 10.1158/1055-9965.EPI-07-2628. [DOI] [PubMed] [Google Scholar]
- 104.Preston-Martin S, Paganini-Hill A, Henderson BE, et al. Case-control study of intracranial meningiomas in women in Los Angeles County, California. Journal of the National Cancer Institute. 1980;65:67–73. [PubMed] [Google Scholar]
- 105.Preston DL, Cullings H, Suyama A, et al. Solid cancer incidence in atomic bomb survivors exposed in utero or as young children. Journal of the National Cancer Institute. 2008;100:428–436. doi: 10.1093/jnci/djn045. [DOI] [PubMed] [Google Scholar]
- 106.Kneale GW, Stewart AM. Pre-conception X-rays and childhood cancers. British journal of cancer. 1980;41:222–226. doi: 10.1038/bjc.1980.33. [DOI] [PMC free article] [PubMed] [Google Scholar]
- 107.Buckley JD, Robison LL, Swotinsky R, et al. Occupational exposures of parents of children with acute nonlymphocytic leukemia: a report from the Childrens Cancer Study Group. Cancer research. 1989;49:4030–4037. [PubMed] [Google Scholar]
- 108.Bunin GR, Kramer S, Marrero O, et al. Gestational risk factors for Wilms’ tumor: results of a case-control study. Cancer research. 1987;47:2972–2977. [PubMed] [Google Scholar]
- 109.Gold E, Gordis L, Tonascia J, et al. Risk factors for brain tumors in children. American journal of epidemiology. 1979;109:309–319. doi: 10.1093/oxfordjournals.aje.a112684. [DOI] [PubMed] [Google Scholar]
- 110.Kramer S, Ward E, Meadows AT, et al. Medical and drug risk factors associated with neuroblastoma: a case-control study. Journal of the National Cancer Institute. 1987;78:797–804. [PubMed] [Google Scholar]
- 111.Magnani C, Pastore G, Luzzatto L, et al. Risk factors for soft tissue sarcomas in childhood: a case-control study. Tumori. 1989;75:396–400. doi: 10.1177/030089168907500418. [DOI] [PubMed] [Google Scholar]
- 112.Roman E, Watson A, Beral V, et al. Case-control study of leukaemia and non-Hodgkin’s lymphoma among children aged 0–4 years living in west Berkshire and north Hampshire health districts. BMJ (Clinical research ed. 1993;306:615–621. doi: 10.1136/bmj.306.6878.615. [DOI] [PMC free article] [PubMed] [Google Scholar]
- 113.Shiono PH, Chung CS, Myrianthopoulos NC. Preconception radiation, intrauterine diagnostic radiation, and childhood neoplasia. Journal of the National Cancer Institute. 1980;65:681–686. doi: 10.1093/jnci/65.4.681. [DOI] [PubMed] [Google Scholar]
- 114.Heston JF, Kelly JB, Meigs JW, et al. Forty-five years of cancer incidence in Connecticut: 1935–79. NIH; Bethesda, Maryland: 1986. National Cancer Institute Monograph No. 70. [Google Scholar]
- 115.Hakulinen T, Andersen A, Malker B, et al. Trends in cancer incidence in the Nordic countries. A collaborative study of the five Nordic Cancer Registries. Acta pathologica, microbiologica, et immunologica Scandinavica. 1986;288:1–151. [PubMed] [Google Scholar]
- 116.Stiller CA, Draper GJ. Trends in childhood leukaemia in Britain 1968–1978. British journal of cancer. 1982;45:543–551. doi: 10.1038/bjc.1982.90. [DOI] [PMC free article] [PubMed] [Google Scholar]
- 117.Berrington de Gonzalez A, Ekbom A, Glass AG, et al. Comparison of documented and recalled histories of exposure to diagnostic x-rays in case-control studies of thyroid cancer. American journal of epidemiology. 2003;157:652–663. doi: 10.1093/aje/kwg026. [DOI] [PubMed] [Google Scholar]
- 118.Bhatia S, Robison LL, Oberlin O, et al. Breast cancer and other second neoplasms after childhood Hodgkin’s disease. The New England journal of medicine. 1996;334:745–751. doi: 10.1056/NEJM199603213341201. [DOI] [PubMed] [Google Scholar]
- 119.Neglia JP, Robison LL, Stovall M, et al. New primary neoplasms of the central nervous system in survivors of childhood cancer: a report from the Childhood Cancer Survivor Study. Journal of the National Cancer Institute. 2006;98:1528–1537. doi: 10.1093/jnci/djj411. [DOI] [PubMed] [Google Scholar]
- 120.Ron E, Modan B, Boice JD, Jr, et al. Tumors of the brain and nervous system after radiotherapy in childhood. The New England journal of medicine. 1988;319:1033–1039. doi: 10.1056/NEJM198810203191601. [DOI] [PubMed] [Google Scholar]
- 121.Shore RE, Hildreth N, Dvoretsky P, et al. Thyroid cancer among persons given X-ray treatment in infancy for an enlarged thymus gland. American journal of epidemiology. 1993;137:1068–1080. doi: 10.1093/oxfordjournals.aje.a116610. [DOI] [PubMed] [Google Scholar]
- 122.Sigurdson AJ, Ronckers CM, Mertens AC, et al. Primary thyroid cancer after a first tumour in childhood (the Childhood Cancer Survivor Study): a nested case-control study. Lancet. 2005;365:2014–2023. doi: 10.1016/S0140-6736(05)66695-0. [DOI] [PubMed] [Google Scholar]
- 123.Cardis E, Kesminiene A, Ivanov V, et al. Risk of thyroid cancer after exposure to 131I in childhood. Journal of the National Cancer Institute. 2005;97:724–732. doi: 10.1093/jnci/dji129. [DOI] [PubMed] [Google Scholar]
- 124.Tronko MD, Brenner AV, Olijnyk VA, et al. Autoimmune thyroiditis and exposure to iodine 131 in the Ukrainian cohort study of thyroid cancer and other thyroid diseases after the Chornobyl accident: results from the first screening cycle (1998–2000) The Journal of clinical endocrinology and metabolism. 2006;91:4344–4351. doi: 10.1210/jc.2006-0498. [DOI] [PubMed] [Google Scholar]
- 125.Shore RE. Gaps in the epidemiology of in utero radiation-exposure effects International Congress Series, 2002. 2002:13–18. [Google Scholar]
- 126.Spelic DC. Dose and Image Quality in Mammography: Trends during the First Decade of MQSA. U. S. Food and Drug Administration; 2006. [Google Scholar]