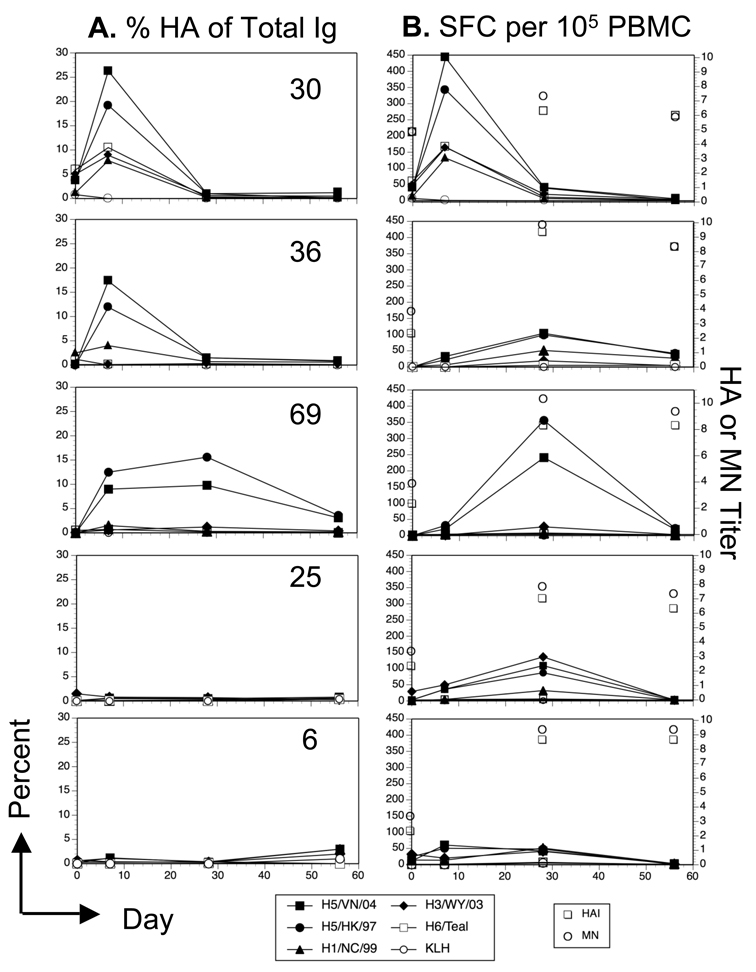
Figure 3. Kinetics of the HA-specific MBC response versus the HAI and MN titers in 5 subjects.
The percent HA specific of the total IgG secreting B cells (A) and the frequency of HA specific B cells per 105 PBMC (B) from 5 individual subjects are shown to illustrate the variability in the pattern of responses. HAI and MN geometric mean titers (Log2) from days 0, 28, and 56 are indicated by the open symbols not connected by lines.

