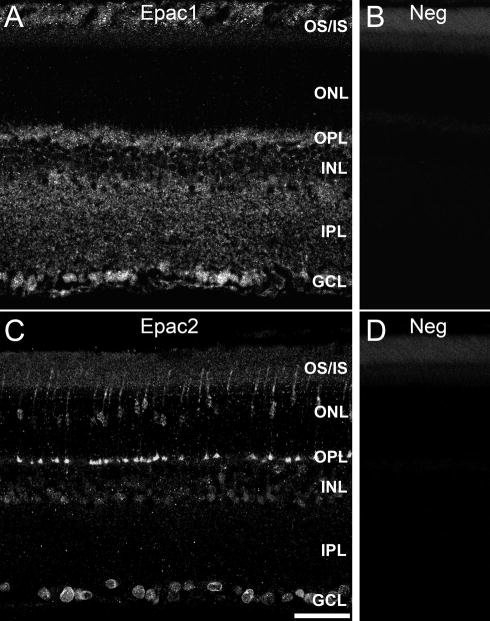
Figure 2.
Epac expression in the rodent retina. Immunofluorescent images of Epac1 (A), Epac2 (C), and negative controls (B, D) demonstrate their differential localizations. Epac1 was expressed primarily within the inner retina where it localized to cell bodies and synaptic regions. Epac2 however, was expressed primarily within cell bodies of all layers and also within distinctive structures of the OPL. Scale bar = 50μm.

