Abstract
Purpose
The application of Manganese-Enhanced MRI (MEMRI) to measure retinal function in humans is unclear. To begin to address this gap, we tested the hypothesis that an FDA-approved manganese-based MRI contrast agent, Teslascan, is useful for measuring functional intraretinal ionic regulation.
Methods
Anesthetized dark- or light-adapted male healthy Sprague Dawley rats were infused for 30 min with 10 μmol/kg of Teslascan (clinically relevant dose; n=5), 100 μmol/kg Teslascan (n=5), or saline (n=5). Four hours post administration, high resolution MEMRI data were collected. Intraretinal signal intensities and enhancements were measured. Modelling was performed to estimate apparent retinal transfer constant Ki and to determine optimal data acquisition parameters.
Results
In light-adapted rats, intraretinal enhancements responded in a dose-response manner. In addition, in the outer retina the effect of light-adaptation was to reduce significantly Mn2+ uptake and Ki compared to dark-adaptation. A non-significant change was also observed in the inner retina. Modelling shows Mn2+ plasma concentration reaching a plateau after about 2 hours. Apparent Ki values for the clinically-relevant dose are 3-6 10-3 min-1, decreasing to 0.5-0.6 10-3 min-1 at the higher dose. Intraretinal signal is almost linear with Ki. Optimal TR for a spin echo sequence is 0.4-1.4s.
Conclusion
First time evidence is presented that a clinically-relevant dose and route of Teslascan can be used to measure intraretinal function. The potential for future clinical application of MEMRI in a broad range of retinopathies is high.
1. Introduction
At present, there are no widely used, non-invasive surrogate markers that reliably and analytically measure focal retinal damage before it is clinically evident, predict disease progression, or therapeutic effectiveness in patients with, for example, diabetic retinopathy or visual cycle defects associated with age-related macular degeneration or retinitis pigmentosa. Clinical detection and staging of such conditions is based upon funduscopic evaluation together with fluorescein angiography and optical coherence tomography (OCT). However, these techniques only detect disease in its later stages, when irreversible structural damage has occurred, and the likelihood of permanent visual dysfunction is increased. Furthermore, they are not established for predicting therapeutic efficacy. Consequently, it is critical to develop biomarkers for retinal anomalies that occur in the earliest stages of the disease and that can address these substantial surveillance gaps. Clearly, the application of such techniques in phase II clinical trials, for example, would facilitate more rapid development of therapeutic approaches and more effective intervention.
Retinal processing of visual information depends critically on proper regulation of ions [1]. For example, photoreceptor cells function at particularly high metabolic rates in order to generate a depolarizing dark current (i.e., the constant influx of ions such as calcium in dark adapted photoreceptors with an associated efflux, and generation of guanosine triphosphate leading to cyclic guanosine monophosphate production). In light adaptation, the influx of calcium is attenuated relative to that in the dark due to the graded potential of these cells and closure of ion channels. In addition, ionic control is important in the cell cycle and in neuronal development, and ionic activity has been used as an index of viability in proliferating cells [2] [3] [4]. Notably, abnormal regulation of ions can produce, for example, retinal acidosis associated with retinal neovascularization or increased intracellular calcium levels as an apoptic trigger in neurodegenerative diseases. Thus, a metric of retinal ion regulation would be expected to be useful as a surrogate marker of intraretinal health.
Recently, in pre-clinical models, we developed and applied non-invasive high resolution manganese-enhanced magnetic resonance imaging (MEMRI) with systemically administered MnCl2 as a novel approach to measure the intraretinal regulation of ions such as calcium[5]. Manganese (Mn2+) is an ion analog of calcium, accumulates as a function of membrane integrity and activation in neurons and other cells, and is retained for long periods of time[5] [6] [7] [8] [9] [10]. In every model of retinopathy examined to-date we could evaluate drug treatment efficacy based on correction of abnormal MEMRI responses [5] [6] [8]. These results provide strong motivation for performing MEMRI clinically. Yet, MnCl2 is not approved for human application and so the clinical application of MEMRI remains unclear.
In this study, we begin to address this issue by evaluating the usefulness of a clinically-relevant manganese-based contrast agent, Teslascan (MnDPDP[11] [12]), in a simple animal model. In addition, we apply a powerful modelling approach that may help optimize data collection parameters in future human studies, as well as obtaining values of apparent Mn2+ transfer constant for the retina [13] [14] [15] [16] [17].
2. Materials and Methods
The animals were treated in accordance with the ‘Principles of laboratory animal care’ (NIH publication no. 85-23, revised 1985; http://grants1.nih.gov/grants/olaw/references/phspol.htm), as well as the Association for Research in Vision and Ophthalmology (ARVO) Statement on Animals in Vision research.
Groups
Different groups of male Sprague-Dawley rats (Hilltop Lab Animals, Inc., PA) were studied using a previously described light and dark adaptation procedure [5]. All rats were maintained in darkness for 16 - 20 hours prior to Teslascan injection. Procedures (e.g., weighing, infusion, anesthetic administration, and MRI exam) were done under dim red light or darkness. Each rat was infused IV for 30 min with a clinically-relevant dose of Teslascan (10 μmol/kg = 0.01 mmol/kg; n = 4 (continued dark adaptation), n = 5 (subsequent light adaptation) - see table 1 below), saline (volume equivalent sample; n = 5), or a high dose of Teslascan (100 μmol/kg; n = 5). The recommended clinical dose is 5-10 μmol/kg dose [11] [17].
Table 1.
| a) Clinically-relevant dose (10 μmol/kg) | |||||
|---|---|---|---|---|---|
| n | signal saline mean (sem) | signal Teslascan mean (sem) | enhancement (%) | apparent Ki 10-3 min-1 | |
| inner retina LA1 | 5 | 39.8 (0.97) | 52.7 (0.90) | 32.3 | 3.2 |
| inner retina DA2 | 4 | 56.4 (1.2) | 41.73 | 4.3 | |
| outer retina LA | 5 | 34.4 (0.84) | 45.4 (0.92) | 32.0 | 3.2 |
| outer retina DA | 4 | 53.6 (0.98)* | 55.83 | 5.7 | |
| b) High dose (100 μmol/kg) | |||||
|---|---|---|---|---|---|
| n | signal saline4 | signal Teslascan | enhancement (%) | apparent Ki 10-3 min-1 | |
| inner retina LA | 5 | 39.8 | 60.7 (1.01) | 52.5 | 0.53 |
| outer retina LA | 5 | 34.4 | 54.3 (0.92) | 57.8 | 0.59 |
light adapted
dark adapted
using LA signal saline values
same data as for clinically-relevant dose
significant increase in outer retina DA signal compared to LA signal (p<0.05)
High resolution MRI
Following the infusion, rats were maintained in either dark or room light conditions for another 3.5 - 4 hours. Immediately before the MRI experiment, rats were anesthetized using urethane (36% solution, i.p., 0.083 ml / 20 g animal weight, prepared fresh daily, Aldrich, Milwaukee, WI) and xylazine (1-8 mg/kg, IP). Core temperatures were maintained using a recirculating heated water blanket. MRI data were acquired on a 4.7 T Bruker Avance system using a two-turn transmit/receive surface coil (1.0 cm diameter) placed over the left eye. A single transverse slice through the center of the eye (based on sagittal localizer images collected using the same adiabatic pulse sequence as above) was obtained for each rat. Transverse images were then acquired using an adiabatic spin-echo imaging sequence (repetition time TR 350 s, echo time TE 16.7 ms, number of acquisitions NA 16, sweep width 61728 Hz, matrix size, 512 × 512, slice thickness 620 μm, pixel size 23.4 × 23.4 × 620 μm3, field of view 12 × 12 mm2) [18]. After the MEMRI exam, rats were humanely euthanized.
Data Analysis
Layer specific signal intensity
For quantitative analysis, signal intensities were first extracted from each rat image using the program NIH IMAGE and derived macros [19] and the results from that group compared with a generalized estimating equation approach (described below) [5]. Changes in receiver gain between animals were controlled for by setting the signal intensity of a fixed region of noise in each rat to a fixed value. Post-receptor (or inner retina IR) and receptor (or outer retina OR) signal intensity data (from distances ± 0.4 - 1 mm from the optic nerve) were extracted as follows. As we have previously discussed, the inner / outer retinal division is observable in light adapted retina (based on contrast generated by the differential amount of manganese taken up in inner and outer retina) but is not observable in dark adapted retinas [5]. Thus, we take advantage of the fact that the division between inner and outer retina and between retina and choroid occur as in normal retina (about 100 μm from the vitreal-retinal border (or about 4 pixels (23.4 × 4 = 96 μm) for inner retina, and then 3 pixels posterior to this region to sample the outer retina. To further ensure that we are measuring from inner and outer retina, the pixel values just anterior each of these divisions were designated as representative of inner or outer retinal values, respectively. Data were analyzed as previously described [5].
Statistical Analysis
Comparisons of MEMRI retinal signal intensities were performed using a generalized estimating equation (GEE) approach [5]. GEE performs a general linear regression analysis using all of the pixels in each subject and accounts for the with-in subject correlation between adjacent pixels. To the best of our knowledge an “ANOVA”-type GEE test is not available and instead exact P values from two-tailed comparisons are provided. When the P values are very low (e.g., P = 0.0001), the likelihood of false rejection of a true null in multiple comparisons is very small.
Mn2+ retention in retina
A separate study was carried out to test the modelling assumption (see below) that Mn2+ efflux from the retina can be ignored in the first few hours after injection. An intra peritoneal dose of 44 mg/kg of MnCl2 solution was given and retinal signal intensity measured at times from 4 hr to 7 days after injection. For each time-point, n = 3 or 4.
3. Modelling
Transfer constant Ki
Inflow of dissociated free Mn2+ tracer into the retina is characterised by an input transfer constant Ki (units: min-1):
| Eq 1 |
The inflow F (units: mmol ml-1 min-1) is proportional to the plasma concentration Cp(t) (units mmol ml-1 = mM), and independent of the concentration of tracer already in the retina (i.e. there is no backflow term[20]). Efflux (outflow) from the retina is ignored (this was shown to be realistic - see figure 6 below). Ct is the concentration in the retinal tissue. The contribution of IV tracer to Ct is ignored (see discussion). The quantity Ki inherently characterises a one-way flow into the retina It is very similar to the widely used Ktrans [21]; the only difference is that Ktrans usually characterises bidirectional diffusive flow across the capillary endothelium, in which tracer first leaks out of the blood plasma, then returns later on as the plasma concentration decreases.
Figure 6.
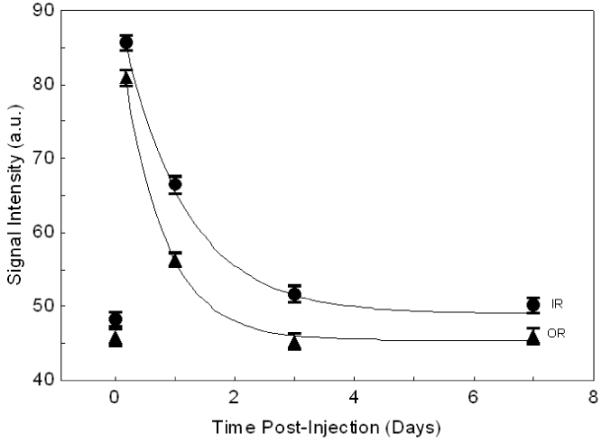
Mn2+ clearance from retina (IR=inner retina, OR=outer retina). Curves are fitted exponential decay; half-times are 19h (IR) and 11h (OR).
The plasma concentration in rats is well characterised by a single exponential decay [12]:
| Eq 2 |
D is the dose (mmole/kg), a is the initial plasma concentration for unit dose, and m is the decay rate (min-1). Using the data of Hustvedt et al [12], for D=7 μM/kg bolus injection of 54MnDPDP, Cp(0)= 0.185 mM, hence a=26.5 kg/l; also half life=24 min, hence m=0.0288 min-1 (corresponding to an exponential decay time (1/m) of 35 min). (Using the reported value[12] for Cp(0) of 10.2 μg /ml Mn, and Mn mass is 54 g/mole, gives 0.185 mmole/litre)
The retinal concentration at a time t after injection is then:
| Eq 3 |
and a long time after injection (t>5/m, i.e. after about 3 hrs), the tissue concentration reaches a plateau value that is proportional to Ki and D:
| Eq 4 |
The value of retinal T1 is reduced by the presence of Mn:
| Eq 5 |
T10 is the value of T1 before injection of Mn; a value of 1.6 s (measured in humans at 1.5T) was used[22]. r1 is the relaxivity; a value of 8 s-1 mM-1 was used (measured in vitro at 1.4T and 23 °C) [23] (and see reference[24] page 72).
The signal enhancement for a spin echo sequence is then given by:
| Eq 6 |
Sn is the normalised signal (i.e. Sn = 1 before injection of Mn). Thus for a given value of Ki, and knowing the dose D, the plasma constants a and m, T10, r1, TR and the time of imaging t, the retinal signal enhancement can be modelled, using eqs 3,5,6. Typical predicted enhancement curves are shown in figure 1. The plateau enhancement Sn(∞)(eqs 4-6) is highly linear with Ki (figure 2; for TR=350 ms).
Figure 1.
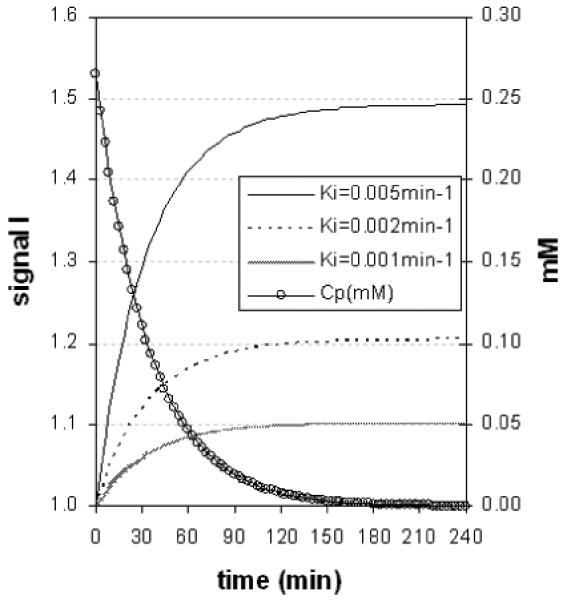
Modelled retinal enhancement curves (using eqs [2-4]). Parameter values: D=10 μmole/kg, T10=1.7s, r1=8 s-1 mM-1, TR=350 ms. After about 2 hours, plasma concentration (RH axis) has almost decayed to zero, and signal has almost reached a plateau.
figure 2.
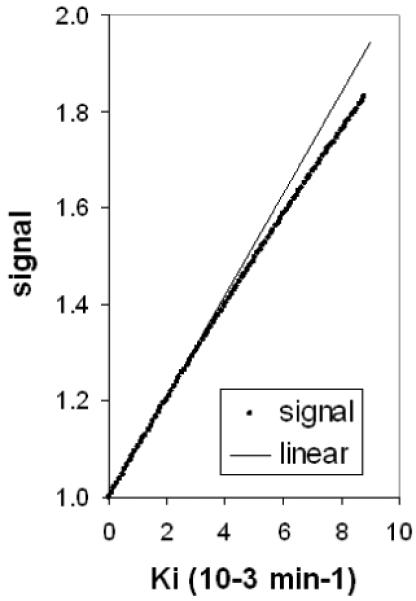
Almost linear dependence of plateau signal Sn (∞) on Ki. Parameter values: D=10 μmole/kg, T10=1.7s, r1=8 s-1 mM-, TR=350 ms.
Optimised acquisition - choosing TR
The spin echo acquisition can be optimised in terms of TR [25]. A long TR improves SNR by allowing more relaxation between 90° pulses, whilst a short TR improves SNR by giving more signal averaging. These two competing effects can be reconciled by choosing an optimum TR which maximised the SNR of the averaged image. Simple analysis of the equation for spin echo image intensity[25] shows that the minimum detectable Mn2+ concentration is:
| Eq 7 |
It is assumed that a signal change of 3 times the noise is needed to detect the effect of the added Mn. SNR0 is the SNR of the relaxed sequence (TR»T10, single average). Npe is the number of phase encodes. Tex is the total examination time (Tex = Nav Npe TR, where Nav is the number of averages). Cmin has a broad minimum with respect to TR at TR=T10/2 [25]; thus for T10=1.6 s this would be at 800 ms. A typical optimisation curve is shown in figure 3.
Figure 3.
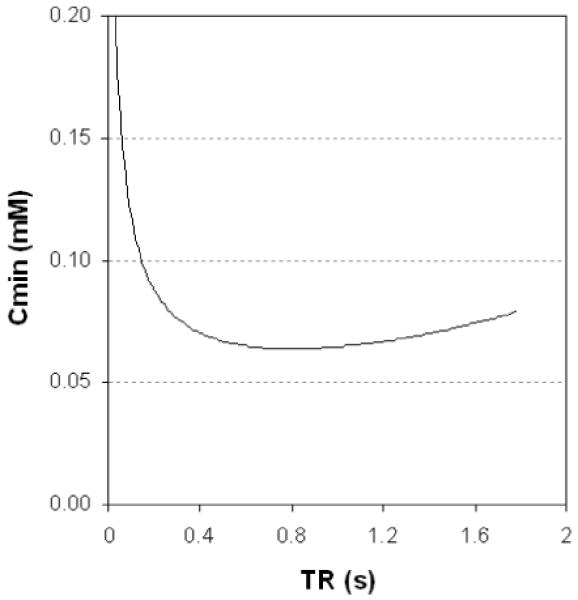
Minimum detectable Mn2+ concentration as a function of TR (from eq 7), for a spin echo sequence. T10=1.6s, SNR0=5, NPe=256, Tex=20 min, r1=8 s-1 mM-1. The optimum TR is 800 ms (i.e. 0.5 T10 as previously found[25]), and at this TR Nav≈5. The curve is quite broad; TR can be in the range 0.4-1.4s without Cmin rising more than 10% above its optimised value, and in the range 0.3-1.7s without rising 20% above its optimised value.
4. Results
Effect of dose
In light adapted rats, relative to baseline levels (i.e., animals not given Teslascan), the clinically-relevant dose (10 μmol/kg) of Teslascan increased IR and OR by 32% (P < 0.0001 in both cases), whilst the higher dose (100 μmol/kg) increased IR and OR by 52-58% (P < 0.0001 in both cases) (Figure 4).
Figure 4.
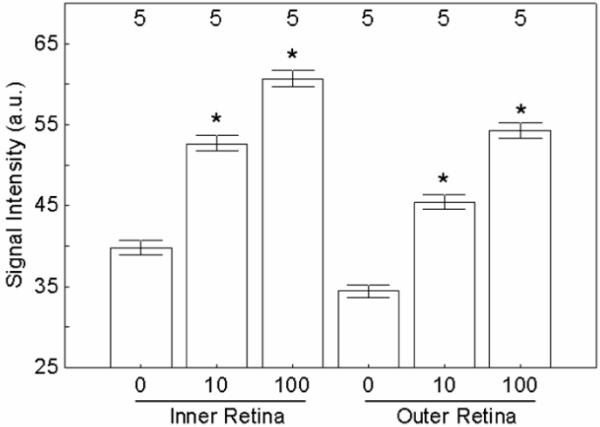
Summary of MEMRI changes in inner and outer retina of light-adapted rats following systemic Teslascan administration at different doses (0, 10 or 100 umol/kg). Significant comparisons to 0 dose are shown with a *. Error bars are SEM; numbers over bars are numbers of animals studied.
Light adaptation
With the clinically relevant dose, light and dark adapted retinas had similar (P = 0.13) inner retinal signal intensities, but different (P = 0.0018) outer retinal intensities (Figure 5). Thus the reduction in signal caused by light adaptation (compared to the value with dark-adaptation) was significant for the outer retina, but not quite significant for the inner retina.
Figure 5.
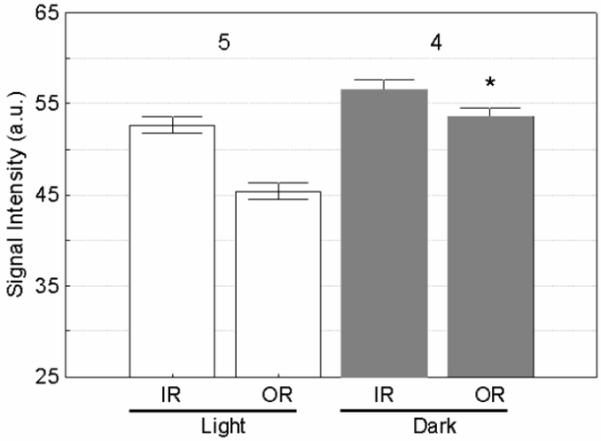
Summary of MEMRI changes in inner (IR) and outer retina (OR) as a function of light adaptation using Teslascan. Dark adapted OR signal is significantly raised compared to light adapted (shown with a *). Error bars are SEM; numbers over bars are numbers of animals studied.
Modelling
With the clinically relevant dose, values of Ki ranged from 3-6 10-3 min-1 (table 1). At the high dose, apparent Ki was reduced to 0.5-0.6 10-3 min-1.
Mn2+ efflux
Clearance of Mn2+ fitted a single exponential decay (figure 6), with half-times of 19h and 11h for inner and outer retina respectively.
5. Discussion
The results of this study show, for the first time, the feasibility of using systemically administered Teslascan to monitor intraretinal ion regulation changes associated with visual processing in vivo. Other laboratories have also found Teslascan useful for studying ion activity in the heart after a systemic injection and in optic nerve transport after an intravitreal injection [17] [26]. In this study, data were not collected optimally, per the model results, since our hardware setup maximized filling factor and thus signal-to-noise. This is not the situation in the clinic and more optimal acquisition parameters will be needed. Imaging 2-3 hours after injection seems to be optimal, in terms of allowing time for the retinal Mn2+ plateau to be reached (figure 1).
The proposed model is clearly a simplification of the actual Mn2+ transport process; however with only a single time point (which is a realistic assumption for potential clinical applications), more information cannot be extracted. A passive unsaturated transport mechanism has been assumed for retinal uptake (i.e. with uptake proportional to plasma concentration). In the well-understood case of passive transport of the imaging contrast agent Gd-DTPA through a defective blood-brain barrier[13] [21], transport can be bi-directional, and can be dominated by flow or permeability. However in this retinal model there is no backflow term and Mn2+ in the retina is effectively trapped for a long time (see eq 4 and figures 1 and 6). We have measured an apparent or effective transfer constant at a given dose and injection duration (analogous to the ‘apparent diffusion coefficient’). There is evidence of saturation of the transport mechanism at high dose (100 μmole/kg) - see table 1, giving a nonlinear response of Mn2+ retinal uptake to dose, and a reduction in apparent transfer constant. Even at the clinically-relevant dose (10 μmole/kg) there may be saturation, and a reduction in dose or plasma concentration may not degrade the contrast-to-noise ratio in the same proportion.
To build on these present initial findings, future studies could focus on the dependence of signal enhancement on time after injection and on size and duration of dose. Such data would allow the validity of the modelling to be evaluated, and better characterise the Mn2+ transport mechanism. Giving the Mn2+ dose over a long period of time (e.g. an infusion for 30 min, as in this study) may increase uptake compared with a bolus injection, since active transport mechanisms are less likely to saturate. Ignoring the contribution of intravenous Mn2+ to the tissue concentration (eq 1) is reasonable for several hours after injection, as retinal blood volume fraction is relatively small, and Cp is by then low (figure 1). A published human retinal T10 value at 1.5T was used [22] (since no value at 4.7T was available); the true 4.7T value will be somewhat higher. The T10 estimate is low by perhaps 30%; the model shows that increasing T10 by 30% reduces the Ki estimates by about the same factor. Similarly, the relaxivity value r1 is also an estimate and a true value at 4.7T and 37 °C would be valuable.
In this study the injection was given as a 30 min infusion, not a bolus. Given that the uptake is effectively complete after 3 hours (figure 1), then the bolus is a reasonable simplification. A more accurate modelling could replace the infusion with a bolus at a time half way through the infusion; alternatively the eq 8 could be modified to include a convolution to take account of the extended dose D.
Human studies will be constrained by a Mn2+ plasma concentration that is probably lower and shorter-lived than in rats[11]. The data of Toft et al (reference [11] figure 3c and d), for short injections of 5 and 10 μmol/kg, give initial plasma concentrations of 24 and 74 μM Mn2+, indicating a values (i.e. Cp(0)/D) of only 5-7 kg/l. Half lives are 18-20 min, indicating a faster m value of 0.035-0.038 min-1. Both these factors would reduce the plateau retinal concentration (eq 4), to about 14-23% of the value in rat (assuming the human Ki values are similar to those in rat). However signal-to-noise ratio may be larger in human subjects (more spins per voxel), enabling lower concentrations of Mn2+ to be seen. The spin echo optimisation study (figure 3) indicates that contrast-to-noise ratio (or equivalently, the acquisition time) could be improved in clinical studies by using a longer TR value. Other T1-weighted sequences (spoilt gradient echo and possibly MP-RAGE) would probably have advantages[25]. Active Mn2+ transport may still be effective at lower plasma concentrations (giving a higher effective Ki than we have reported). Probably as large a dose as possible should be given; with Gd-DTPA there is a precedent for giving more than the recommended clinical dose of 0.1 mmol/kg (up to three times this can be given when extra sensitivity is needed).
Humans dark adapt in about 30 min which is faster than that for the albino rats used in this study. One possible procedure for patient studies would be to compare manganese uptake in a dark adapted eye (patch light-tight for 30 min prior to Teslascan infusion) with that in the contra-unpatched eye (which would be light adapted). The time between the infusion and MRI examination would need to be optimized to minimize possible circulatory contamination and maximize retinal enhancement in patients. Images of patched and unpatched eyes could then be compared to assess retinal function. While a reasonable approach for optimization studies in controls and in some ocular diseases, this approach would not be applicable in diseases that occur asymmetrically.
The mechanism for production of free Mn2+ ions in plasma from Teslascan (Mn DPDP) is poorly understood, and the plasma concentration of free Mn is unknown. It is generally thought that Mn2+ is displaced from MnDPDP by Zn and Ca in plasma (transmetallation) [12] [27] [11], and subsequently bound to plasma proteins, principally albumin [27]. Although an ex vivo study failed to detect free Mn2+ ions [27], these must presumably be present for retinal uptake to be possible in our study. In our mathematical model we have assumed that all plasma Mn2+ is available for retinal uptake; the actual available concentration Cp(t) (eqn 2) could be lower depending on the equilibrium between free Mn2+and plasma-protein bound Mn2+; consequently our Ki values may be underestimates. Furthermore the uptake by the retina of Mn2+ ions is unlikely to be large enough to deplete the arterial plasma Mn2+ concentration (although there may be local depletion in capillaries if transport is flow limited[21]). The apparent dependence of Ki on dose (table 1) may in part be caused by a variable fraction of the plasma Mn being available for retinal uptake and more work is needed to understand the factors that regulate the above equilibrium. An explicit study of free Mn2+ concentration in plasma, including any dependence on disease, would be valuable, since accurate values of Cp(t) would then be available.
In conclusion, for the first time, the feasibility of using an FDA-approved manganese based contrast agent for functional retinal studies is demonstrated. The expected reduction in retinal activity with light adaptation has been measured. These data raise the possibility of performing experimental medicine studies with normal humans to validate the potential use of Teslascan as an image biomarker for ocular disease.
Acknowledgements
We gratefully acknowledge the following support: NIH EY018109 (BAB), the Juvenile Diabetes Research Foundation (BAB), and an unrestricted grant from Research to Prevent Blindness (BAB). We also thank Dr. Leopold Schmetterer for his invaluable help in overcoming an initial hurdle in these studies.
Footnotes
Publisher's Disclaimer: This is a PDF file of an unedited manuscript that has been accepted for publication. As a service to our customers we are providing this early version of the manuscript. The manuscript will undergo copyediting, typesetting, and review of the resulting proof before it is published in its final citable form. Please note that during the production process errors may be discovered which could affect the content, and all legal disclaimers that apply to the journal pertain.
Reference List
- [1].Winkler BS, Pourcho RG, Starnes C, Slocum J, Slocum N. Metabolic mapping in mammalian retina: a biochemical and 3H-2-deoxyglucose autoradiographic study. Exp. Eye Res. 2003;77:327–337. doi: 10.1016/s0014-4835(03)00147-7. [DOI] [PubMed] [Google Scholar]
- [2].Tamano H, Enomoto S, Oku N, Takeda A. Preferential uptake of zinc, manganese, and rubidium in rat brain tumor. Nucl. Med. Biol. 2002;29:505–508. doi: 10.1016/s0969-8051(02)00289-5. [DOI] [PubMed] [Google Scholar]
- [3].Young TL, Cepko CL. A role for ligand-gated ion channels in rod photoreceptor development. Neuron. 2004;41:867–879. doi: 10.1016/s0896-6273(04)00141-2. [DOI] [PubMed] [Google Scholar]
- [4].Santella L, Ercolano E, Nusco GA. The cell cycle: a new entry in the field of Ca2+ signaling. Cell Mol. Life Sci. 2005;62:2405–2413. doi: 10.1007/s00018-005-5083-6. [DOI] [PMC free article] [PubMed] [Google Scholar]
- [5].Berkowitz BA, Roberts R, Goebel DJ, Luan H. Noninvasive and Simultaneous Imaging of Layer-Specific Retinal Functional Adaptation by Manganese-Enhanced MRI. Investigative Ophthalmology Visual Science. 2006;47:2668–2674. doi: 10.1167/iovs.05-1588. [DOI] [PubMed] [Google Scholar]
- [6].Berkowitz BA, Roberts R, Luan H, Bissig D, Bui BV, Gradianu M, Calkins DJ, Vingrys AJ. Manganese-enhanced MRI studies of alterations of intraretinal ion demand in models of ocular injury. Invest Ophthalmol. Vis. Sci. 2007;48:3796–3804. doi: 10.1167/iovs.06-1278. [DOI] [PMC free article] [PubMed] [Google Scholar]
- [7].Berkowitz BA, Roberts R, Stemmler A, Luan H, Gradianu M. Impaired apparent ion demand in experimental diabetic retinopathy: correction by lipoic Acid. Invest Ophthalmol. Vis. Sci. 2007;48:4753–4758. doi: 10.1167/iovs.07-0433. [DOI] [PubMed] [Google Scholar]
- [8].Berkowitz BA, Roberts R, Penn JS, Gradianu M. High-resolution manganese-enhanced MRI of experimental retinopathy of prematurity. Invest Ophthalmol. Vis. Sci. 2007;48:4733–4740. doi: 10.1167/iovs.06-1516. [DOI] [PubMed] [Google Scholar]
- [9].Braun RD, Gradianu M, Vistisen KS, Roberts RL, Berkowitz BA. Manganese-enhanced MRI of human choroidal melanoma xenografts. Invest Ophthalmol. Vis. Sci. 2007;48:963–967. doi: 10.1167/iovs.06-1156. [DOI] [PMC free article] [PubMed] [Google Scholar]
- [10].Lin YJ, Koretsky AP. Manganese ion enhances T1-weighted MRI during brain activation: an approach to direct imaging of brain function. Magn Reson. Med. 1997;38:378–388. doi: 10.1002/mrm.1910380305. [DOI] [PubMed] [Google Scholar]
- [11].Toft KG, Hustvedt SO, Grant D, Martinsen I, Gordon PB, Friisk GA, Korsmo AJ, Skotland T. Metabolism and pharmacokinetics of MnDPDP in man. Acta Radiol. 1997;38:677–689. doi: 10.1080/02841859709172400. [DOI] [PubMed] [Google Scholar]
- [12].Hustvedt SO, Grant D, Southon TE, Zech K. Plasma pharmacokinetics, tissue distribution and excretion of MnDPDP in the rat and dog after intravenous administration. Acta Radiol. 1997;38:690–699. doi: 10.1080/02841859709172401. [DOI] [PubMed] [Google Scholar]
- [13].Tofts PS, Kermode AG. Measurement of the blood-brain barrier permeability and leakage space using dynamic MR imaging. 1. Fundamental concepts. Magn Reson. Med. 1991;17:357–367. doi: 10.1002/mrm.1910170208. [DOI] [PubMed] [Google Scholar]
- [14].Trick GL, Liggett J, Levy J, Adamsons I, Edwards P, Desai U, Tofts PS, Berkowitz BA. Dynamic contrast enhanced MRI in patients with diabetic macular edema: initial results. Exp. Eye Res. 2005;81:97–102. doi: 10.1016/j.exer.2005.01.015. [DOI] [PubMed] [Google Scholar]
- [15].Berkowitz BA, McDonald C, Ito Y, Tofts PS, Latif Z, Gross J. Measuring the human retinal oxygenation response to a hyperoxic challenge using MRI: eliminating blinking artifacts and demonstrating proof of concept. Magn Reson. Med. 2001;46:412–416. doi: 10.1002/mrm.1206. [DOI] [PubMed] [Google Scholar]
- [16].Berkowitz BA, Tofts PS, Sen HA, Ando N, de Juan E., Jr Accurate and precise measurement of blood-retinal barrier breakdown using dynamic Gd-DTPA MRI. Invest Ophthalmol. Vis. Sci. 1992;33:3500–3506. [PubMed] [Google Scholar]
- [17].Skjold A, Amundsen BH, Wiseth R, Stoylen A, Haraldseth O, Larsson HB, Jynge P. Manganese dipyridoxyl-diphosphate (MnDPDP) as a viability marker in patients with myocardial infarction. J Magn Reson. Imaging. 2007;26:720–727. doi: 10.1002/jmri.21065. [DOI] [PubMed] [Google Scholar]
- [18].Schupp DG, Merkle H, Ellermann JM, Ke Y, Garwood M. Localized detection of glioma glycolysis using edited 1H MRS. Magn Reson. Med. 1993;30:18–27. doi: 10.1002/mrm.1910300105. [DOI] [PubMed] [Google Scholar]
- [19].Berkowitz BA. Adult and newborn rat inner retinal oxygenation during carbogen and 100% oxygen breathing. Comparison using magnetic resonance imaging delta Po2 mapping. Invest Ophthalmol Vis Sci. 1996;37:2089–2098. [PubMed] [Google Scholar]
- [20].Tofts PS. Modeling tracer kinetics in dynamic Gd-DTPA MR imaging. J. Magn Reson. Imaging. 1997;7:91–101. doi: 10.1002/jmri.1880070113. [DOI] [PubMed] [Google Scholar]
- [21].Tofts PS, Brix G, Buckley DL, Evelhoch JL, Henderson E, Knopp MV, Larsson HB, Lee TY, Mayr NA, Parker GJ, Port RE, Taylor J, Weisskoff RM. Estimating kinetic parameters from dynamic contrast-enhanced T(1)-weighted MRI of a diffusable tracer: standardized quantities and symbols. J. Magn Reson. Imaging. 1999;10:223–232. doi: 10.1002/(sici)1522-2586(199909)10:3<223::aid-jmri2>3.0.co;2-s. [DOI] [PubMed] [Google Scholar]
- [22].Patz S, Bert RJ, Frederick E, Freddo TF. T(1) and T(2) measurements of the fine structures of the in vivo and enucleated human eye. J Magn Reson. Imaging. 2007;26:510–518. doi: 10.1002/jmri.21017. [DOI] [PubMed] [Google Scholar]
- [23].Bloembergen N, Morgan LO. Proton relaxation times in pramagnetic solutions. Effects of electron spin relaxation. J. Chem. Phys. 1961;34:842–850. [Google Scholar]
- [24].Tofts PS. QA: Quality assurance, accuracy, precision and phantoms (chapter 3) In: Tofts Paul., editor. Quantitative MRI of the brain: measuring changes caused by disease. John Wiley; Chichester: 2003. pp. 55–81. [Google Scholar]
- [25].Tofts PS. Optimal detection of blood-brain barrier defects with Gd-DTPA MRI-the influences of delayed imaging and optimised repetition time. Magn Reson. Imaging. 1996;14:373–380. doi: 10.1016/0730-725x(96)00023-9. [DOI] [PubMed] [Google Scholar]
- [26].Olsen O, Thuen M, Berry M, Kovalev V, Petrou M, Goa PE, Sandvig A, Haraldseth O, Brekken C. Axon tracing in the adult rat optic nerve and tract after intravitreal injection of MnDPDP using a semiautomatic segmentation technique. J Magn Reson Imaging. 2008;27:34–42. doi: 10.1002/jmri.21234. [DOI] [PubMed] [Google Scholar]
- [27].Schmidt PP, Toft KG, Skotland T, Andersson K. Stability and transmetallation of the magnetic resonance contrast agent MnDPDP measured by EPR. J Biol. Inorg. Chem. 2002;7:241–248. doi: 10.1007/s007750100290. [DOI] [PubMed] [Google Scholar]


