

Abstract
The main object of this study is to evaluate the role of intracellular free calcium ion [Ca2+]in in monocarboxylate transporter (MCT) mediated drug uptake by HeLa cells. It was hypothesized that alterations in the [Ca2+]in levels affect Na+-H+ exchanger (NHE) regulated pHin and thereby produce the proton-motivated driving force for monocarboxylate-mediated substrate transport.
The changes in intracellular pH (pHin) and MCT-mediated uptake rates of L-lactic acid by HeLa cells, a human cervical adenocarcinoma cell line, were evaluated under the conditions, whose [Ca2+]in concentrations were altered by various calcium modulators, such as EGTA-AM (a chelator), nifedipine (a Ca++ channel antagonist) and A23187 (an ionophore). For comparison purpose, the L-lactic acid uptake by HeLa cells was also evaluated under various pHin conditions induced by dexamethasone. The effects of the extracellular sodium concentration on the L-lactic acid uptake by HeLa cells were evaluated to determine the involvement of NHE-regulated pH changes in the MCT mediated drug uptake process. The [Ca2+]in concentrations and pHin in HeLa were assessed using fluorescent probes fura-2 and 2′,7′-bis[2-carboxyethyl-5-carboxyfluorescein] (BCECF), respectively.
The treatment of HeLa cells with A23187 at concentrations of 50 and 100 μM enhanced [Ca2+]in by 100% and 200% of the control, respectively. EGTA/AM (50 μM) or nifedipine (100 μM) did not cause any significant changes in the [Ca2+]in levels, whereas EGTA/AM (100 μM) and nifedipine (200 μM) reduced the [Ca2+]in levels by 30% and 25%, respectively, as compared with the control. A23187 at a concentration of 100 μM in the incubation medium lowered pHin (pH 5) and subsequently the uptake rate of lactic acid by 50% (0.47 ± 0.03 μmol/mg protein/min) of the control. In contrast, nifedipine (200 μM) and EGTA-AM (100 μM), the calcium modulators that lowered the [Ca2+]in levels and maintained the higher pHin (pH>6) of HeLa cells, enhanced the uptake rate of lactic acid by 60% and 130% of the control, respectively.
The results of this study demonstrated that there was a close correlation between the [Ca2+]in level and pHin and that NHEs were involved with the MCT mediated uptake process in HeLa cells. An understanding of the role of [Ca2+]in in the MCT mediated transport process could provide an efficient strategy to improve the systemic delivery of monocarboxylate substrates through the cervical mucosa.
Keywords: Calcium Modulators, Lactic Acid, Intracellular pH (pHin), Monocarboxylate Transporters (MCTs), Na+-H+ Exchangers (NHEs)
1. Introduction
The monocarboxylate transporters (MCTs) in the normal cells play an integral role in regulating the influx and efflux of numerous substrates containing a carboxyl group, such as L-lactic acid, acetic acid and pyruvic acid.1-4 The uptake process of the monocarboxylate substrates was dependent on intracellular pH (pHin) and the optimal pH for the lactic acid uptake was found to be 4.5. 5 It was also previously reported that the activities of various epithelial transporters including peptide transporters 6-7 and Na+-H+ exchangers (NHE) 8-9 were regulated by intracellular calcium in a concentration-dependent manner. Therefore, it was hypothesized that alterations in the [Ca2+]in levels in HeLa cells affect MCT mediated L-lactic acid uptake through Na+-H+ exchanger (NHE) regulated proton-motivated driving force (i.e., pHin changes).
A human cervical adenocarcinoma cell line, HeLa cell, was used to evaluate the effects of the alterations of the [Ca2+]in on the apical influx of L-lactic acid. MCT and NHE expressions in HeLa cells were identified by RT-PCR. The alterations of [Ca2+]in in HeLa cells were induced by either a permeable Ca2+ chelators (i.e., the acetoxy methyl ester of EGTA [EGTA/AM]) which trapped the intracellular Ca2+ ions, 10 a calcium channel blocker (i.e., nifedipine) which increased the supply of blood and oxygen to the heart by blocking the entry of calcium,11 or a Ca2+ ionophore (i.e., A23187) which increased the [Ca2+]in levels by releasing Ca2+ from intracellular calcium vesicles. 12
The question of whether alterations in the [Ca2+]in levels affect NHE regulated pHin and thereby subsequently produce the proton-motivated driving force for monocarboxylate-mediated substrate transport were addressed through the measurement of pHin and the L-lactic acid uptake rate by HeLa cells. For comparison purpose, the changes in the L-lactic acid uptake rate by HeLa cells whose pHin were induced by dexamethasone were also evaluated. The [Ca2+]in concentrations and pHin were assessed using fluorescent probes fura-2 and 2′,7′-bis[2-carboxyethyl-5-carboxyfluorescein] (BCECF), respectively. The effects of the extracellular sodium concentration on L-lactic acid uptake by HeLa cells were also evaluated to determine the involvement of NHE-regulated pH changes in the MCT mediated substrate uptake process.
2. Materials and Methods
2.1 Materials
HeLa cell lines and the growth medium were purchased from American Type culture collection (ATCC, Manassas, VA). Radio labeled 14C L-lactic acid (131 mCi/mmol) was purchased from American radio labeled chemicals (St. Louis, MO). Dexamethasone was purchased from Sigma (St. Louis, MO). Trizol reagent and specific primers for NHE were purchased from invitrogen (Carlsbad, CA). Reverse transcription kit and PCR II core system were purchased from Promega (Madison, WI). All other buffers were of a reagent grade and purchased from Sigma-Aldrich (St. Louis, MO).
2.2 Cell Culture
HeLa cells were cultured in the Eagles modified minimum essential medium (MEM) with 2 mM L-glutamine, 1.5 g/L sodium bicarbonate, 0.1 mM non-essential amino acids, 1.0 mM sodium pyruvate, 90% fetal bovine serum and 10% Penicillin/Streptomycin solution. The cell lines were grown in 75 cm2 tissue culture flasks at 37°C in a 5% CO2 incubator.
After cells reached confluence, the culture medium was removed and the cells in suspension were rinsed with 0.25% (w/v) Trypsin-EDTA (0.53 mM) solution to get rid of all traces of serum components including trypsin inhibitors. The trypsin-EDTA solution (1.0 ml) was added to the flask, which was incubated at 37°C until cells were fully detached. The growth medium (9.0 ml) was added to cells which were subsequently aspirated by gentle pipetting. Appropriate aliquots of cell suspension were added to new culture vessels, which were subsequently incubated at 37°C in a 5% CO2 incubator. For the uptake studies, approximately 3 million cells were seeded in 12-well plates. The medium was replaced with new medium every two days.
2.3 Measurement of the Intracellular Free Calcium [Ca2+]in
To elucidate the effects of the calcium modulators on the intracellular calcium levels, the changes in the [Ca2+]in level in HeLa cells were examined using acetoxymethyl (AM) ester of a Ca2+-sensitive fluorescent dye, Fura-2. HeLa cells (approximately 3.0 million) were grown in 96-well plates for two days. After cell monolayer was washed with the buffer solution (pH 7.4) and its pH was adjusted to pH 4.5 with acidic buffers, cells were pretreated with varying concentrations of A23187 (50 μM, 100 μM), EGTA/AM (50 μM, 100 μM) or nifedipine (100 μM, 200 μM) for 15 min. Cell populations were loaded in 96-well plates with 2 μM Fura-2/AM at 37°C for 75 min. The fluorescence of intracellular Fura-2 formed within the cells through the hydrolysis process of Fura-2/AM was measured using a SpectraFluor Plus fluorescent plate reader (Tecan, Research Triangle Park, NC, USA). Fura-2/AM is a dual wavelength fluorescent dye whose excitation maximum is found at 380 nm in the absence of calcium and shifts to 340 nm upon binding calcium. In both cases, the fluorescence emission intensities were measured at 510 nm. The intracellular calcium concentration is considered to be proportional to the ratio of fluorescence intensity of the calcium-bound dye over that of the calcium-free dye (340/380). 13-14
2.4 Measurement of the Intracellular pH (pHin)
Since the Na+-H+ exchanger, an integral regulator of cytoplasmic pH, is expressed in various mammalian cells, the effects of the calcium modulators on intracellular pH (pHin) mediated by NHEs were evaluated using a pH-sensitive fluorescent dye, 2′,7′-bis[2-carboxyethyl-5-carboxyfluorescein] (BCECF). For pHin measurement, HeLa cells grown in 96-well plates were preincubated with lipophilic acetoxymethyl ester of BCECF (BCECF-AM) (5 μM) at 37°C for 30 min. The cell monolayers were washed with pH 7.4 buffer for 5 min, and then subsequently replaced with the buffers (pH 4.5) containing A23187 (50 μM, 100 μM), EGTA/AM (100 μM) or nifedipine (200 μM).
The value of pHin is calculated based on the intensity of emission measured at 538 nm by a fluorescent plate reader at predetermined time points. A calibration curve was prepared from the fluorescence ratio of the buffers with known pHs after excitation of the fluorophore at 444 nm (isosbestic point) over that at 490 nm (pH-sensitive wavelength). 7
2.5 Effects of the Calcium Modulators on the Uptake Rate of Lactic Acid in HeLa Cells
To determine whether or not the uptake rate of the monocarboxylate substrates is closely correlated with the [Ca2+]in levels, the changes in the uptake rate of lactic acid by HeLa cells were evaluated in the presence of various calcium modulators. HeLa cells grown in 12-well plates were washed with the buffer solution at pH 7.4 for 5 min and preincubated with those containing 100 μM EGTA-AM, 100 μM A23187 or 200 μM nifedipine for 20 min. Cells were then treated with 0.5 μCi/ml radio labeled L-lactic acid along with 1mM cold L-lactic acid for 1 min at 37 °C. The amounts of L-lactic acid uptake and accumulative protein in each well were determined using a scintillation counter (Beckman Coulter, Fullerton, CA) and Coomassie Blue and BioRad assay techniques, respectively. Bovine gamma globulin was used as a standard to quantify the amount of lactic acid uptake by each well.
2.6 Effects of the Intracellular pH (pHin) on the Uptake Rate of Lactic Acid by HeLa Cells
To verify that pHin change-induced proton gradient is the major driving force of the lactic acid uptake by HeLa cells, the uptake rate of L-lactic acid by HeLa cells was evaluated under various pHin conditions induced by other mechanisms than the calcium modulators. HeLa cells were prepared as previously described and exposed to 2.0 or 2.5 μmol/L dexamethasone. After HeLa cells were treated with dexamethasone for 8 hr, cells were harvested and washed with Hepes-Buffered Hank's Balanced Salt Solution (HHBSS, pH 7.4) to remove excess amount of dexamethasone. pHin was measured using a pH-sensitive fluorescent dye, 2′,7′-bis[2-carboxyethyl-5-carboxyfluorescein] (BCECF). In similar studies, zinc acetate dehydrate (1 mM) was also included to check whether or not zinc ions inhibit dexamethasone-induced acidification. The uptake rates of L-lactic acid by HeLa cells were evaluated under the 3 pHin conditions (pH 7.4, 6.4, 5.8) as previously described and the results were compared with those induced by calcium modulators.
2.7 Effects of the Extracellular Sodium on the Uptake Rate of Lactic acid by HeLa Cells
To determine the involvement of NHE-regulated pH changes in the MCT mediated lactic acid uptake process, the uptake rate of L-lactic acid by HeLa cells was measured in the presence of varying concentrations of sodium (∼ 50 mM), which is known to be an integral component in the regulation process of NHE activities. The confluent HeLa cells were rinsed with Hepes-Buffered Hank's Balanced Salt Solution (HHBSS, pH 7.4) in the presence or absence of sodium chloride for 30 min. A mixture of 0.5 μCi/ml of the radio labeled L-lactic acid and 1 mM cold L-lactic acid was prepared in MES-HBSS (at pH 4.5). The same mixture prepared in MES-HBSS in which NaCl was replaced with choline chloride was used as a control. Cells were incubated with test samples at room temperature for 1 min and the uptake process was terminated by rinsing cell monolayer with the ice-cold buffer. Cells were lysed in the triton X cell lysis solution and the amount of L-lactic acid in cells was quantified by analyzing the radio-labeled L-lactic acid using a scintillation counter.
2.8 RNA Extraction and RT-PCR Analysis
To validate the usage of HeLa cells in the MCT mediated regulation studies, MCT and NHE isoforms in RNA extracted from HeLa cells were identified using Reverse transcription-polymerase chain reaction (RT-PCR). About 3 million HeLa cells were seeded on a Petri dish and the growth medium was changed every two days. Once the cells were confluent, RNA was extracted according to the procedure previously reported. 15 Briefly, the growth medium was replaced with 800 μl of Trizol Cell lysis reagent (Invitrogen, Carlsbad, CA) and RNA was extracted by sequential addition of Phenol, CHCl3 and Isopropanol. The samples were centrifuged at 12,500 rpm.
Reverse Transcription Kit, Polymerase Chain Reaction Kit (Promega Inc, Madison, WI) and synthetic oligonucleotides for MCT isoforms 1 to 6 as well as NHE clones 1 to 3 (Table I) were tested according to the manufacturer's instructions. Polymerase chain reaction was run for 35 cycles with denaturation for 1 cycle at 95° C for 2 min, annealing at 55° C for 1 min, extension at 72° C for 2 min and final extension 1 cycle at 72° C for 5min in a DNA Thermal Cycler (Midwest Scientific, St. Louis, MO). A sample (20 μl) of the polymerase chain reaction product along with loading dye was analyzed by electrophoresis performed on a prestained 3% agarose gel. The gel was photographed under ultraviolet illumination. The results of the RT-PCR reactions in the absence of RNA were used as a negative control, whereas those in the presence of RNA obtained from Caco-2 human intestinal cell line were used as a positive control.
Table I.
Forward and Reverse Oligonucleotide Primer Sequences used for RT-PCR Screening of Monocarboxylate (MCT) Isoforms as well as Na+-H+- Exchanger (NHE) isoforms, NHE1 and NHE3 in Human Cervical Adenocarcinoma Cells.
| MCT Isoforms | Oligonucleotide Sequence Forward | Oligonucleotide Sequence Reverse |
|---|---|---|
| MCT-1 | TCTACACTTAAAATGCCA CCAGCAGTTGGAGGTCC | AAAAACACCAAACACACA CATATCTCACACATAGCAC |
| MCT-5 | ATCTCAGCTGCCCTCTTCAT GGGTGGCAGCTT | TCAAGGCTCAGAGGTGGTCA ACAATTTGGCC |
| MCT-6 | GTTCACGTGCAAATGGAGC CGGTATGA | AACCACTTTGCCAGTTCATG TCACT |
| Transporter | Sense 5′-3′ | Antisense 5′-3′ |
| NHE1 base pairs (326) | GTGGTGGTTGCTTTGGTG | ACGATGCTTGAGATAGTGGG |
| NHE3 base pairs (298) | CACCAAGCATGTGCGTATCAT | GAAGACCAGCGTCAGGAGC |
2.9 Statistical Analyses
The differences in the [Ca2+]in levels and changes in pHin under various experimental conditions were statistically analyzed by a one-way analysis of variance (ANOVA) with pairwise multiple comparisons using the Student-Newman-Keuls method. P vales ≤0.05 were considered to be statistically significant.
3. Results
3.1 Effects of the Calcium Modulators on the Intracellular Calcium Profiles
The [Ca2+]in levels in HeLa cells upon treatment with varying concentrations of A23187, EGTA/AM or nifedipine were measured using a SpectraFluor Plus fluorescent plate reader. The concentrations (Table II) used for this study were selected based on previous reports. 5 [Ca2+]in was obtained based on the ratio of fluorescence at 340 nm over that at 380 nm. The treatment of the cells with A23187 enhanced [Ca2+]in by 100% and 200% of the control at A23187 concentrations of 50 and 100 μM, respectively. EGTA/AM at a concentration of 50 μM or nifedipine at a concentration of 100 μM did not cause any significant changes in the [Ca2+]in levels, whereas EGTA/AM at a concentration of 100 μM and nifedipine at a concentration of 200 μM reduced the [Ca2+]in levels by 30% and 25%, respectively, as compared with the control (Figure 1). The results of this study demonstrated that [Ca2+]in in HeLa cells can be altered by externally added calcium modulators. The concentrations of 50 and 100 μM for A23187, 100 μM for EGTA/AM and 200 μM for nifedipine were selected for further studies, as these concentrations had significant effects on the [Ca2+]in levels in HeLa cells.
Table II.
Calcium modulators and concentrations used to regulate intracellular calcium levels. The mechanisms by which A23187, EGTA/AM and Nifedipine modulate intracellular calcium levels were included.
| Calcium Modulators | Mechanism | Concentration Studied | Concentration Selected |
|---|---|---|---|
| A23187 | Ca2+ release from intracellular calcium stores- elevation of [Ca2+]in concentration | 50, 100 uM (22) | 50, 100 uM |
| EGTA/AM | Intracellular calcium chelation- reduction of [Ca2+]in concentration | 10, 30, 100 uM (23; 24) | 50, 100 uM |
| Nifedipine | L-type calcium channel blockade- reduction of [Ca2+]in concentration | 100 uM (10) | 100, 200 uM |
Figure 1.

Figure 1a. Intracellular calcium concentrations of HeLa cells in the absence (buffer alone) or presence of the calcium ionophore A23187 (50 μM, 100 μM), the intracellular calcium chelator EGTA-AM (50 μM, 100 μM) or the calcium channel blocker nifedipine (100 μM, 200 μM). Figure 1b. Intracellular pH measurements in HeLa cells treated with pH 4.5 buffer (indicated by the arrow) with or without 50 μM or 100 μM A23187 (a calcium ionophore) for 30 min. Each point represents the mean ± standard error of the mean (n = 3). *P < 0.05, **P < 0.01, ***P < 0.01 significantly different from control.
3.2 Effects of the Calcium Modulators on the Intracellular pH (pHin)
pHin of HeLa cells upon treatment with varying concentrations of nifedipine, EGTA/AM or A23187 were evaluated using a pH-sensitive fluorescent dye, BCECF. The treatment of the HeLa cells with the buffer solution (pH 4.5) alone produced intracellular acidification that reached its equilibrium (pHin of 6) in about 80 min as shown in Figures 2a and 2b. A23187 at concentrations of 50 μM and 100 μM lowered pHin from 7.4 to 5.4 and 5.0, respectively. In contrast, EGTA/AM (100 μM) and nifedipine (200 μM) did not cause any significant changes in pHin of HeLa cells, maintaining the pHin above 6.0, which was similar to the results obtained from the acidic buffer solution (pH 4.5) (Figure 2b).
Figure 2.

pHin of HeLa cells in the presence of an intracellular calcium chelator, 100μM EGTA/AM or 100 μM nifedipine for 30 min. Each point represents the mean ± standard error of the mean (n = 3).
3.3 Effects of the Intracellular Calcium Modulators on the Uptake Rate of Lactic Acid by HeLa Cells
The uptake rate of 14C L-lactic acid by HeLa cells upon exposure to the calcium modulators was measured at the apical pH of 4.5, which mimics in vivo vaginal conditions. A23187 at a concentration of 100 μM in the incubation medium lowered pHin (pH 5) and subsequently the uptake rate of lactic acid by 50% (0.47 ± 0.03 μmol/mg protein/min) of the control (Figure 3). In contrast, the uptake rates of lactic acid were 1.61 ± 0.27 μmol/mg protein/min and 2.32 ± 0.17 μmol/mg protein/minute in the presence of nifedipine (200 μM) or EGTA-AM (100 μM), respectively. The calcium modulators, nifedipine (200 μM) and EGTA-AM (100 μM), that lowered the [Ca2+]in levels and maintained the higher pHin (pH>6) of HeLa cells, enhanced the uptake rate of lactic acid by 60% and 130% of the control, respectively, supporting the hypothesis that the alterations of [Ca2+]in could affect the uptake rates of lactic acid by HeLa cells, which were pHin dependent.
Figure 3.

Effects of extra cellular sodium and calcium modulators on the uptake rate of L-lactic acid by HeLa cells at pH 4.5. L-lactate transport was measured in the absence (buffer alone) or presence of sodium, calcium ionophore A23187 (100 μM), calcium channel blocker nifedipine (200 μM) or intracellular calcium chelator EGTA-AM (100 μM). Each point represents the mean ± standard error of the mean (n = 3). *P < 0.05, **P < 0.01, ***P < 0.001 significantly different from control.
3.4 Effect of the Extracellular Sodium on the Uptake Rate of Lactic Acid in HeLa Cells
To confirm the involvement of NHE in the regulation of the MCT mediated process, the uptake rate of 14C L-lactic acid in HeLa cells in the presence or absence of sodium (∼ 50 mM) were examined. As shown in Figure 3, the uptake rate of lactic acid (0.5 μCi/ml 14C L-lactic acid plus 1 mM cold L-lactic acid) by HeLa cells treated with the sodium-containing solution (37.5 mM, pH 4.5) was 0.97 ± 0.28 μmol/mg protein per minute. On the contrary, the uptake rate of L-lactic acid by cells treated with the sodium-free buffer was reduced by 65% (0.34 ± 0.03 μmol/mg protein per minute) as compared with the control.
In a previous study,5 the classic MCT inhibitor, α-cyano-4-hydroxycinnamic acid (CHC), significantly affected the uptake rate of L-lactic acid by HeLa cells, indicating that L-lactic acid was transported through HeLa cell via the single type saturable process. The outcomes of these studies are indicative of the potential involvement of Na+-H+ exchangers in the MCT mediated uptake process.
3.5 Effects of the Intracellular pH (pHin) on the Uptake Rate of Lactic Acid by HeLa Cells
pHin of HeLa cells were induced with dexamethasone (2.0 or 2.5 μmol/L). pHin in HeLa cells treated with dexamethasone was lowered from pH of 7.4 to about 5.8, supporting that dexamethasone can ensue intracellular acidification of HeLa cells. The morphological features revealed that zinc ions did not inhibit dexamethasone-induced acidification. The uptake rate of lactic acid by HeLa cells evaluated under the 3 pHin conditions (pH 7.4, 6.4, 5.8) induced by dexamethasone followed a profile, whose rate gradually decreased as pHin decreased (Figure 4). These results were in good agreement with those induced by the calcium modulators, further confirming the integral role of pHin in the MCT-mediated regulation of lactic acid uptake.
Figure 4.

Effects of the intracellular pH induced by dexamethasone on the uptake rate of lactic acid by HeLa cells. Each point represents the mean ± standard deviation of the mean (n = 3-4). Values at pH 6.5 and 4.8 are significantly different from that of pH 7.4, P < 0.05.
3.6 Reverse Transcription Polymerase Chain Reaction (RT-PCR)
Reverse Transcriptase-Polymerase Chain Reaction (RT-PCR) analysis was used to identify MCT and NHE isoforms in cumulative mRNA isolated from HeLa cells. In a previous study,5 the results of the RT-PCR study with specific oligoprimers for MCT isoforms confirmed the presence of MCT-1, 5 and 6 at the apical membrane in HeLa cells.
The expression profiles of NHE1 and NHE3 mRNA in HeLa cells were also characterized based on NHE isoform-specific primers (Table I). Caco-2 mRNA was used as a positive control. As shown in Figure 5, RT-PCR yielded both NHE1 and NHE3 PCR products at 326 and 298 bp, respectively, which were identical in sizes to those from the previous report. NHE1 and NHE3 isoforms present in HeLa cells were detected at the same base pair levels as those in the positive control. GAPDH (Glyceraldehyde 3-phosphate dehydrogenase), which is used as a house keeping primer in RT-PCR, also produced a band with a known size, which was identical to the published sequence. 16 An identification of NHE isoforms validated the usage of HeLa cells in the MCT mediated substrate transport studies.
Figure 5.
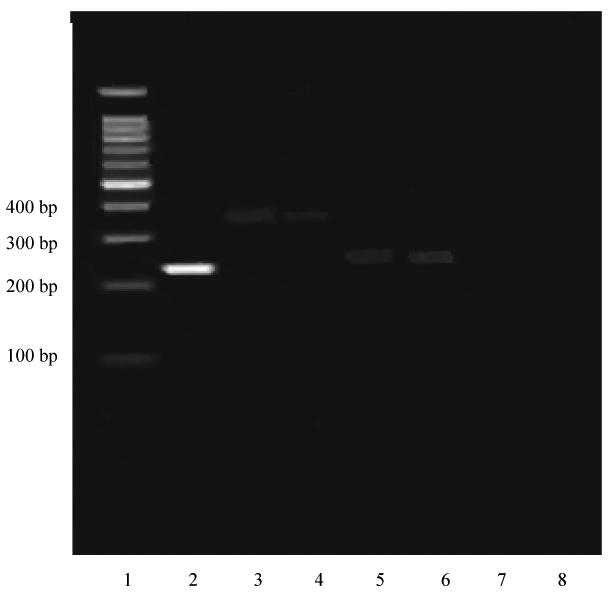
The results of the RT-PCR study for NHEs in HeLa Cells. Lane 1 represents 100 bp DNA ladder and lane 2 for GAPDH. Lanes 3 and 4 represent NHE1 for Caco-2 (positive control) and HeLa cell, respectively. Lanes 5 and 6 represent NHE3 for Caco-2 (positive control) and HeLa cell, respectively. Lanes 7 and 8 represent negative controls for NHE1 and NHE3, respectively. bp: base pairs.
4. Discussion
The cervical and intravaginal routes have been used for the delivery of locally active compounds, such as antibacterial, antifungal, antiprotozoal, antiviral, labor-inducing and spermicidal agents, prostaglandins and steroids. At present, the cervical route is broadening its role as a potential site for systemically active compounds. 17,18 One of the major defense mechanisms of the vagina against exogenous microbes is involved with the normal microbial flora, predominantly lactobacilli, which compete with exogenous microbes by generating organic acids, such as lactic acid, and maintaining a low pH (pH range-4.0 to 4.5).16,19,20 The elevated glucose consumption is a required component of the protective mechanisms of the vagina, as it produces acid and provides an evolutionary advantage to the cervical or vagina cells similar to the function of carcinogenesis. 21,22
This study was conducted to determine whether or not the intracellular calcium is involved with the monocarboxylate transporter (MCT) mediated lactic acid uptake process in the cervics. A human cervical adenocarcinoma cell line, HeLa cell, which expresses MCTs, has been used for the characterization of lactic acid transport. A reduction in the [Ca2+]in levels in HeLa cells was observed in the presence of calcium chelators like EGTA/AM or calcium channel blockers, such as nifedipine, whereas the elevated [Ca2+]in levels were observed upon exposure to the permeable calcium ionophores like A23187.
The calcium channel blocker, Nifedipine, enhanced the uptake rate of L-lactic acid by HeLa cells by 60 %, which is mainly attributed to the reduction of the [Ca2+]in levels. An addition of EGTA-AM produced the similar effects on the L-lactic acid uptake process to those produced by the channel blockers. In contrast, the Ca2+ ionophore, A23187, significantly reduced L-lactic acid uptake rate, which is mainly attributed to the enhancement of the [Ca2+]in levels.
Since the alteration of the [Ca2+]in levels was closely correlated with pHin and NHE activities in intestinal epithelial cells, 6,7,23 the intracellular pH changes in HeLa cells produced by the calcium modulators, such as calcium channel blockers, chelators or ionophores, were subsequently examined. nifedipine and EGTA-AM maintained pHin (less acidic), which is similar to those caused by the acidic buffer, and subsequently a higher electrochemical proton gradient across the apical plasma membrane, allowing faster uptake rates of L-lactic acid by HeLa cells. On the other hand, the Ca2+ ionophore, A23187, lowered the intracellular pH (highly acidic), thus reducing the transmembrane pH gradient, and subsequently the L-lactic acid uptake rate. MCT is a tertiary active transporter and the MCT mediated transport processes, especially the transcellular pathway, were affected by the pH gradient. The degree of reduction of the uptake rate of L-lactic acid by HeLa cells, whose acidic pHin was induced by dexamethsone, showed good correlation with those induced by calcium modulators.
The effects of [Ca2+]in on pHin appear to be best explained in terms of NHEs involvement in the pH regulation process. [Ca2+]in was identified as an integral regulator of Na+-H+ exchange activity 23 and NHEs are known to be indispensable in restoring intracellular pH towards the neutral values in response to acid-load stimulus.24 Previous studies showed that NHE3 in intestinal cells and fibroblasts are activated by calcium-dependent protein kinase C at the low [Ca2+]in concentrations.8,25 The involvement of NHEs in the MCT activity was also supported by the results in which the uptake rates of L-lactic acid decreased as the extracellular sodium levels decreased in the system. The sodium-free conditions prevent the NHEs from driving intracellular H+ ions out, followed by a decreased H+ gradient and reduction in the uptake of lactic acid. 26,27 The successive studies are undergoing to elucidate the role of each NHE isoform on the transport process of monocarboxylate substrates across cervical epithelium. It was also considered that the use of carcinoma cell line has the potential limitation, as the level of acidosis and the expression of transporters in normal tissues may be noticeably different, which may exert the distinctive discrepancy between in vitro outcome and clinical efficacy.
5. Conclusion
This study demonstrated that a reduction of the [Ca2+]in level could enhance the MCT mediated L-lactic acid uptake by HeLa cells. A close correlation between the [Ca2+]in level and pHin was indicative of the potential involvement of NHEs in the MCT mediated uptake process in HeLa cells. An understanding of the mechanisms responsible for the alterations of the [Ca2+]in and the MCT mediated transport process could lead to an efficient strategy to improve the uptake rate of monocarboxylate substrates through the cervical mucosa.
Acknowledgments
This work was supported by NIH grant HD 40784-01.
References
- 1.Palmieri F, Bisaccia F, Capobianco L, Dolce V, Fiermonte G, Lacobazzi V, Indiveri C, Plamieri L. Mitochondrial metabolite transporters. Biochim Biophys Act. 1996;1275:127–32. doi: 10.1016/0005-2728(96)00062-x. [DOI] [PubMed] [Google Scholar]
- 2.Price NT, Jackson VN, Halestrap AP. Cloning and sequencing of four new mammalian monocarboxylate transporter (MCT) homologues confirms the existence of a transporter family with an ancient past. Biochem J. 1998;329:321–328. doi: 10.1042/bj3290321. [DOI] [PMC free article] [PubMed] [Google Scholar]
- 3.Woolfson AD, Malcolm RK, Gallagher R. Drug delivery by the intravaginal route. Crit Rev Ther Drug Carrier Syst. 2000;17(5):509–55. [PubMed] [Google Scholar]
- 4.Pastorekova S, Ratcliffe PJ, Pastorek J. Molecular mechanisms of carbonic anhydrase IX-mediated pH regulation under hypoxia. BJU International. 2008;101(s4):8–15. doi: 10.1111/j.1464-410X.2008.07642.x. [DOI] [PubMed] [Google Scholar]
- 5.Cheeti S, Warrier BK, Lee CH. The Role of Monocarboxylat Transporters in Uptake of Lactic Acid in HeLa Cells. Int J Pharmaceutics. 2006;325:48–54. doi: 10.1016/j.ijpharm.2006.06.018. [DOI] [PubMed] [Google Scholar]
- 6.Duverne C, Bouten A, Deslandes A, Westphal JF, Trouvin JH, Farinotti R, Carbon C. Modification of cefixime bioavailability by nifedipine in humans: involvement of the dipeptide carrier system. Antimicrob Agents Chemother. 1992;36(11):2462–7. doi: 10.1128/aac.36.11.2462. [DOI] [PMC free article] [PubMed] [Google Scholar]
- 7.Wenzel U, Kuntz S, Diestel S, Daniel H. PEPT1-mediated cefixime uptake into human intestinal epithelial cells is increased by Ca2+ channel blockers. Antimicrob Agents Chemother. 2002;46(5):1375–80. doi: 10.1128/AAC.46.5.1375-1380.2002. [DOI] [PMC free article] [PubMed] [Google Scholar]
- 8.Maly K, Strese K, Kampfer S, Ueberall F, Baier G, Ghaffari-Tabrizi N, Grunicke HH, Leitges M. Critical role of protein kinase C alpha and calcium in growth factor induced activation of the Na(+)/H(+) exchanger NHE1. FEBS Lett. 2002;521(13):205–10. doi: 10.1016/s0014-5793(02)02867-3. [DOI] [PubMed] [Google Scholar]
- 9.Pinto V, Pinho MJ, Hopfer U, Jose PA, Soares-da-Silva P. Oxidative stress and the genomic regulation of aldosterone-stimulated NHE1 activity in SHR renal proximal tubular cells. Molecular and Cellular Biochemistry. 2008;310(12) doi: 10.1007/s11010-007-9680-6. [DOI] [PubMed] [Google Scholar]
- 10.Bröcher S, Artola A, Singer W. Intracellular injection of Ca2+ cHeLators blocks induction of long-term depression in rat visual cortex. PNAS. 1992;89(1):123–127. doi: 10.1073/pnas.89.1.123. [DOI] [PMC free article] [PubMed] [Google Scholar]
- 11.Kitakaze M, Koichi N, Tetsuo M, Hiroshi A, Tsunehiko K, Masatsugu H. A Ca channel blocker, benidipine, increases coronary blood flow and attenuates the severity of myocardial ischemia via NO-dependent mechanisms in dogs. J Am Coll Cardiol. 1999;33:242–249. doi: 10.1016/s0735-1097(98)00556-7. [DOI] [PubMed] [Google Scholar]
- 12.Pressman BC. Biological Applications of Ionophores. Annual Review of Biochemistry. 1976;45:501–530. doi: 10.1146/annurev.bi.45.070176.002441. [DOI] [PubMed] [Google Scholar]
- 13.Nakamura I, Nakai Y, Izumi H. Use of fura-2/AM to measure intracellular free calcium in Slenomonas ruminantium. Tohoku J Exp Med. 1996;179(4):291–4. doi: 10.1620/tjem.179.291. S. P. [DOI] [PubMed] [Google Scholar]
- 14.Huang KL, Lin LS, Fang The Involvement of Calcium in Heat-induced Coral Bleaching. Zoological Studies. 1998;37(2):89–94. [Google Scholar]
- 15.Chomczynsk P, Sacchi N. Single-step method of RNA isolation by acid guanidinium thiocyanate-phenol-chloroform extraction. Anal Biochem. 1987;162(1):156–9. doi: 10.1006/abio.1987.9999. [DOI] [PubMed] [Google Scholar]
- 16.Allen RW, Trach KA, Hoch JA. Identification of the 37-kDa protein displaying a variable interaction with the erythroid cell membrane as glyceraldehyde-3-phosphate dehydrogenase. J Biol Chem. 1987;262(2):649–653. [PubMed] [Google Scholar]
- 17.Vermani K, Gar S. The scope and potential of vaginal drug delivery. Pharm Sci Technol Today. 2000;3(10):359–364. doi: 10.1016/s1461-5347(00)00296-0. [DOI] [PubMed] [Google Scholar]
- 18.Chien YW, Lee CH. Drug delivery-vaginal route Encyclopedia of Pharmaceutical technology. Marcel Dekker; New York: 2002. [Google Scholar]
- 19.Aroutcheva A, Gariti D, Simon M, Scott S, Faro J, Simones JA, Gurguis A, Faro S. Defense factors of vaginal lactobacilli. Am J Obstet Gynecol. 2001;185:375–379. doi: 10.1067/mob.2001.115867. [DOI] [PubMed] [Google Scholar]
- 20.Wiberg-Itzel E, Cnattingius S, Nordstrom L. Lactate determination in vaginal fluids: a new method in the diagnosis of prelabour rupture of membranes. BJOG. 2005;112(6):754–8. doi: 10.1111/j.1471-0528.2004.00521.x. [DOI] [PubMed] [Google Scholar]
- 21.Fischer K, Hoffmann P, Voelkl S, Meidenbauer N, Ammer J, Edinger M, Gottfried E, Schwarz S, Rothe G, Hoves S, Renner K, Timischl B, Mackensen A, Kunz-Schughart L, Andreesen R, Krause SW, Kreutz M. Inhibitory effect of tumor cell-derived lactic acid on human T cells. Blood. 2007;109(9):3812–9. doi: 10.1182/blood-2006-07-035972. [DOI] [PubMed] [Google Scholar]
- 22.Gillies RJ, Robey I, Gatenby RA. Causes and Consequences of Increased Glucose Metabolism of Cancers. Journal of Nuclear Medicine. 2008;49(Suppl2):24S–42S. doi: 10.2967/jnumed.107.047258. [DOI] [PubMed] [Google Scholar]
- 23.Wali RK, Baum CL, Bolt MJ, Brasitus TA, Sitrin MD. 1, 25-dihydroxyvitamin D3 inhibits Na(+)-H+ exchange by stimulating membrane phosphoinositide turnover and increasing cytosolic calcium in CaCo-2. Endocrinology. 1992;131(3):1125–33. doi: 10.1210/endo.131.3.1324151. [DOI] [PubMed] [Google Scholar]
- 24.Noel J, Roux D, Pouyssegur J. Differential localization of Na+/H+ exchanger isoforms (NHE1 and NHE3) in polarized epithelial cell lines. J Cell Sci. 1996;109(Pt 5):929–39. doi: 10.1242/jcs.109.5.929. [DOI] [PubMed] [Google Scholar]
- 25.Lee KW, Kim JH, Choi JW, Kawano K, Cha B, Dartt DA, Zoukhri D, Donowit Ca2+-dependent inhibition of NHE3 requires PKC alpha which binds to E3KARP to decrease surface NHE3 containing plasma membrane complexes. Am J Physiol Cell Physiol. 2003;285(6):C1527–36. doi: 10.1152/ajpcell.00017.2003. [DOI] [PubMed] [Google Scholar]
- 26.Tarpey PS, Wood IS, Shirazi-Beechey SP, Beechey RB. Amino acid sequence and the cellular location of the Na(+)-dependent D-glucose symporters (SGLT1) in the ovine enterocyte and the parotid acinar cell. Biochem J. 1995;312(Pt 1):293–300. doi: 10.1042/bj3120293. [DOI] [PMC free article] [PubMed] [Google Scholar]
- 27.Ruddock NT, Machaty Z, Prather RS. Intracellular pH increase accompanies pathenogenetic activation of porcine, bovine and murine oocytes. Reprod Fertil Dev. 2000;12(34):201–7. doi: 10.1071/rd00029. [DOI] [PubMed] [Google Scholar]