

Abstract
The transferrins are a family of bilobal iron-binding proteins that play the crucial role of binding ferric iron and keeping it in solution, thereby controlling the levels of this important metal. Human serum transferrin (hTF) carries one iron in each of two similar lobes. Understanding the detailed mechanism of iron release from each lobe of hTF during receptor mediated endocytosis has been extremely challenging because of the active participation of the transferrin receptor (TFR), salt, a chelator, lobe-lobe interactions and the low pH within the endosome. Our use of authentic monoferric hTF (unable to bind iron in one lobe) or of diferric hTF (with iron locked in one lobe), provided distinct kinetic end points allowing us to bypass many of the previous difficulties. The capture and unambiguous assignment of all kinetic events associated with iron release by stopped flow spectrofluorimetry, in the presence and absence of the TFR, unequivocally establishes the decisive role of the TFR in promoting efficient and balanced iron release from both lobes of hTF during one endocytic cycle. For the first time the four microscopic rate constants required to accurately describe the kinetics of iron removal are reported for hTF with and without the TFR. Specifically, at pH 5.6, the TFR enhances the rate of iron release from the C-lobe (7- to 11-fold), and slows the rate of iron release from the N-lobe (6- to 15-fold), making them more equivalent and producing an increase in the net rate of iron removal from Fe2hTF. Calculated cooperativity factors, in addition to plots of time dependent species distributions in the absence and presence of the TFR clearly illustrate the differences. Accurate rate constants for the pH and salt induced conformational changes in each lobe precisely delineate how delivery of iron within the physiologically relevant time frame of 2 min might be accomplished.
Keywords: Stopped flow fluorescence, iron release kinetics, salt effect, iron release model
Introduction
Human serum transferrin (hTF)1 is a bilobal ferric iron binding glycoprotein. The nearly homologous N- and C- lobes are connected by a short peptide linker and are further divided into two subdomains (NI/NII and CI/CII). The subdomains come together to form an iron binding cleft within each lobe. 1; 2 Diferric hTF preferentially binds to specific hTF receptors (TFR) on the cell surface at neutral pH. 3 The complex undergoes clathrin dependent receptor-mediated endocytosis during which the clathrin coated pit fuses with an endocytic vesicle. The pH within the endosome is lowered to ∼5.6 resulting in protonation of the synergistic carbonate anion and the iron binding residues, which loosens the cleft and facilitates iron release to an, as yet, unidentified chelator. At the low pH within the endosome, iron free hTF (apohTF) remains bound to the TFR and is recycled back to the cell surface. Upon exposure to the pH of serum (∼7.4), the complex dissociates and released apohTF is free to bind more iron and to repeat the cycle. The entry of hTF into the cell, removal of iron from hTF and return to the surface is complete in ∼2-3 minutes. 4; 5 Because ferrous iron is transported out of the endosome by a divalent metal transporter, DMT1, there is a requirement for reduction of the ferric iron (Fe3+). 6 Discovery of a ferrireductase, Steap3, residing in the membrane of the endosome provided a means to accomplish the reduction. 7 While the TFR is known to influence the redox potential of iron bound to hTF 8, the weight of evidence indicates that Fe3+ is first released from Fe2hTF and is then reduced by Steap3. 9
Ferric iron is coordinated in a near octahedral geometry by identical ligands in each lobe of hTF: two tyrosines, one histidine, one aspartic acid and two oxygen atoms from the synergistic carbonate anion, which in turn is anchored to a highly conserved arginine residue. 10 Although the iron binding ligands are identical, the precise steps leading to iron release from each lobe differ, due largely to differences in the “second-shell” residues which do not directly coordinate the iron, but participate in an extended and intricate hydrogen bonding network with the primary ligands. 11- 13
Two lysine residues lie on opposite sides of the iron binding cleft, Lys206 in the NII subdomain and Lys296 in the NI subdomain, and are 3.04 Å apart in the iron-bound isolated hTF N-lobe structure and 9 Å apart in the apo structure of this lobe; these residues comprise the “dilysine trigger”. 12- 14 They share a hydrogen bond at neutral pH which is protonated at low pH and literally triggers the opening of the cleft. In the C-lobe, Lys534 (in the CII subdomain) and Arg632 (in the CI subdomain) are found in homologous positions to Lys206 and Lys296, respectively. 14 Mutation of Lys206 to glutamate in the N-lobe or Arg632 to alanine in the C-lobe to form LockNhTF and LockChTF constructs, respectively, completely prevents iron release from that lobe on a relevant timescale and allows targeted measurement of iron release from the opposite lobe. 15- 17
It is well established that the presence of salt affects the iron release properties for each lobe of hTF. 18 In fact, iron release requires binding of a non-chelating anion, such as Cl-, to an anion binding site that is distinct from the synergistic anion binding site. Specifically, it has been suggested that residues termed kinetically significant anion binding (KISAB) sites exist in each lobe of hTF. 19 To exert an effect, such anions must bind to site(s) on the iron loaded, closed form of hTF. Ideally, the anion binding effect should also be pH sensitive; at neutral pH, it would exert a negative or retarding effect on iron release because it is highly desirable to retain iron until delivery within the endosome. Once iron is removed, anions may play a different role in which they bind to and stabilize the open conformation. This suggestion is substantiated by identification of sulfate binding sites in the N-lobe which are inaccessible in the iron bound N-lobe and therefore anions cannot exert any effect on them until the iron is removed. 20; 21
The rate of iron release from hTF can be measured by an increase in the intrinsic Trp fluorescence (with a small contribution from Tyr residues) that occurs upon iron removal. Human TF has eight Trp residues, three in the N-lobe and five in the C-lobe. Ferric iron within each binding cleft strongly quenches Trp fluorescence through radiationless transfer of electronic excited-state energy. 22 This energy is transferred via a Tyr to Fe3+ charge transfer absorption band at 470 nm 23 which overlaps the Trp fluorescence emission band. Additionally, the charge transfer band results in a disruption of the π to π* transition energy of the liganding Tyr residues which leads to an increase in the UV absorbance overlapping the intrinsic Trp fluorescence. 22 The decrease in absorbance (at 470 nm) or the increase in the fluorescence signal, have both been utilized to derive rate constants associated with the iron release process. The recovery of the intrinsic fluorescence signal from Trp (and to a much smaller extent, Tyr) can be monitored as iron is removed from hTF. Additionally, the large conformational changes associated with iron removal impact specific Trp residues which are very sensitive to alterations in their local environment. 24; 25 Thus, the increase in the intrinsic Trp signal is ascribed to a combination of unquenching by loss of iron, which triggers the large conformational changes in hTF and more localized changes in the immediate environment of the Trp residues. Recent studies from our laboratory have determined the contributions of the individual Trp residues in each lobe to the iron release signal 26; 27 with no contribution from the 22 Trp residues in the sTFR dimer. 28
Early studies by Aisen and colleagues provided the first insights into the mechanistic role of the TFR in iron removal from Fe2hTF.29-31 A time-based steady-state fluorescence approach to monitoring iron release using the increase in the intrinsic Trp fluorescence from hTF was pioneered by the Aisen laboratory.32 In their series of kinetic studies, iron release to the chelator pyrophosphate was measured with N- and C-lobe monoferric, diferric and mixed metal transferrins with kinetically inert Co3+ introduced into one lobe and Fe3+ in the other lobe of the protein. Experiments were performed in the presence or absence of full length TFR isolated from placenta and solubilized at pH 5.6 using detergent micelles. Despite the technical challenges of this work (assuring that the metal was in the assigned lobe and remained there during the experiment, the low yield of TFR from placenta, the requirement of detergent for its solubilization, and the instability of TFR at pH 5.6), the authors were able to conclude that in the absence of the TFR, iron is released from the N-lobe followed by the C-lobe and that, binding to the TFR induced a switch in this order. 29-31 Iron release from both lobes was observed to occur at comparable rates on the time scale of seconds.
More recently, the laboratory of el Hage Chahine carried out pH jump chemical relaxation studies at 4.3 ≤ pH ≤ 6.5 in which iron was removed from diferric and C-lobe monoferric transferrins using acetate as the competing ligand in the presence and absence of detergent solubilized TFR from placenta.33; 34 Contrary to the findings of the Aisen laboratory, it was concluded that iron is preferentially removed from the N-lobe in both instances. Moreover, in the presence of receptor, a rapid kinetic event on a time scale of milliseconds was assigned to removal of iron from the N-lobe whereas a much slower kinetic event on a time scale of seconds was assigned to removal of iron from the C-lobe.
In the present work, we have addressed these issues by exploiting recombinant technology, including site-directed mutagenesis, to produce authentic monoferric constructs (in which iron can bind in only one lobe or the other, FeNhTF and FeChTF) and diferric locked constructs (in which iron can be removed from only one lobe or the other, LockNhTF and LockChTF), as well as the sTFR (eliminating the need for detergent) to allow unambiguous assignment of events related to iron release from hTF. The use of a sensitive stopped-flow spectrofluorimeter has provided data with a high signal-to-noise ratio, allowing observation of early kinetic events not previously detected using the less sensitive steady-state format. Precise fitting of progress curves was achieved with equations describing the kinetic processes occurring during iron removal. In addition to iron release, we were able to assign rate constants to conformational changes within the individual lobes of hTF, to interactions with the sTFR and to salt effects. Building on our recent qualitative study of iron release from these constructs and a model presented for iron release from Fe2hTF in the absence of the sTFR 17, we now present a comprehensive model for iron release from Fe2hTF in the presence of the sTFR that more fully describes this complicated system. We provide accurate rate constants and irrefutable evidence that a critical role of the sTFR is to balance rates of iron release from both lobes so that removal from Fe2hTF occurs efficiently during one cycle of endocytosis. We also offer a compelling argument for why hTF is bilobal. Although our findings are in general accord with the early studies of Aisen and coworkers, 29-31 they are more comprehensive and provide valuable new insights into this complex system.
Results and Discussion
Kinetic curves
The normalized kinetic curves for each authentic monoferric and locked construct at pH 5.6 under our “standard conditions” (100 mM MES, pH 5.6, 300 mM KCl and 4 mM EDTA) are overlaid with the curve for iron release from Fe2hTF ± sTFR (Fig. 1). These conditions were chosen to simulate the putative endosomal pH. Because it is well established that salt affects the process, we arbitrarily chose a salt concentration (although as detailed below we assessed the effect of different concentrations of salt on the kinetic process). The chelator EDTA was chosen due to its stability and affinity for ferric iron at pH 5.6. A single concentration of EDTA was selected to provide a large excess allowing us to maintain pseudo-first order conditions in all experiments. It is important to remember that we are monitoring the increase in the intrinsic Trp fluorescence signal upon iron release, and that both the unquenching of Trp residues as a result of iron removal, and changes in local environment of the three Trp residues in the N-lobe and five in the C-lobe are observed. In fact we have shown that only Trp128 and Trp264 in the N-lobe make significant contributions to the signal.26 Likewise in the C-lobe the contributions are not uniform with Trp460 in the cleft being the major contributor to the fluorescent signal. 27 Although the TFR does not contribute to the change in the fluorescent signal upon release of Fe3+ from hTF, binding of hTF to the TFR results in a significant decrease in the magnitude of the signal. 28
Fig 1.
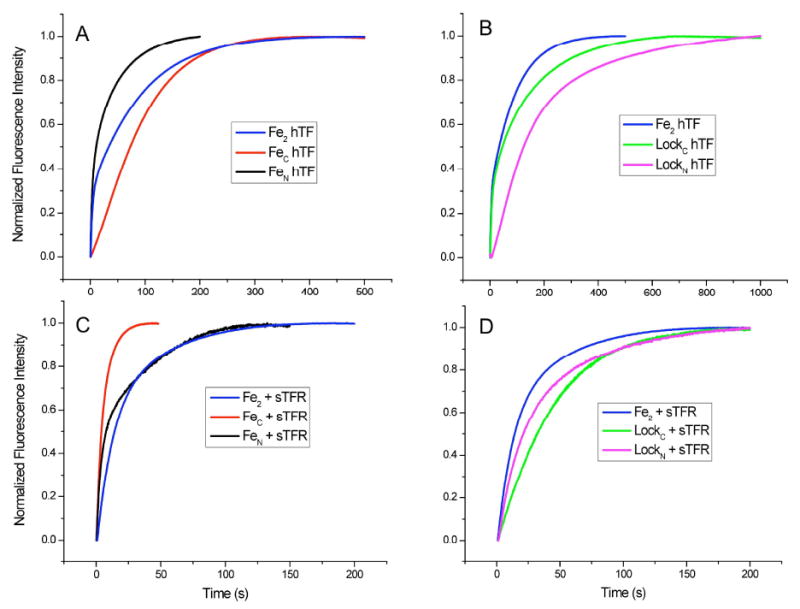
Representative normalized stopped-flow fluorescence iron release progress curves in the presence and absence of the sTFR. A) Overlay of FeNhTF, FeChTF and Fe2hTF, B) Overlay of LockNhTF, LockChTF and Fe2hTF, C) Overlay of FeNhTF/sTFR, FeChTF/sTFR and Fe2hTF/sTFR, D) Overlay of LockNhTF/sTFR, LockChTF/sTFR and Fe2hTF/sTFR. In each experiment, one syringe contained protein (375 nM) in 300 mM KCl and the other contained iron removal buffer (200 mM MES, pH 5.6, 300 mM KCl and 8 mM EDTA). Samples were excited at 280 nm and emission was monitored using a 320 nm cut-on filter; the temperature was set at 25°C.
As shown in Fig. 1, there are striking differences with regard to the shapes of the kinetic curves and their time courses for completion. Of great interest is the effect that the sTFR has on the iron release process (Figs. 1A and 1B vs. 1C and 1D). Although significant differences are obvious simply from a visual comparison of the progress curves for the various constructs, quantitative information can only be derived from accurate fitting of the data as detailed below.
Kinetic scheme
As established many years ago31; 35, the stepwise removal of iron from Fe2hTF to form monoferric transferrins and apohTF (in the absence and presence of the sTFR) depends on four microscopic rate constants k1N, k1C, k2N and k2C according to Scheme I. Expressions have been developed for the time dependence of the concentrations of all four species and for the fluorescence intensity change measured in the stopped-flow experiments. Equations 1-4 in Table 1 represent the final integrated rate laws for the concentrations of Fe2hTF, FeChTF, FeNhTF and apohTF as a function of time where [Fe2hTF]o is the initial concentration of Fe2hTF. The derivation of these equations is provided in the Supplemental Data. Substitution of the concentrations (equations 2, 3 and 4) into equation 5 (Table 1) provides the final kinetic expression for the change in fluorescence intensity as iron is removed.
Scheme I.

Table 1.
Integrated rate equations
| ||
| ||
| ||
| ||
| The change in fluorescence intensity F(t) as a function of time is related to the time-dependent concentrations through equation 5, in which FC, FN and Fapo are the molar fluorescence intensity constants for the monoferric hTFs and for apohTF, respectively. | ||
|
Additionally, the kinetics of the constructs utilized to isolate k1N (LockChTF), k1C (LockNhTF), k2N (FeNhTF) and k2C (FeChTF) were fit to standard consecutive reaction models (A→B, A→B→C or A→B→C→D) as detailed in the Supplemental Data where examples of curve fitting of the data are also provided (Figs. S1 – S3).
Kinetic assessment of iron release and conformational changes (no sTFR)
The rate constants presented in Fig. 2A are based on analysis of the curves in Figs. 1A and 1B and are summarized in Table S1A. By using authentic locked and monoferric constructs (indicated below the arrows) along with the Fe2hTF data, we can specifically assign rate constants k1N, k2N, k1C and k2C for each iron removal step as well as rate constants reflecting conformational changes. The assignment of rate constants to iron removal steps is predicated on the reasonable assumption that they should have very similar values for a given lobe of the diferric, monoferric and locked constructs. In no case is the assignment ambiguous when this criterion is applied (see Tables S1A and S1B).
Fig. 2.
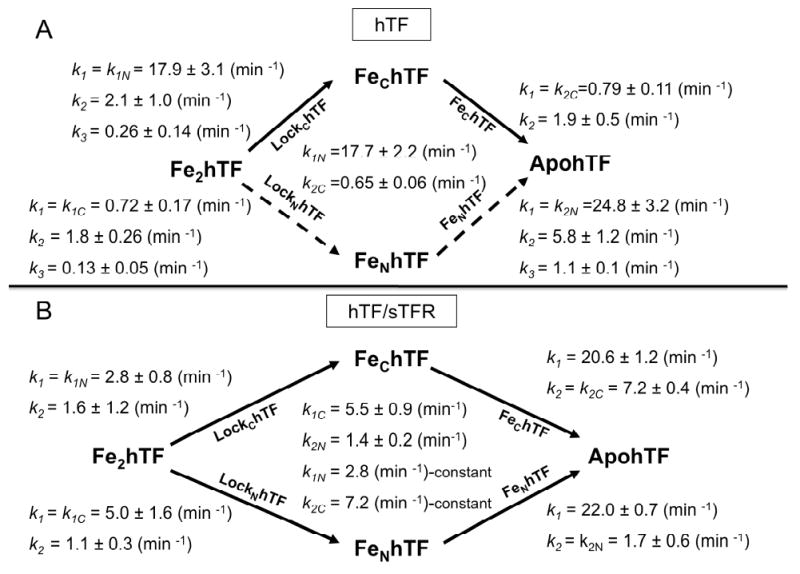
Pathways of iron release ± sTFR. A) Iron release pathways of Fe2hTF in the absence of the sTFR, B) and the presence of sTFR. Primary pathways taken are indicated by solid black arrows, alternative pathway indicated by dashed black arrows. The specific construct to isolate the rate constants are indicated below the arrows. Rate constants ± errors at the 95% confidence level from multiple kinetic runs were obtained from curve fitting of the data to models described in the text and in Supplemental Data and are indicated for each construct. In Fig. 2B, k1N (= 2.8 min-1) and k2C (= 7.2 min-1) were held fixed at the values for LockChTF and FeChTF, respectively, during fitting of the Fe2hTF/sTFR data (See Supplemental Data).
In the absence of the sTFR, curve fitting of the Fe2hTF data indicates that iron is almost exclusively released first from the N-lobe (k1N = 17.7 ± 2.2 min-1) and then slowly from the C-lobe (k2C = 0.65 ± 0.06 min-1), i.e., of the iron is removed from the diferric protein through the upper kinetic pathway of Fig. 2A. (Note that inclusion of the rate constants for the conformational transitions in the fitting equations for the kinetic data for Fe2hTF does not result in any significant changes in the values obtained for the rate constants k1N and k2C (Supplemental Data)).
The above assignment of rate constants for Fe2hTF is confirmed by analysis of the data from the LockChTF and FeChTF constructs which provide independent measures of k1N and k2C, respectively. The LockChTF data best fit an A→B→C→D model, giving three rate constants k1 = k1N = 17.9 ± 3.1 min-1 (vs. k1N = 17.7 min-1 for Fe2hTF), k2 = 2.1 ± 1.0 min-1 and k3 = 0.26 ± 0.14 min-1, the first assigned to iron release from the N-lobe and the latter two to sequential conformational changes within the N-lobe, ultimately leading to its final open apo conformation. Similar conformational changes are also observed for the N-lobe of FeNhTF and the isolated N-lobe (see below). The kinetics for FeChTF fit an A→B→C model with k1 = k2C = 0.79 ± 0.11 min-1 for iron release (vs. k2C = 0.65 min-1 for Fe2hTF) and one additional C-lobe event (k2 = 1.9 ± 0.5) ascribed to a structural adjustment to the final apo-conformation, an event also observed with the C-lobe of LockNhTF and the isolated C-lobe (see below).
The rate constants determined for the LockNhTF and LockChTF constructs provide further convincing support for the proposed order of iron release. If the alternative (lower) pathway (Fig. 2A, dashed black arrows) was followed, then the rate constant k1C for iron release from the C-lobe of LockNhTF would be faster than the rate constant k1N for iron release from the N-lobe of LockChTF but the opposite is true (k1C = 0.72 vs. k1N = 17.9 min-1).
The LockNhTF data was fit to the A→B→C→D model providing three rate constants, the first being k1 = k1C = 0.72 ± 0.17 min-1, which corresponds very well to the rate of iron release from FeChTF (k1 = k2C = 0.79 ± 0.11 min-1) and k2C (0.65 ± 0.06 min-1) from Fe2hTF. Similar to LockChTF, iron release from the C-lobe of LockNhTF is followed by two conformational events with k2 = 1.8 ± 0.26 min-1 and k3 = 0.13 ± 0.05 min-1. We note that the rate constants corresponding to these conformational events have similar values in both LockNhTF and LockChTF, namely, k2 = 1.8 min-1 and k3 = 0.13 min-1 vs. k2 =2.1 min-1 and k3 = 0.26 min-1.
The kinetic data for FeNhTF indicates an initial fast step corresponding to iron release from the N-lobe (k1 = k2n = 24.8 ± 3.2 min-1), followed by two slower conformational events within the N-lobe (k2 = 5.8 ± 1.2 min-1 and k3 = 1.1 ± 0.1 min-1). The rate of the final conformational change to the apo-conformation is similar for the two monoferric constructs, FeNhTF and FeChTF, i.e., k3 = 1.1 ± 0.1 vs. 1.9 ± 0.5 min-1.
To further solidify the assignments and to elucidate the contribution of the lobe-lobe interaction to the kinetics, we determined rate constants for the isolated N- and C-lobes, i.e., the two half-molecules of hTF. Data from the isolated N-lobe fit best to the A→B→C→D model, yielding three rate constants, the first k1 = kN = 53.7 ± 3.3 corresponding to iron removal and the other two, k2 = 7.2 ± 1.1 min-1 and k3 = 1.2 ± 0.6 min-1, to conformational events as previously noted for the N-lobes of FeNhTF and LockChTF, the last event being the transition to the final apo N-lobe conformation. In contrast, data from the isolated C-lobe fit best to the A→B→C model, yielding two rate constants k1 = kC = 0.87 ± 0.10 min-1 and k2 = 1.8 ± 0.6 min-1 which are essentially identical to k1 = k2C = 0.79 min-1 and k2 = 1.9 min-1 for the C-lobe of FeChTF.
As previously discussed 36, iron release from the N-lobe is substantially faster than iron release from the C-lobe (kN = 53.7 min-1 vs. kC = 0.87 min-1). Additionally, comparison of the rate of iron release from the isolated N-lobe to the full length constructs, reveals that the presence of the C-lobe substantially slows (3-fold) the rate of iron release from the N-lobe (kN = 53.7 min-1 vs. k1N = 17.9 min-1). In contrast, the rate constant for iron release from the C-lobe is essentially the same in the presence or absence of the N-lobe (kC = 0.87 min-1 vs. k1C = 0.72 min-1). This observation is in agreement with our previous qualitative data which showed that iron release from the N-lobe in the absence of the receptor was impacted by the conformation of the C-lobe, whereas iron release from the C-lobe was not affected by the conformation of the N-lobe. 37 The kinetic cooperativity factors k2N/k1N = 24.8/17.9 = 1.4 and k2C/k1C = 0.79/0.72 = 1.1, which reflect the effect of occupancy of the other lobe on the rate constant, also substantiate this assertion. These factors indicate that iron is removed more quickly from the N-lobe when the C-lobe is unoccupied, whereas occupancy of the N-lobe has little effect on the rate of iron release from the C-lobe.
Kinetic assessment of iron release and conformational changes from hTF/sTFR complexes
The rate constants presented in Fig. 2B are based on analysis of the curves in Figs. 1C and 1D and are summarized in Table S1B. Their assignments follow a similar rationale to that presented above. Complete details are provided in the Supplemental Data.
Under our standard conditions, the kinetic data for iron release supports previous work showing that the sTFR induces a switch in the order of iron release, such that the C-lobe preferentially releases its iron followed by the N-lobe (Fig. 2B, lower pathway). 30; 31 However, although analysis of the data in Fig. 2B corroborates this assertion, the situation is more complex. Thus the fits indicate that iron release through the upper pathway of Fig. 2B is reduced from 96% in the absence of receptor to approximately 35% in its presence. Therefore it is apparent that both the upper and lower pathways play important roles in the efficient removal of iron from Fe2hTF in the presence of sTFR.
Based on the data for LockNhTF and FeChTF, a ∼7- to 11-fold increase in the rate constant for iron release from the C-lobe is observed in the presence of sTFR (k1C,complex = 5.0 min-1 vs. k1C,alone = 0.72 min-1 and k2C,complex = 7.2 min-1 vs. k2C,alone = 0.79 min-1). Furthermore, based on the LockChTF and FeNhTF data, there is a 6- to 15-fold decrease in the rate constant for iron release from the N-lobe upon binding of hTF to the sTFR (k1N,complex = 2.8 min-1 vs. k1N,alone = 17.9 min-1 and k2N,complex = 1.7 min-1 vs. k2N,alone = 24.8 min-1). These differences are completely consistent with the rate constants that we have determined for iron release from Fe2hTF (Fig. 2 and Table S1) and recently published urea gel data showing that the binding to the receptor changes the order of iron release from the two lobes.37 Importantly, the two rate constants for iron release from each lobe (k1C vs. k1N and k2C vs. k2N) are closer to each other in the presence of the sTFR than in its absence. For example, in the absence of sTFR, iron release from the N-lobe is ∼25 times faster (= k1N,alone/k1C,alone) than iron release from the C-lobe; however in the presence of the sTFR, iron release from the C-lobe is only ∼ 2 times faster (= k1C,complex/k1N,complex) than the N-lobe and similarly for k2C and k2N, indicating a leveling of rates. Thus, because the binding to the TFR balances the rate of iron release from the two lobes, both pathways become important in the release of iron from hTF. As indicated by the cooperativity factors, the cooperativity between the lobes in iron release is also significantly affected by the binding to the sTFR, i.e, (k2N/k1N)alone = 1.4 and (k2C/k1C)alone= 1.1 vs. (k2N/k1N)complex = 0.61 and (k2C/k1C)complex = 1.5. Therefore, in the presence of the sTFR, the effect of occupancy of the C-lobe on the release of iron from the N-lobe is reversed from what it was in its absence. Moreover, in the presence of the sTFR, occupancy of the N-lobe retards the rate of iron release from the C-lobe whereas, in its absence, N-lobe occupancy had little influence on the kinetics of the C-lobe.
It was previously reported that the TFR has little effect on iron release from the monoferric N-lobe 30; however, this earlier study captured only a single global kinetic event. Subsequently a small decrease in the rate of iron release from the N-lobe of hTF with Co3+ bound in the C-lobe was reported 31. In our work, even though it appears that k1 from FeNhTF alone and in complex with the sTFR are equal, as described in the Supplemental Data, they can be confidently assigned to different events (Fig. 2).
Unfortunately, it is not possible to measure iron release from the isolated lobes bound to the sTFR because the isolated N-lobe does not bind at all to the sTFR 38; 39 and the isolated C-lobe binds only weakly.40 This is another indication that both lobes are required to achieve physiologically significant binding to the sTFR and that this binding tends to balance iron release from each.
The pronounced effect of the sTFR on iron release from the Fe2hTF is most clearly appreciated from the time dependent species distribution diagrams shown in Fig. 3. Fig. 3A shows the species profile in the absence of the TFR. Iron is first rapidly lost from the N-lobe (k1N = 17.7 min-1) to form FeChTF which then only slowly releases its iron (k2C = 0.65 min-1) in the rate limiting step to form apohTF. Little iron (∼ 4%) is released from the C-lobe first (k1C = 0.72 min-1) to form a small amount of FeNhTF which then rapidly decays (k2N = 24.8 min-1) to apohTF (Fig. 3A). In the absence of the sTFR, the time for 95% of the iron to be removed from the protein is 4.7 min (Fig. 3A), whereas in its presence, this time is reduced to 2.0 min (Fig. 3B), a time well within the 2-3 min required for one cycle of endocytosis. 4; 5 The role of both pathways in the enhanced net rate of iron removal in the Fe2hTF/sTFR complex is further illustrated in Fig. 3B where the formation and decay of significant amounts of both FeNhTF and FeChTF intermediates in the two pathways are evident.
Fig. 3.
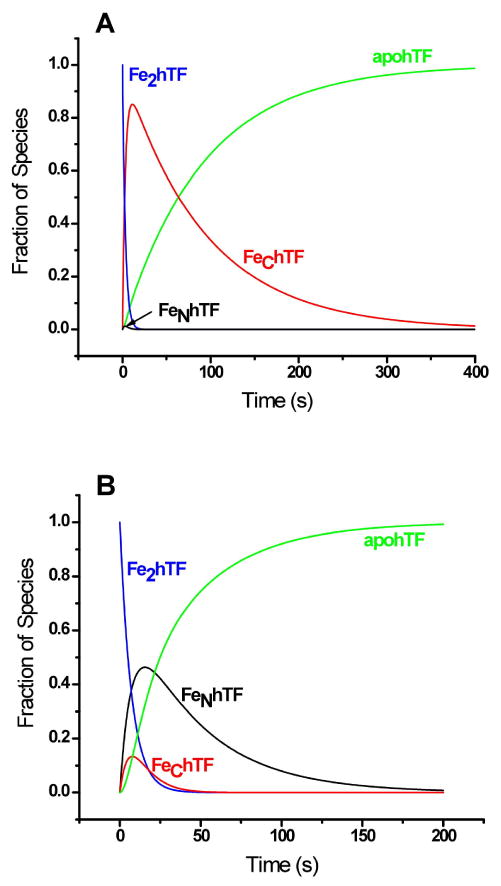
Species-time distributions in the absence and in the presence of the sTFR. Distribution curves were calculated using equations 1 – 4 (Table 1) with the following rate constants: A) k1N = 17.7 min-1, k1C = 0.72 min-1, k2N = 24.8 min-1 and k2C = 0.65 min-1 and B) k1N = 2.8 min-1, k1C = 5.5 min-1, k2N =1.4 min-1 and k2C = 7.2 min-1.
Findings from the laboratory of el Hage Chahine 34 are at variance with our results and those of the Aisen laboratory30; 31 in two significant ways. As previously noted, Hemadi et al. 34 reported that iron is released first from the N-lobe and then from the C-lobe in both the presence and absence of the full length TFR and that the rates differ ∼ 1000-fold when hTF is bound to TFR. Our results convincingly demonstrate that at pH of 5.6 the order is reversed such that, in the presence of the TFR, iron is released first from the C-lobe and that the rates are comparable for the two lobes. While the use of a detergent micelle employed to solubilize the full length TFR from placenta preclude a truly direct comparison of their results with ours, we have nevertheless attempted to find the origin of the discrepancy by carrying out stopped-flow measurements with Fe2hTF under the other conditions of their experiments (50 mM acetate, 200 mM KCl, pH 5.6, 37 °C) with and without sTFR. Significantly, with acetate as the competing ligand, we find only limited removal of iron from the protein at pH 5.6 in the absence of sTFR and essentially no removal in its presence (Fig. S4A and B). Only when EDTA is added to the acetate buffer do we observe rapid and complete iron removal. While the experimental protocol of Hemadi et al 34 may be adequate for iron removal below pH < 5, it does not appear to be effective at stripping iron from the protein at the physiologically pH 5.6 of the endosome. These observations raise the question as to the relevance of their findings to ours and those of the Aisen laboratory and argue for the use of a stronger chelator in these studies.
Salt induced changes in rate constants
In the absence of receptor, salt has the most dramatic effect (∼ 4-fold) on the rate of iron release (k1) from the N-lobes of Fe2hTF and FeNhTF, increasing the rate constant from ∼ 6 min-1 to ∼ 27 min-1 (Fig. 4A). More modest changes (< 2-fold) are seen for iron release from the N-lobe of LockChTF and the isolated N-lobe (Fig. 4A), as well as the C-lobe and other kinetic events in both lobes (data not shown). The rate constants for iron release (k1) from the N-lobe of Fe2hTF, FeNhTF and LockChTF increase linearly with increasing concentrations of salt between 50-600 mM KCl, presumably due in large part to Cl- binding to the KISAB sites. 18; 19 Of interest, iron release from the isolated N-lobe shows a very modest increase between 50-300 mM KCl, and then decreases at 600 mM KCl. This is not observed for any of the other constructs, indicating that iron release from the isolated N-lobe is actually inhibited at a sufficiently high concentration of salt (even at pH 5.6). Nevertheless, iron release from the isolated N-lobe (at all salt concentrations) is significantly faster than iron release from the N-lobe of any of the full length constructs at the same salt concentration, again consistent with the contention that the presence of the C-lobe slows iron release from the N-lobe. Of further interest is the observation that at 150 mM salt or below, the FeNhTF data fit well to the A→B→C model whereas above 150 mM salt the A→B→C→D model was required. Although this reveals that a new conformational event is observed with increasing concentrations of salt, the rate constant k2 = 5.8 min-1 derived for this event is unchanged by increasing the salt concentration further.
Fig. 4.
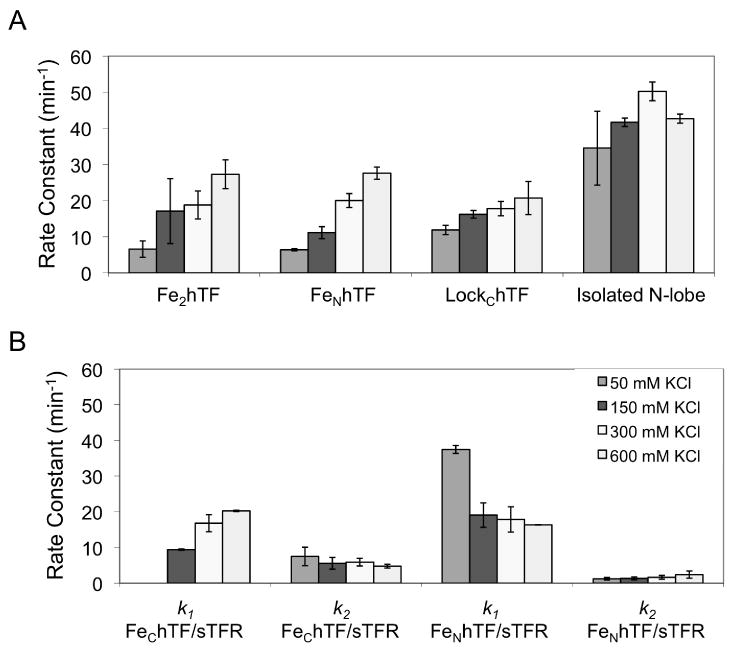
Salt effect on iron release from various hTF constructs in the absence and presence of the sTFR. A) Only the rate constant for iron release from the N-lobe at the various salt concentrations (indicated in the legend in Fig. 4B) is shown for Fe2hTF, FeNhTF, LockChTF and the isolated N-lobe at pH 5.6. Except for the salt concentration, the conditions are exactly as indicated in the legend to Fig. 1. B) Both k1 and k2 as a function of salt concentration are presented for the two monoferric hTF species bound to the sTFR under the same conditions as above.
Although salt is necessary for iron removal from the hTF/sTFR complexes 32, the effect of the sTFR far exceeds that of salt. Thus, as indicated above, the sTFR induces a switch in the order of iron removal, which results in an increase in the rate constant for iron release from the C-lobe and a decrease in the rate constant for iron release from the N-lobe. Varying the concentration of salt when monitoring iron release from hTF/sTFR complexes, results in more subtle changes in rate constants than the changes observed when the sTFR is absent (Fig. 4B). In both the FeNhTF/sTFR and FeChTF/sTFR complexes, iron release is preceded by a conformational change with a rate constant k1 (Fig. 2B) that is affected by salt in opposite ways for the two constructs. As shown in Fig. 4B, for FeNhTF/sTFR, the rate constant k1 decreases with increasing salt concentration from 37.1 ± 1.1 min-1 to 16.4 ± 1.1 min-1 and for FeChTF/sTFR, this event is only observed at 150 mM KCl and above where k1 increases from 9.4 ± 0.2 min-1 to 20.3 ± 1.1 min-1 with increasing salt concentration, making the rate constants for the N and C-lobes more equal. In combination with the presence of the sTFR, this salt sensitive conformational change appears to prime each lobe for iron release, perhaps through a KISAB mechanism.
In summary, we have assigned the specific events describing the iron release process from Fe2hTF by utilizing authentic monoferric and locked constructs to elucidate individual steps leading to complete iron removal in the absence and presence of the sTFR. The excellent signal to noise in the kinetic curves for transferrin is unprecedented allowing precise dissection of the kinetic events. At pH 5.6, the sTFR enhances the rate of iron release from the C-lobe (7- to 11-fold,) and slows the rate of iron release from the N-lobe (6- to15-fold), making them more equivalent and producing an increase in the net rate of iron removal from Fe2hTF. Additionally, the presence of the C-lobe in the protein slows iron release from the N-lobe, and, along with the requirement of both lobes for strong binding to the receptor, provides a compelling argument for the bilobal nature of hTF. The unique combination of pH and salt induced conformational changes in each lobe of hTF and the TFR appear to be exquisitely tuned to maximize the delivery of iron within the cell in the physiologically relevant time frame of 2 min.
Materials and Methods
Materials
Dulbecco's modified Eagle's medium-Ham F-12 nutrient mixture (DMEM-F12), antibiotic-antimycotic solution (100×) and trypsin solution were obtained from the GIBCO-BRL Life Technologies Division of Invitrogen. Fetal bovine serum (FBS) was from Atlanta Biologicals (Norcross, GA). Ultroser G (UG) is a serum replacement from Pall BioSepra (Cergy, France). Ni-NTA resin was from Qiagen. Corning expanded surface roller bottles were obtained from Fisher Scientific, the Hi-Prep 26/60 Sephacryl S-200HR and S-300HR pre-poured columns from Amersham Pharmacia, and Amicon Ultra-4 (30 kDa cutoff) ultrafiltration concentrators from Millipore.
Protein production and purification
The DNA manipulations used to generate Fe2hTF, FeNhTF, FeChTF, LockNhTF, LockChTF and the sTFR have been described in detail previously. 17; 37; 41 Briefly, to produce recombinant hTF, baby hamster kidney (BHK) cells transfected with the pNUT plasmid containing the appropriate cDNA sequence are placed into two to four expanded surface roller bottles. Adherent BHK cells are grown in DMEM-F12 containing 10% FBS. This medium was changed twice at two day intervals, after which DMEM-F12 containing the serum substitute UG (1%) and 1 mM butyric acid (BA) was used instead. UG and BA have both been shown to increase production of recombinant hTF and sTFR from BHK cells. 41 The amount of protein produced was usually determined using a competitive immunoassay.42 The hexa-His tagged recombinant protein from the tissue culture medium is captured by passage over a Ni-NTA column followed by final purification on a gel filtration column (S-200HR for hTF constructs and S-300HR for sTFR). Polyacrylamide gel electrophoresis in the presence of SDS was used to verify the homogeneity of the all of the recombinant hTFs which were brought to a nominal concentration of 15 mg/mL. An accurate absorption coefficient for each construct was determined by a recently reported modified Edelhoch method. 43
Complexes of hTF/sTFR are prepared by combining sTFR with a small molar excess of hTF (Fe2hTF, FeNhTF, FeChTF, LockNhTF and LockChTF) and isolated by passage over an S-300HR column. 17 Complexes were adjusted to a nominal concentration of 15 mg/mL with respect to hTF.
Iron release kinetics
The kinetics of iron release from all of the hTF constructs, in the absence and presence of the sTFR, were monitored at pH 5.6 and 25°C on an Applied Photophysics SX18.MV stopped-flow spectrofluorimeter 17. One syringe contained protein (375 nM) in 300 mM KCl and the other syringe contained 200 mM MES buffer, pH 5.6, 300 mM KCl and 8 mM EDTA (our “standard” conditions). Samples were excited at 280 nm and the fluorescence emission was monitored using a high-pass 320 nm cut-on filter. For KCl titrations, one syringe contained protein in either: 50, 150, 300 or 600 mM KCl, the other contained 200 mM MES buffer, pH 5.6, 8 mM EDTA and an equivalent concentration of KCl. Rate constants were determined by fitting the change in fluorescence intensity-versus-time to the appropriate model using Origin software (version 7.5). The equations used to fit the data are provided in the Results & Discussion and in the Supplemental Data which also contains their complete derivation and program code for Origin. These equations provide more precise and accurate rate constants than the exponential equations used in our previous work. 26; 27; 44 Nevertheless the rate constants that were previously reported are within the standard deviation of the current values. All iron release curves shown in Fig. 1 are an average of at least 4 (with a maximum of 32) separate experiments performed on different days and have all been normalized to a fluorescence intensity of 1.0 at the end of the iron release reaction. Reported rate constants are averages from curve fitting of data obtained on multiple days with two or more protein preparations. Direct measurement of the kinetics of iron release using the stopped-flow absorbance spectrophotometry at ∼ 465 nm is difficult because of the low intensity of the band and the limited solubility of the receptor.26 Therefore, assignment of rate constants to iron release events (as opposed to conformational changes) was accomplished by comparing rate constants among the different constructs. The rate constants for iron removal from a given lobe are expected to be very similar across constructs and hence readily identified. That proved to be the case as shown by the rate constant assignments in Table S1.
Supplementary Material
Acknowledgments
This work was supported by USPHS grant R01-DK-21739 from the National Institute of Diabetes, and Digestive and Kidney Diseases (ABM), grant R01-GM-20194 from the National Institute of General Medical Sciences (NDC). Support for SLB and ANS came from Hemostasis and Thrombosis Training Grant 5T32HL007594, issued to Dr. Kenneth G Mann at The University of Vermont by the National Heart, Lung and Blood Institute. We thank Dr. Nicholas G James for technical assistance with some of the stopped flow experiments and Dr. Stephen J Everse for his help with preparation of some of the Figs.
Abbreviations
- TF
serum transferrin
- hTF
human serum transferrin
- apohTF
transferrin lacking iron
- Fe2hTF
recombinant diferric hTF that contains an N-terminal hexa-His tag and is non-glycosylated
- FeChTF
recombinant monoferric C-lobe hTF (mutations Y95F and Y188F preclude iron binding in the N-lobe) that contains an N-terminal hexa-His tag and is non-glycosylated
- FeNhTF
recombinant monoferric N-lobe hTF (mutations Y426F and Y517F preclude iron binding in the C-lobe) that contains an N-terminal hexa-His tag and is non-glycosylated
- LockChTF (mutation R632A locks iron in the C-lobe)
recombinant diferric hTF that contains an N-terminal hexa-His tag and is non-glycosylated
- LockNhTF (mutation K206E locks iron in the N-lobe)
recombinant diferric hTF that contains an N-terminal hexa-His tag and is non-glycosylated
- TFR
transferrin receptor
- sTFR
soluble portion of the transferrin receptor (residues 121-760) expressed as a recombinant entity that contains an N-terminal hexa-His tag
- DMEM-F12
Dulbecco's modified Eagle's medium containing Ham F-12 nutrient mixture
- BHK
baby hamster kidney cells
- UG
Ultroser G, a serum substitute
- BA
butyric acid
- FBS
fetal bovine serum
Footnotes
Publisher's Disclaimer: This is a PDF file of an unedited manuscript that has been accepted for publication. As a service to our customers we are providing this early version of the manuscript. The manuscript will undergo copyediting, typesetting, and review of the resulting proof before it is published in its final citable form. Please note that during the production process errors may be discovered which could affect the content, and all legal disclaimers that apply to the journal pertain.
References
- 1.Hall DR, Hadden JM, Leonard GA, Bailey S, Neu M, Winn M, Lindley PF. The crystal and molecular structures of diferric porcine and rabbit serum transferrins at resolutions of 2.15 and 2.60 Å, respectively. Acta Crystallogr D Biol Crystallogr. 2002;58:70–80. doi: 10.1107/s0907444901017309. [DOI] [PubMed] [Google Scholar]
- 2.Wally J, Halbrooks PJ, Vonrhein C, Rould MA, Everse SJ, Mason AB, Buchanan SK. The crystal structure of iron-free human serum transferrin provides insight into inter-lobe communication and receptor binding. J Biol Chem. 2006;281:24934–44. doi: 10.1074/jbc.M604592200. [DOI] [PMC free article] [PubMed] [Google Scholar]
- 3.Mason AB, Halbrooks PJ, James NG, Connolly SA, Larouche JR, Smith VC, MacGillivray RT, Chasteen ND. Mutational analysis of C-lobe ligands of human serum transferrin: insights into the mechanism of iron release. Biochemistry. 2005;44:8013–21. doi: 10.1021/bi050015f. [DOI] [PubMed] [Google Scholar]
- 4.Dautry-Varsat A, Ciechanover A, Lodish HF. pH and the recycling of transferrin during receptor-mediated endocytosis. Proc Natl Acad Sci U S A. 1983;80:2258–62. doi: 10.1073/pnas.80.8.2258. [DOI] [PMC free article] [PubMed] [Google Scholar]
- 5.Klausner RD, Van Renswoude J, Ashwell G, Kempf C, Schechter AN, Dean A, Bridges KR. Receptor-mediated endocytosis of transferrin in K562 cells. J Biol Chem. 1983;258:4715–24. [PubMed] [Google Scholar]
- 6.Aisen P, Enns C, Wessling-Resnick M. Chemistry and biology of eukaryotic iron metabolism. Int J Biochem Cell Biol. 2001;33:940–59. doi: 10.1016/s1357-2725(01)00063-2. [DOI] [PubMed] [Google Scholar]
- 7.Ohgami RS, Campagna DR, Greer EL, Antiochos B, McDonald A, Chen J, Sharp JJ, Fujiwara Y, Barker JE, Fleming MD. Identification of a ferrireductase required for efficient transferrin-dependent iron uptake in erythroid cells. Nat Genet. 2005;37:1264–9. doi: 10.1038/ng1658. [DOI] [PMC free article] [PubMed] [Google Scholar]
- 8.Dhungana S, Taboy CH, Zak O, Larvie M, Crumbliss AL, Aisen P. Redox properties of human transferrin bound to its receptor. Biochemistry. 2004;43:205–9. doi: 10.1021/bi0353631. [DOI] [PubMed] [Google Scholar]
- 9.Sendamarai AK, Ohgami RS, Fleming MD, Lawrence CM. Structure of the membrane proximal oxidoreductase domain of human Steap3, the dominant ferrireductase of the erythroid transferrin cycle. Proc Natl Acad Sci U S A. 2008;105:7410–7415. doi: 10.1073/pnas.0801318105. [DOI] [PMC free article] [PubMed] [Google Scholar]
- 10.Anderson BF, Baker HM, Dodson EJ, Norris GE, Rumball SV, Waters JM, Baker EN. Structure of human lactoferrin at 3.2-Å resolution. Proc Natl Acad Sci U S A. 1987;84:1769–73. doi: 10.1073/pnas.84.7.1769. [DOI] [PMC free article] [PubMed] [Google Scholar]
- 11.Baker HM, Anderson BF, Brodie AM, Shongwe MS, Smith CA, Baker EN. Anion binding by transferrins: importance of second-shell effects revealed by the crystal structure of oxalate-substituted diferric lactoferrin. Biochemistry. 1996;35:9007–13. doi: 10.1021/bi960288y. [DOI] [PubMed] [Google Scholar]
- 12.MacGillivray RT, Moore SA, Chen J, Anderson BF, Baker H, Luo Y, Bewley M, Smith CA, Murphy ME, Wang Y, Mason AB, Woodworth RC, Brayer GD, Baker EN. Two high-resolution crystal structures of the recombinant N-lobe of human transferrin reveal a structural change implicated in iron release. Biochemistry. 1998;37:7919–28. doi: 10.1021/bi980355j. [DOI] [PubMed] [Google Scholar]
- 13.Jeffrey PD, Bewley MC, MacGillivray RT, Mason AB, Woodworth RC, Baker EN. Ligand-induced conformational change in transferrins: crystal structure of the open form of the N-terminal half-molecule of human transferrin. Biochemistry. 1998;37:13978–86. doi: 10.1021/bi9812064. [DOI] [PubMed] [Google Scholar]
- 14.Dewan JC, Mikami B, Hirose M, Sacchettini JC. Structural evidence for a pH-sensitive dilysine trigger in the hen ovotransferrin N-lobe: implications for transferrin iron release. Biochemistry. 1993;32:11963–8. doi: 10.1021/bi00096a004. [DOI] [PubMed] [Google Scholar]
- 15.Halbrooks PJ, He QY, Briggs SK, Everse SJ, Smith VC, MacGillivray RT, Mason AB. Investigation of the mechanism of iron release from the C-lobe of human serum transferrin: mutational analysis of the role of a pH sensitive triad. Biochemistry. 2003;42:3701–7. doi: 10.1021/bi027071q. [DOI] [PubMed] [Google Scholar]
- 16.Halbrooks PJ, Giannetti AM, Klein JS, Bjorkman PJ, Larouche JR, Smith VC, MacGillivray RT, Everse SJ, Mason AB. Composition of pH-sensitive triad in C-lobe of human serum transferrin. Comparison to sequences of ovotransferrin and lactoferrin provides insight into functional differences in iron release. Biochemistry. 2005;44:15451–60. doi: 10.1021/bi0518693. [DOI] [PubMed] [Google Scholar]
- 17.Byrne SL, Leverence R, Klein JS, Giannetti AM, Smith VC, MacGillivray RT, Kaltashov IA, Mason AB. Effect of glycosylation on the function of a soluble, recombinant form of the transferrin receptor. Biochemistry. 2006;45:6663–73. doi: 10.1021/bi0600695. [DOI] [PubMed] [Google Scholar]
- 18.Kretchmar SA, Raymond KN. Effects of ionic strength on iron removal from the monoferric transferrins. Inorg Chem. 1988;27:1436–1441. [Google Scholar]
- 19.Marques HM, Watson DL, Egan TJ. Kinetics of iron removal from human serum monoferric transferrins by citrate. Inorg Chem. 1991;30:3758–3762. [Google Scholar]
- 20.Harris WR. Thermodynamics of anion binding to human serum transferrin. Biochemistry. 1985;24:7412–8. doi: 10.1021/bi00346a057. [DOI] [PubMed] [Google Scholar]
- 21.He QY, Mason AB. Molecular Aspects of Release of Iron from Transferrin. In: Templeton DM, editor. Molecular and Cellular Iron Transport. Marcel Dekker, Inc; Toronto: 2002. [Google Scholar]
- 22.Lehrer SS. Fluorescence and absorption studies of the binding of copper and iron to transferrin. J Biol Chem. 1969;244:3613–7. [PubMed] [Google Scholar]
- 23.Gaber BP, Miskowski V, Spiro TG. Resonance Raman scattering from iron(3)- and copper(II)-transferrin and an iron(III) model compound. A spectroscopic interpretation of the transferrin binding site. J Am Chem Soc. 1974;96:6868–73. doi: 10.1021/ja00829a010. [DOI] [PubMed] [Google Scholar]
- 24.Chen Y, Barkley MD. Toward understanding tryptophan fluorescence in proteins. Biochemistry. 1998;37:9976–82. doi: 10.1021/bi980274n. [DOI] [PubMed] [Google Scholar]
- 25.Vivian JT, Callis PR. Mechanisms of tryptophan fluorescence shifts in proteins. Biophys J. 2001;80:2093–109. doi: 10.1016/S0006-3495(01)76183-8. [DOI] [PMC free article] [PubMed] [Google Scholar]
- 26.James NG, Berger CL, Byrne SL, Smith VC, Macgillivray RT, Mason AB. Intrinsic Fluorescence Reports a Global Conformational Change in the N-Lobe of Human Serum Transferrin following Iron Release. Biochemistry. 2007;46:10603–10611. doi: 10.1021/bi602425c. [DOI] [PubMed] [Google Scholar]
- 27.James NG, Byrne SL, Steere AN, Smith VC, MacGillivray RTA, Mason AB. Inequivalent contribution of the five tryptophan residues in the C-lobe of human serum transferrin to the fluorescence increase when iron is released. Biochemistry. 2009;48:2858–2867. doi: 10.1021/bi8022834. [DOI] [PMC free article] [PubMed] [Google Scholar]
- 28.James NG, Byrne SL, Mason AB. Incorporation of 5-hydroxytryptophan into transferrin and its receptor allows assignment of the pH induced changes in intrinsic fluorescence when iron is released. Biochim Biophys Acta. 2009;1794:532–40. doi: 10.1016/j.bbapap.2008.11.017. [DOI] [PMC free article] [PubMed] [Google Scholar]
- 29.Bali PK, Zak O, Aisen P. A new role for the transferrin receptor in the release of iron from transferrin. Biochemistry. 1991;30:324–8. doi: 10.1021/bi00216a003. [DOI] [PubMed] [Google Scholar]
- 30.Bali PK, Aisen P. Receptor-modulated iron release from transferrin: differential effects on N- and C-terminal sites. Biochemistry. 1991;30:9947–52. doi: 10.1021/bi00105a019. [DOI] [PubMed] [Google Scholar]
- 31.Bali PK, Aisen P. Receptor-induced switch in site-site cooperativity during iron release by transferrin. Biochemistry. 1992;31:3963–7. doi: 10.1021/bi00131a011. [DOI] [PubMed] [Google Scholar]
- 32.Egan TJ, Zak O, Aisen P. The anion requirement for iron release from transferrin is preserved in the receptor-transferrin complex. Biochemistry. 1993;32:8162–7. doi: 10.1021/bi00083a016. [DOI] [PubMed] [Google Scholar]
- 33.el Hage Chahine JM, Pakdaman R. Transferrin, a mechanism for iron release. Eur J Biochem. 1995;230:1102–110. doi: 10.1111/j.1432-1033.1995.tb20661.x. [DOI] [PubMed] [Google Scholar]
- 34.Hemadi M, Ha-Duong NT, El Hage Chahine JM. The mechanism of iron release from the transferrin-receptor 1 adduct. J Mol Biol. 2006;358:1125–36. doi: 10.1016/j.jmb.2006.02.055. [DOI] [PubMed] [Google Scholar]
- 35.Harris WR, Bali PK, Crowley MM. Kinetics of iron removal from monoferric and cobalt-labeled monoferric transferrins by diethylenetriaminepenta(methylenephosphonic acid) and diethylenetriaminepentaacetic acid. Inorg Chem. 1992;31:2700–2705. [Google Scholar]
- 36.Mason AB, Everse SJ. Iron Transport by Transferrin. In: Fuchs H, editor. Iron Metabolism and Disease. Research Signpost; Kerala, India: 2008. [Google Scholar]
- 37.Byrne SL, Mason AB. Human serum transferrin: a tale of two lobes. Urea gel and steady state fluorescence analysis of recombinant transferrins as a function of pH, time, and the soluble portion of the transferrin receptor. J Biol Inorg Chem. 2009;14:771–81. doi: 10.1007/s00775-009-0491-y. [DOI] [PMC free article] [PubMed] [Google Scholar]
- 38.Mason AB, Tam BM, Woodworth RC, Oliver RW, Green BN, Lin LN, Brandts JF, Savage KJ, Lineback JA, MacGillivray RT. Receptor recognition sites reside in both lobes of human serum transferrin. Biochem J. 1997;326(Pt 1):77–85. doi: 10.1042/bj3260077. [DOI] [PMC free article] [PubMed] [Google Scholar]
- 39.Zak O, Trinder D, Aisen P. Primary receptor-recognition site of human transferrin is in the C-terminal lobe. J Biol Chem. 1994;269:7110–4. [PubMed] [Google Scholar]
- 40.Giannetti AM, Snow PM, Zak O, Bjorkman PJ. Mechanism for multiple ligand recognition by the human transferrin receptor. PLoS Biol. 2003;1:E51. doi: 10.1371/journal.pbio.0000051. [DOI] [PMC free article] [PubMed] [Google Scholar]
- 41.Mason AB, Halbrooks PJ, Larouche JR, Briggs SK, Moffett ML, Ramsey JE, Connolly SA, Smith VC, MacGillivray RT. Expression, purification, and characterization of authentic monoferric and apo-human serum transferrins. Protein Expr Purif. 2004;36:318–26. doi: 10.1016/j.pep.2004.04.013. [DOI] [PubMed] [Google Scholar]
- 42.Mason AB, He QY, Adams TE, Gumerov DR, Kaltashov IA, Nguyen V, MacGillivray RT. Expression, purification, and characterization of recombinant nonglycosylated human serum transferrin containing a C-terminal hexahistidine tag. Protein Expr Purif. 2001;23:142–50. doi: 10.1006/prep.2001.1480. [DOI] [PubMed] [Google Scholar]
- 43.James NG, Mason AB. Protocol to determine accurate absorption coefficients for iron-containing transferrins. Anal Biochem. 2008;378:202–7. doi: 10.1016/j.ab.2008.04.012. [DOI] [PMC free article] [PubMed] [Google Scholar]
- 44.Mason AB, Halbrooks PJ, James NG, Byrne SL, Grady JK, Chasteen ND, Bobst CE, Kaltashov IA, Smith VC, MacGillivray RT, Everse SJ. Structural and functional consequences of the substitution of glycine 65 with arginine in the N-lobe of human transferrin. Biochemistry. 2009;48:1945–53. doi: 10.1021/bi802254x. [DOI] [PMC free article] [PubMed] [Google Scholar]
Associated Data
This section collects any data citations, data availability statements, or supplementary materials included in this article.