Abstract
First described as a cell cycle activator, RGC-32 is both an activator and a substrate for CDC2. Deregulation of RGC-32 expression has been detected in a wide variety of human cancers. We have now shown that RGC-32 is expressed in precancerous states, and its expression is significantly higher in adenomas than in normal colon tissue. The expression of RGC-32 was higher in advanced stages of colon cancer than in precancerous states or the initial stages of colon cancer. In order to identify the genes that are regulated by RGC-32, we used gene array analysis to investigate the effect of RGC-32 knockdown on gene expression in the SW480 colon cancer cell line. Of the 230 genes that were differentially regulated after RGC-32 knockdown, a group of genes involved in chromatin assembly were the most significantly regulated in these cells: RGC-32 knockdown induced an increase in acetylation of histones H2B lysine 5 (H2BK5), H2BK15, H3K9, H3K18, and H4K8. RGC-32 silencing was also associated with decreased expression of SIRT1 and decreased trimethylation of histone H3K27 (H3K27me3). In addition, RGC-32 knockdown caused a significantly higher percentage of SW480 cells to enter S phase, and subsequently G2/M. These data suggest that RGC-32 may contribute to the development of colon cancer by regulating chromatin assembly.
Keywords: RGC-32, colon cancer, gene array, histone, acetylation, methylation
INTRODUCTION
Colorectal cancer is one of the most common malignancies in Western countries. Numerous alterations of cell cycle regulators have already been documented in colon cancer, as well as many other types of cancer. The genes encoding CDK1, CDK2 cyclin D2, and cyclin E genes are all known to be amplified in colorectal cancers (Bondi et al., 2005; Massague, 2004; Salh et al., 1999), and overexpression of cyclin D1 and cyclin A in colorectal cancer is correlated with poor differentiation as well as tumor progression (Bahnassy et al., 2004). Previous studies have demonstrated that the loss of expression of p16 cell cycle inhibitor in the nucleus is part of the evolution of adenoma to colorectal carcinoma. In addition, cytoplasmic overexpression of CDK4 and p16 may represent early markers of transformation in colorectal carcinoma (Zhao et al., 2006). A low level or lack of p27 (CIP/KIP family) expression has also been observed in colorectal cancer, and downregulation of p27 has been shown to be strongly associated with aggressive tumor biology and a poor prognosis (Hershko and Shapira, 2006).
First cloned by differential display, Response Gene to Complement-32 (RGC-32) was subsequently identified as one of the genes that is induced by complement activation (Badea et al., 1998) (Badea et al., 2002). Overexpression of RGC-32 is associated with accelerated entry of smooth muscle cells into S phase, with RGC-32 acting as an activator and substrate for CDC2 (Badea et al., 2002). In addition to being induced by the terminal complement complex C5b-9, RGC-32 expression is also regulated by growth factors, glucocorticoids, luteinizing hormone, human chorionic gonadotropin, progesterone, estradiol, and cytokines (Vlaicu et al., 2008). Transforming growth factor β induces RGC-32 through Smad and RhoA signaling, thus initiating smooth muscle cell differentiation (Huang et al., 2009). Recent studies have also revealed novel functions for RGC-32 in diverse processes such as immune system regulation, scar development, and wound healing (Vlaicu et al., 2008).
Deregulation of RGC-32 expression has been detected in a large variety of human cancers. It is up-regulated in colon (Fosbrink et al., 2005), ovarian (Donninger et al., 2004), and breast (Kang et al., 2003) cancer and down-regulated in multiple myeloma (Zhan et al., 2006), drug-resistant glioblastoma (Bredel et al., 2006), and high-grade astrocytomas (Saigusa et al., 2007). Given its frequent loss in aggressive gliomas, the same authors proposed that the RGC-32 give may be involved in the pathogenesis of gliomas, being inactivated by genetic aberrations and/or transcriptional dysregulation (Saigusa et al., 2007).
In order to investigate the role of RGC-32 in carcinogenesis, we have now examined the expression of RGC-32 in normal colonic mucosa, precancerous states, and colon adenocarcinoma and have found an increased expression in adenocarcinomas and adenomas when compared with normal colonic mucosa. Using gene array analyses, we identified 230 genes that were differentially regulated in SW480 cells in which RGC-32 expression had been silenced. The Gene Ontology analysis revealed that genes involved in chromatin assembly, cell cycle, and RNA processing were significantly over-represented among the differentially expressed genes. Our results also demonstrate that knockdown of RGC-32 is associated with an increase in lysine acetylation at multiple sites on histones H2B, H3 and H4; in addition, we found that expression of the histone deacetylase SIRT1 and trimethylation of H3K27 were reduced. These results strongly suggest that silencing of RGC-32 induces the transcriptional activation of a significant number of genes and is associated with chromatin remodeling and activation of the cell cycle, all of which may contribute to the development of colon cancer.
MATERIALS AND METHODS
Immunohistochemical staining of RGC-32
Indirect immunoperoxidase staining for RGC-32 was performed on Colorectal Carcinoma Progression Tissue Microarray slides (from the Cooperative Human Tissue Network [CHTN], Charlottesville, VA), the Colon Cancer Tissue Microarray (CO701t) (US Biomax Inc, Rockville, MD), and samples obtained during colonoscopy at the University of Medicine and Pharmacy, Medical Clinic no. 1, Cluj-Napoca, Romania. Colorectal Carcinoma Progression Tissue Microarray slides contain sections from 5 samples of normal mucosa, 7 samples of normal mucosa from colons resected for colorectal adenocarcinoma, 6 cases of ulcerative colitis, 7 cases of colorectal adenomatous polyps (maximal dimension, <2 cm), 7 cases of colorectal adenomatous polyps (maximal dimension, >2 cm), 14 cases of primary adenocarcinomas, 7 cases of colorectal adenocarcinoma with metastasis to regional lymph nodes, and 7 cases of colorectal adenocarcinoma with metastasis to distant organs. The CO701t colon cancer tissue array comprised 49 colon cancer cores, grade 2–4, and 6 normal tissue cores. Samples from 4 cases of normal mucosa, 10 cases of adenomatous polyps, 7 cases of inflammatory bowel disease (ulcerative colitis and Crohn’s disease) and 6 cases of stage T1/T2 colorectal cancer were obtained during colonoscopy at Medical Clinic no. 1, Cluj-Napoca, with written consent being obtained from all patients.
The expression of RGC-32 protein was examined by indirect immunoperoxidase staining as previously described (Fosbrink et al., 2005). In brief, paraffin sections were deparaffinized and washed in PBS, and endogenous peroxidase was quenched with 3% H2O2. For antigen retrieval, the deparaffinized slides were placed in Dako Target Retrieval Solution (Dako, Carpinteria, CA) and boiled for 30 min. Slides were incubated for 2 h at room temperature with rabbit IgG anti-RGC-32 diluted 1:100 in PBS, then washed three times in PBS and incubated for 1 h at room temperature with secondary HRP-conjugated AffiniPure goat anti-rabbit IgG (Jackson ImmunoResearch Labs, West Grove, PA) diluted 1:250 in PBS Tween 0.1%. After several PBS rinses, the bound antibody was detected using Nova RED (Vector Labs, Burlingame, CA), and the slides were subsequently counterstained with Harris hematoxylin (Sigma, St Louis, MO) and mounted using VectaMount AQ (Vector Labs).
The staining intensity of the RGC-32 deposits was evaluated independently by two pathologists in a blinded fashion. The intensity of staining was graded as follows: negative (−), slightly positive (+), positive (++), or highly positive (+++).
Preparation of the shRNA RGC-32 plasmid vector and transfection of SW480 cells
The siRNA search engine available through Dharmacon (www.dharmacon.com) was used to select and rank the predicted RGC-32 siRNA sequences according to their degree of specificity. The following siRGC-32 sequence was chosen for synthesis by Dharmacon Inc., (Chicago IL): 5′ – AAGTGCAGATTCACTTTATAG–3′. The RNAi-Ready pSIREN-Shuttle vector was purchased from BD Biosciences Clontech (Mountain View, CA). The target RGC-32 sequence was cloned downstream of a PolIII promoter (U6) in the plasmid expression vector. The annealed oligonucleotides were ligated into the pSIREN-Shuttle vector, and shRGC-32 was generated according to the manufacturer’s instructions. As a control, we used shRNA for luciferase (shCTR), synthesized by Clontech.
The SW480 cell line was obtained from the American Type Culture Collection (Manassas, VA). Cells were maintained in Dulbecco’s modified Eagle’s medium (DMEM) supplemented with 10% fetal bovine serum (FBS), 1% penicillin, and 1% streptomycin at 37° C in 5% CO2. Equal numbers of SW480 cells (1.5×10⁵ cells) were plated and transfected with the shRNA RGC-32 and shCTR expression plasmids (3.25 μg) respectively, using Lipofectamine 2000 (InVitrogen, Carlsbad, CA) for 18 h according to the manufacturer’s instructions. The cells were then incubated at 37°C, 5% CO2 for a further 24 h in DMEM with 10% FBS.
Real-time PCR
Total RNA obtained at 48 h after transfection was purified using the RNeasy Mini Kit (Qiagen, Santa Clarita, CA) according to the manufacturer’s instructions. 0.5–2.0 μg of RNA was mixed with RT-buffer, dNTP, and oligo-dT primer (Invitrogen). RNA was denatured by incubation at 65° C for 5 min. Reverse transcriptase enzyme (Promega) and RNase inhibitor (Invitrogen) were then added, and the reaction mixture was incubated at 37°C for 1 h. The reaction was terminated by incubation at 95°C for 5 min.
Real-time PCR for WEE1 was performed according to the manufacturer’s protocol using a LightCycler FastStart DNA MasterHybProbe (Roche) and the Real-Time Light Cycler 2.0 System (Roche Biochemicals, Indianapolis, IN). Forward and reverse primers and hybridization probe sequences were provided by TIB Mol Biol LLC (Adelphia, NJ) (Table 1). Primers for the other genes, including the housekeeping gene 18S and L13were designed by TIB Mol Biol LLC (Adelphia, NJ) (Table 1) and used in conjunction with LightCycler FastStart DNA Master SYBR Green I (Roche) according to the manufacturer’s protocol. As a negative controls for each real-time PCR assay, the same reaction was performed in the absence of cDNA or reverse transcriptase. For each gene (performed in duplicate for each sample), the cycle threshold (CT) values were determined in the exponential phase of the amplification plot and normalized by subtraction of the CT value for 18S (generating a ΔCT value). The -fold change in target gene samples, after normalization with the housekeeping gene (18S), was calculated using the 2 −ΔΔCT value, where ΔΔCT= = ΔCT (sample) − ΔCT (control) and ΔCT is the CT value of target gene normalized to the CT value of the housekeeping gene (Cudrici et al., 2008).
Table 1.
Primers and hybridization probes used for Real-Time PCR.
| Gene symbol | Primers sequence | Product (bp) |
|---|---|---|
| CDH1 | For: 5′-CAATCTCAAGCTCATGGATAACC-3′ | 187 |
| Rev: 5′-GAGCAGCAGAATCAGAATTAGC-3′ | ||
| HIST1H2BD | For: 5′-ACTTTGCCAAGGGAGAGACA-3′ | 104 |
| Rev: 5′-TTTCAGGCAGATGAGACTTCC-3′ | ||
| p21 | For: 5′-GAAGACCATGTGGTCCTGTCAC -3′ | 172 |
| Rev: 5′-AGGGCTTCCTCTTGGAGAAGAT -3′ | ||
| p53 | For: 5′-GTCCCAAGCAATGGATGATT-3′ | 104 |
| Rev: 5′-GAGCAGCCTCTGGCATTCT-3′ | ||
| RGC-32 | For: 5′-AGGAACAGCTTCAGCTTCAGT-3′ | 152 |
| Rev: 5′-GCTAAAGTTTTGTCAAGATCAGCA-3′ | ||
| WEE1 | For: 5′-TGCTGGTGCTGAACCTCT-3′ | 282 |
| Rev: 5′-GCCATCTGTGCTTTCTTGAG-3′ | ||
| Hyb 1:GCAACTCTGTAAATTCTTGGGAAAGCAC-FL | ||
| Hyb 2:LC640-GTGGTATCCGAGGTAATCTACCCTGTCTG-PH | ||
| L13 | For: 5′-CGTGCGTCTGAAGCCTACA-3′ | 227 |
| Rev: 5′-GGAGTCCGTGGGTCTTGAG-3′ | ||
| β-catenin | For: 5′-ACAGGAAGGGATGGAAGGT -3′ | 171 |
| Rev: 5′-ACAGTACGCACAAGAGCCTC -3′ | ||
| 18S | For: 5′-GTAACCCGTTGAACCCCATT-3′ | 151 |
| Rev: 5′-CCATCCAATCGGTAGTAGCG-3′ |
For, forward primer; Rev, reverse primer; Hyb 1, Hyb 2, hybridization probes; Bp, base pairs; CDH1, Cadherin 1, type 1, E-cadherin; HIST1H2BD, H2B histone family, member B; p53, tumor protein p53; p21, cyclin-dependent kinase inhibitor 1A; RGC-32, response gene to complement 32; WEE1, WEE1 homolog; 18S, 18S ribosomal RNA. RAD51AP1 (RAD51 associated protein 1) expression was assessed using SABiosciences RT qPCR Primers, reference positions 991–1009, catalog number PPH08542A
TissueScan Tissue qPCR array analysis for colon cancer
A cDNA panel for profiling gene expression in colon cancer was obtained from Origene Technologies, Inc (Rockville, MD). This panel contained cDNA prepared from colon cancer samples provided on a real-time PCR plate and included: 5 normal colon samples, 6 samples from stage I, 17 samples from stage II, 14 samples from stage III and 5 samples with stage IV colon cancer. To determine RGC-32 and L13 mRNA levels, real-time quantitative PCR (RT-PCR) was performed as described above using the ABI StepOne System (Applied Biosystems, Foster City, CA). The primers used to detect RGC-32 and L13 expression are presented in Table 1. A standard curve was generated by serial diluting standard dilutions of RGC-32 and the L13 ribosomal protein. The normalized mRNA value (NRV) was calculated according to the following formula for the relative expression of target mRNA: NRV = (RGC-32-S/RGC-32-C)/(L13-S/L13-C), where RGC-S and RGC-C represent levels of mRNA expression for the target gene in the sample and control mRNAs, respectively, and L13-S and L13-C correspond to amplified L13 ribosomal protein levels in the sample and control mRNAs, respectively.
Oligonucleotide expression arrays
Total RNA was purified using Trizol extraction (Invitrogen) and then cleaned using the RNeasy Mini Kit (Qiagen, Santa Clarita, CA) according to the manufacturer’s instructions. The experiment was performed in triplicates and samples were pooled before RNA purification. Oligonucleotide expression-array analysis was performed using an OHU16K Human 16K 70-mer oligonucleotide cancer array. The OHU16k microarray comprises 16,766 genes and was printed at the Yale University Keck Microarray Center (New Haven, CT). Optimization of each oligonucleotide to minimize cross-hybridization in microarray experiments was performed using BLAST for nucleotide sequence. The quality of the total RNA preparation was assessed by determining the A260/A280 ratio by electrophoresis on an Agilent Bioanalyzer (Agilent, Foster City, CA). Two μg of total RNA was provided to the W. M. Keck Microarray Center, Yale University (New Haven, Connecticut, USA), where the cRNA labeling, hybridization, and data analysis were performed. The control RNA was labeled with Cy-Dye 3 (Cy3) and the shRNA-treated RNA with Cy-Dye 5 (Cy5). The Cy5- and Cy3-labeled probes were hybridized, and the fluorescence intensities of each spot were quantified. The raw data obtained from the scanned array images were analyzed with an Axon GenePix 4100A scanner. Axon GenePix Pro 5.0 software was used to detect the spots automatically. The Cy3 and Cy5 fluorescence intensities of each spot were measured were analyzed with Greenspring 7.3.1 software (Silicon Genetics, Redwood City, CA). The results were subjected to locally weighted scatterplot smoother (LOWESS) normalization, and the ratios of Cy5 to Cy3 fluorescence were determined for each gene. To determine the biological processes in which the genes significantly over-expressed are involved, the online version of Gene Ontology (available at http://david.abcc.ncifcrf.gov) was used as previously described (Cudrici et al., 2008).
Western blotting
SW480 cells were homogenized on ice in RIPA lysis buffer (10 mM Tris, pH 7.4, with 1 mM EDTA, 1 mM EGTA, 1mM NaF, 20 mM Na4P2O7, 1% Triton X-100, 0.1 % SDS, 100 mM NaCl, 10% glycerol, 0.5% sodium deoxycholate, and 2 mM Na3VO4). One tablet of complete Mini Protease Inhibitor Mixture (Roche Applied Science, Indianapolis, IN) was added just prior to use. Lysates were placed on ice for 30 min, and protein concentrations were determined using a BCA protein assay kit (Pierce, Rockford, IL). Lysates (30 μg of protein) were fractionated on 12% SDS-polyacrylamide gels and transferred to nitrocellulose membranes (Millipore, Bedford, MA) as previously described (Fosbrink et al., 2005). The membranes were blocked with 0.1%Tween-TBS containing 1% bovine serum albumin (BSA) for 1 h and incubated with primary antibody overnight at 4°C. Goat anti-rabbit or rabbit anti-goat IgG HRP-conjugated antibodies (Santa Cruz Biotech) were applied for 1 h at room temperature. After washing, reactions were developed using enhanced chemiluminescence (Pierce). The following primary antibodies were obtained from Epitomics (Burlingame, CA): rabbit monoclonals IgG anti-histone H2B, H3, histone H2B acetyl K15 (H2BK15ac), histone H3 acetyl K18 (H3K18ac) and to histone deacetylase (HDAC) 2. Rabbit IgG anti- H4, H2B acetyl K5 (H2BK5ac) and H3 acetyl K9 (H3K9ac), H4 acetyl K8 (H4K8ac), H2A acetyl K9 (H2AK9ac) and anti-HDAC3 were from Cell Signaling (Danvers, MA). Mouse monoclonal anti-SIRT1, rabbit IgG anti-H3 dimetyl K9 (H3K9me2) and mouse monoclonal anti – H3K27me3 were from Active Motif (Carlsbad, CA). Membranes were stripped using Restore Western Blot Stripping Buffer (Pierce) and reprobed for the expression of β-actin (Rockland Immunochemicals, Rockville, MD). The radiographic band density was measured using UN-SCAN-IT software (Silk Scientific, Orem, UT), and the results were expressed as density ratios relative to β-actin.
5-Bromo-2′-deoxyurydine (BRDU) incorporation assays
BrdU incorporation was assessed using the BrdU Flow Kit (BD Biosciences PharMingen San Diego, CA) as previously described (Badea et al., 2002). After transfection, SW480 cells were synchronized by starvation for 18 h followed by an 18 h stimulation with 10% FBS-enriched medium. They were then pulse-labeled with 10 μM BrdU for 1 h and harvested by trypsinization, then permeabilized with Cytofix/Cytoperm buffer provided by the manufacturer (BD Biosciences PharMingen, San Diego, CA). BrdU and DNA were stained with fluorescein isothiocyanate-labeled anti-BrdU and 7-aminoactinomycin D, respectively, according to the manufacturer’s instructions. Flow cytometric analysis was performed using a Becton-Dickinson flow cytometer and Consort-40 software.
Statistical analysis
The statistical analysis of immunohistochemical staining was performed using Fischer’s exact test (Clarkson, 1993). Statistical analysis of the BrdU incorporation assays was performed using Student t-test.
RESULTS
Expression of RGC-32 in normal colon, colon precancerous states, and colon cancer
a. Quantitative real-time PCR
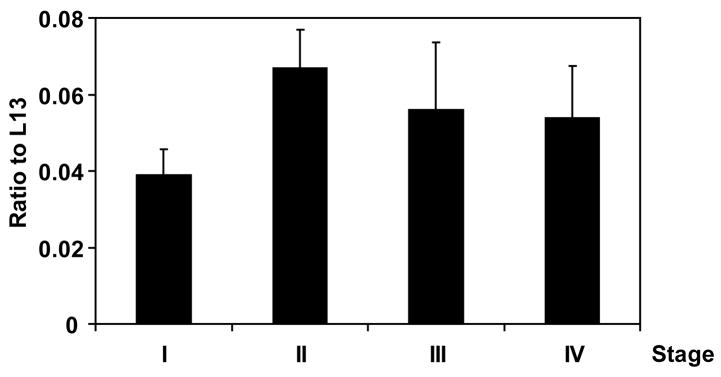
To investigate the expression of RGC-32 in various stages of colon cancer, we used quantitative real-time PCR and a TissueScan colon cancer cDNA panel for disease gene expression (Origene). Our results showed a lower level of RGC-32 expression in stage I cancer than in stages II–IV (Figure 1). Quantitative real-time PCR analysis also revealed that mRNA levels of RGC-32 in stage II were significantly higher than those in stage I colon cancer (p<0.02). However, similar levels of mRNA expression were found in stages III and IV which did not differ significantly from those in stage II adenocarcinoma (Figure 1). These data differ from previous observations on a small number of glioma samples, which indicated that stage III tumors express significantly lower levels of RGC-32 expression than do stage II samples (Saigusa et al., 2007).
Figure 1. RGC-32 mRNA expression in colon adenocarcinoma.
RGC-32 expression was determined by quantitative real-time PCR using a TissueScan qPCR array panel from Origene. The results are presented as a ratio of the value for RGC-32 to the value for the ribosomal protein L13, a housekeeping gene. Quatitative real-time PCR analysis shows that the levels in stage II were significantly higher than those in stage I colon cancer (p<0.02).
b. Immunohistochemical staining
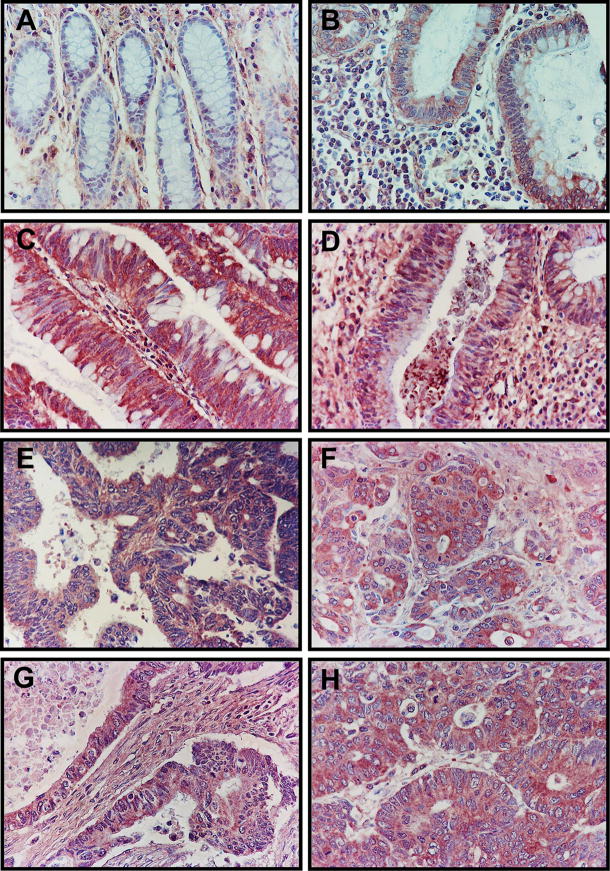
Weak RGC-32 expression was seen in normal colon mucosa and small adenomas (Table 2). The expression of RGC-32 in normal mucosa was mostly confined to the mesenchymal cells in the interstitial space (Figure 2A). We made the interesting observation that only 67% of the normal colonic mucosa samples were positive for RGC-32, whereas 100% of the normal mucosa samples from colons resected from colorectal adenocarcinoma cases were positive (Table 2, Figure 2A). Most of the large adenomas expressed RGC-32 (Figure 2C), and their level of staining was more intense than that of the small adenomas (Figure 2B, Table 2). High-intensity staining was observed in 43% of the large adenomas, as compared to only 11% of the small adenomas (Table 2). Furthermore, staining intensity of RGC-32 in large adenomas was statistically different from the staining intensity found in normal colonic mucosa (p=0.02).
Table 2.
Expression of RGC-32 protein in normal colon, inflamed non neoplastic colon tissue, benign and malignant colon tumors
| Tissue | Staining intensity |
Positive / Total cases | |||
|---|---|---|---|---|---|
| − | + | ++ | +++ | ||
| Normal colonic mucosa | 5 | 10 | 7 | 0 | 17/22 |
| Non cancer cases | 5 | 7 | 3 | 0 | 10/15 |
| Cancer cases | 0 | 3 | 4 | 0 | 7/7 |
| Adenomas | 4 | 8 | 7 | 5 | 20/24 |
| Small | 3 | 6 | 6 | 2 | 14/17 |
| Large | 1 | 2 | 1 | 3 | 6/7 |
| Inflamatory bowel disease - colon mucosa (Ulcerative colitis/ Crohn’s disease) | 1 | 5 | 4 | 3 | 12/13 |
| Colorectal adenocarcinoma | 0 | 10 | 28 | 25 | 63/63 |
| Stage T1/T2 | 0 | 2 | 9 | 3 | 14/14 |
| Stage T3/T4 | 0 | 8 | 19 | 22 | 49/49 |
| Metastatic adenocarcinoma | 0 | 1 | 6 | 7 | 14/14 |
| Local lymph nodes | 0 | 1 | 3 | 3 | 7/7 |
| Distant sites | 0 | 0 | 3 | 4 | 7/7 |
−, negative; +, slightly positive; ++, positive; +++, highly positive;
Figure 2. Immunohistochemical localization of RGC-32 in normal colonic tissue, colon precancerous lesions, and colon adenocarcinoma samples.
(A) Normal non-neoplastic mucosa from non-cancer cases, with mainly interstitial mesenchymal staining. (B) Small adenoma (maximal diameter, <2 cm). (C) Large adenoma (maximal dimension, >2 cm) showing more intensive staining than in the small adenoma. (D) Inflamed non-neoplastic mucosa from an ulcerative colitis patient, with moderate staining of the glands. (E) Primary invasive colon adenocarcinoma, stage T1/T2. (F) Primary invasive colon adenocarcinoma, stage T3/4. (G) Primary invasive colon adenocarcinoma metastatic to the lymph nodes, and (H) primary invasive colon adenocarcinoma metastatic to distant organs, with both (G) and (H) showing a very intense staining pattern.
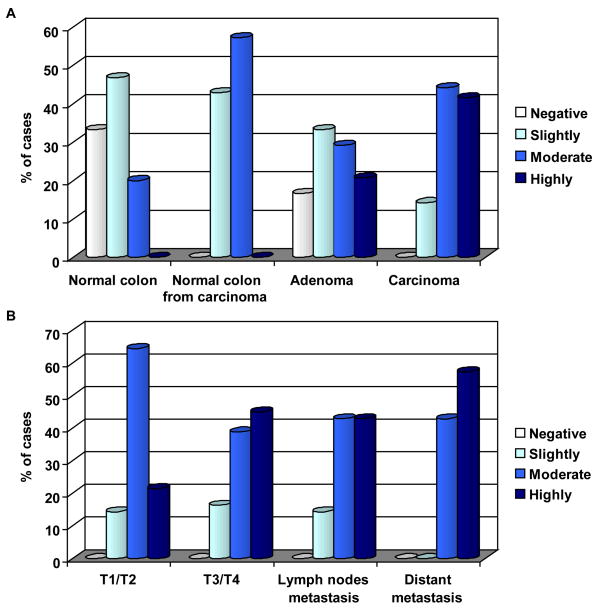
In colon adenocarcinomas, two major patterns of RGC-32 immunoreactivity were seen. In some tumors, staining was seen only in the malignant epithelial cells; in other tumors, RGC-32 reactivity was seen in both the malignant epithelium and in cells in the interstitium (Figure 2E–H). RGC-32 was localized to the cytoplasm in most of the samples examined. Rarely, RGC-32 staining was seen in the nuclei in the case of some patients with colon adenocarcinomas (data not shown). The proportion of RGC-32 positive adenocarcinoma samples was statistically different from adenomas (p=0.002) and from normal colonic mucosa (p=0.0001). The intensity of the RGC-32 staining tended to correlate with the TNM stage of the malignant tumors: 21% of the early-stage colon adenocarcinoma (T1/T2), 45% of the advanced stage adenocarcinoma (T3/T4), 43% of the tumors with lymph node metastasis and 57% of the colon adenocarcinomas with metastases to distant sites were highly positive for RGC-32 (Figure 3A, B; Table 2). However, these differences did not reach statistical significance.
Figure 3. Staining score distribution for the expression of RGC-32.
A) Percentage of samples of normal mucosa, normal mucosa resected from colorectal adenocarcinoma, colonic adenomas, and adenocarcinomas that were positive for RGC-32 expression. Only 67% of normal colonic mucosa samples were positive, as compared to 100% of the normal mucosa samples from colons resected from colon adenocarcinomas. +; slightly positive, ++; positive, +++; highly positive.
B) RGC-32 staining percentages for early-stage colon cancer (T1 or T2), advanced-stage colon cancer (T3 or T4), colon adenocarcinoma metastasized to the lymph nodes, and colon adenocarcinoma metastatic to distant organs.
Since longstanding inflammatory bowel disease (IBD) is associated with an increased risk of colon cancer we also investigated the expression of RGC-32 in ulcerative colitis and Crohn’s diseases. We found that 12 out of 13 samples from patients with ulcerative colitis or Crohn’s disease were positive for RGC-32 (Table 2). The staining intensity in IBDs was statistically different when compared to that of adenocarcinomas (p=0.046).
Effect of RGC-32 knockdown on gene expression in SW480 colon cancer cells
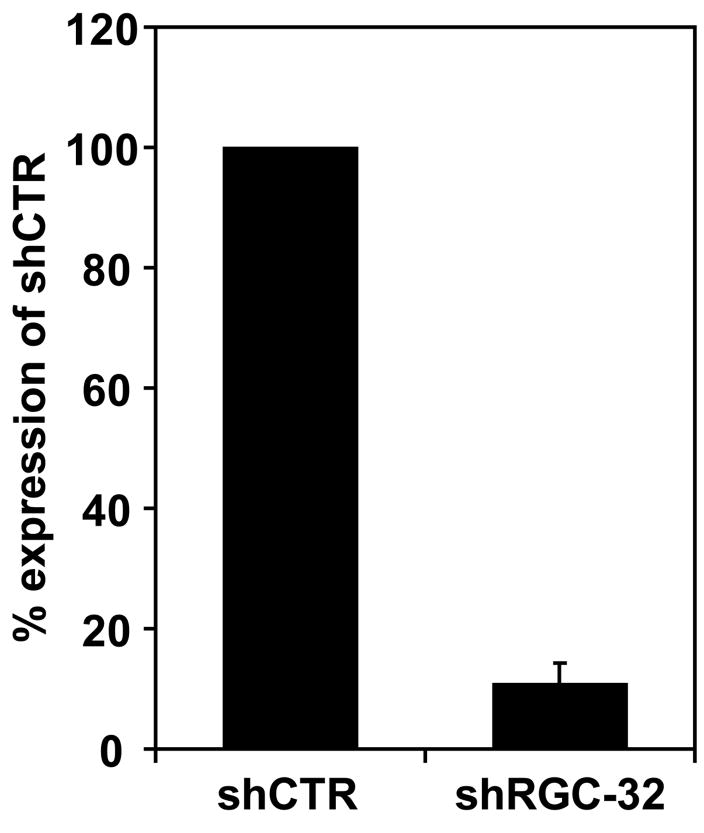
To investigate the effect of RGC-32 knockdown on the transcription profile in the SW480 colon cancer cell line, we used a cancer oligonucleotide array. Gene silencing in SW480 cells was successful, yielding a 90% reduction in RGC-32 expression, as quantified by real-time PCR, in shRGC-32-transfected cells when compared to control shCTR-transfected cells (Figure 4). Similar knockdown results was obtained with shRGC-32-2 (Fosbrink et al., 2009) which is targeting the 3′UTR of RGC-32 (data not shown). All knockdown experiments were performed in triplicates.
Figure 4. Effect of RGC-32 silencing on RGC-32 mRNA expression.
SW480 were transfected with shRGC-32 or shCTR using the Lipofectamine2000 transfection reagent. After 48 h, total RNA was extracted, and analyzed for RGC-32 and L13 mRNA expression by real time - PCR. ShRGC-32 significantly reduced RGC-32 mRNA expression by 90%. Data are mean ± SEM from three separate experiments.
Knockdown of the RGC-32 gene in SW480 cells had a significant effect on the transcriptional profile. When we restricted the profile to those genes with a ≥1.5-fold change in expression, we found that 230 genes were differentially regulated in SW480 lacking RGC-32 expression, as compared to the shCTR-transfected cells. According to the microarray analysis, the most highly up-regulated genes were WEE1 (up-regulated 9– fold), RAD51 associated protein 1 (up-regulated 7.5-fold), U6 snRNA-associated Sm-like protein gene (up-regulated 4.2-fold) and histone H2B family member G (up-regulated 3.1 fold) (Table S1, Supplemental materials). There were 51 down-regulated genes that showed a >1.5-fold change in expression following RGC-32 knockdown in SW480 cells (Table S1, Supplemental materials): phosphodiesterase 6D cGMP-specific, delta subunit (down-regulated 55-fold), surfactant pulmonary-associated protein A2 (down-regulated 4.5 fold), metallothionein 1G (down-regulated 2.6 fold), and beta-catenin (down-regulated 2.4 fold).
The differentially regulated genes were further characterized according to their roles in biological processes, using the Gene Ontology (GO) database (Ashburner et al., 2000). This analysis outlined several major functions for the genes that were differentially regulated following RGC-32 knockdown: chromatin assembly, protein DNA complex assembly, RNA processing, and cell cycle processes (Table 3). The chromatin assembly GO category included histone 2B family members, nucleosome assembly protein 1, and pyrroline 5 charboxylate reductase 1 (Table 4). Cell cycle-associated genes WEE1, CDC20, 14-3-3 Gamma, and cell division cycle CDC25B were all increased after RGC-32 knockdown (Table S1, Supplemental materials).
Table 3.
Gene Ontology data mining analysis of the genes differentially expressed after RGC-32 knockdown in SW480 cells.
| Description | Number of genes | % | p-value | Benjamini |
|---|---|---|---|---|
| Chromatin assembly | 10 | 5.3 | 1.00E-06 | 5.40E-03 |
| Nucleosome assembly | 9 | 4.8 | 3.70E-06 | 9.60E-03 |
| Chromatin assembly or disassembly | 10 | 5.3 | 1.90E-05 | 3.30E-02 |
| Chromosome organization and biogenesis | 15 | 7.9 | 5.70E-05 | 7.20E-02 |
| Protein-DNA complex assembly | 9 | 4.8 | 1.90E-04 | 1.80E-01 |
| Organelle organization and biogenesis | 27 | 14.3 | 2.10E-04 | 1.70E-01 |
| Establishment and/or maintenance of chromatin architecture | 12 | 6.3 | 4.20E-04 | 2.70E-01 |
| DNA packaging | 12 | 6.3 | 4.90E-04 | 2.80E-01 |
| DNA metabolic process | 21 | 11.1 | 5.30E-04 | 2.70E-01 |
| Cellular component organization and biogenesis | 41 | 21.7 | 1.00E-02 | 1.00E+00 |
| Cell proliferation | 16 | 8.5 | 1.70E-02 | 1.00E+00 |
| RNA processing | 11 | 5.8 | 2.00E-02 | 1.00E+00 |
| Cellular component assembly | 13 | 6.9 | 2.20E-02 | 1.00E+00 |
| Cell cycle process | 15 | 7.9 | 2.20E-02 | 1.00E+00 |
| RNA splicing | 7 | 3.7 | 3.00E-02 | 1.00E+00 |
| Macromolecular complex assembly | 12 | 6.3 | 3.00E-02 | 1.00E+00 |
| Cellular iron ion homeostasis | 3 | 1.6 | 3.60E-02 | 1.00E+00 |
| Pigment biosynthetic process | 3 | 1.6 | 4.30E-02 | 1.00E+00 |
| Regulation of progression through cell cycle | 11 | 5.8 | 4.50E-02 | 1.00E+00 |
| Pigment metabolic process | 3 | 1.6 | 5.30E-02 | 1.00E+00 |
| Smooth muscle contraction | 3 | 1.6 | 5.80E-02 | 1.00E+00 |
| Protein localization | 14 | 7.4 | 6.40E-02 | 1.00E+00 |
| Defense response to bacterium | 4 | 2.1 | 6.70E-02 | 1.00E+00 |
| Regulation of cell proliferation | 10 | 5.3 | 7.30E-02 | 1.00E+00 |
| Nucleobase, nucleoside, nucleotide and nucleic acid metabolic process | 51 | 27 | 8.00E-02 | 1.00E+00 |
| Ectoderm development | 5 | 2.6 | 8.20E-02 | 1.00E+00 |
| Establishment of protein localization | 13 | 6.9 | 8.30E-02 | 1.00E+00 |
| Mitosis | 6 | 3.2 | 8.50E-02 | 1.00E+00 |
| Secondary metabolic process | 3 | 1.6 | 9.00E-02 | 1.00E+00 |
| Macromolecule localization | 14 | 7.4 | 9.30E-02 | 1.00E+00 |
| Metabolic process | 104 | 55 | 9.40E-02 | 1.00E+00 |
| Lipid metabolic process | 13 | 6.9 | 9.50E-02 | 1.00E+00 |
| Cofactor metabolic process | 6 | 3.2 | 9.70E-02 | 1.00E+00 |
Table 4.
Genes belonging to Chromatin assembly GO category.
| Gene Name | Genbank accession | Fold Change |
|---|---|---|
| H2B histone family, member G | Z80779 | 3.1 |
| H2B histone family, member S | NM_017445 | 2.9 |
| H2B histone family, member A | M60750 | 2.6 |
| H2B histone family, member B | M60751 | 2.6 |
| H2B histone family, member L | Z80783 | 1.9 |
| H2A histone family, member N | X57138 | 1.7 |
| H4 histone family | X60483, X67081, X60484 | −1.7 |
| H2B histone family, member E | Z83738 | 1.6 |
| Pyrroline-5-carboxylate reductase 1 | M77836 | 1.6 |
| H2A histone family, member E | Z83736 | 1.5 |
| H2B histone family, member J | Z80781 | 1.5 |
| H2B histone family, member T | AJ223352 | 1.5 |
| Nucleosome assembly protein 1-like 4 | U77456 | 1.5 |
Real-time PCR analysis
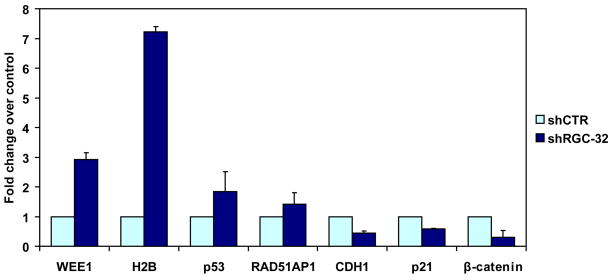
The differential expression of several of the genes that we had identified by microarray analysis was then confirmed by real-time PCR using the primer pairs and hybridization probes listed in Table 1. The differentially regulated genes included WEE1, RAD51 associated protein 1, β-catenin and histone H2BD, which showed the highest level of regulation by microarray analysis (Figure 5). There was good agreement between the real–time PCR and microarray data. The results of the RT-PCR analysis and microarray quantification were in agreement in terms of the direction of the change, but the magnitude of the change was not always identical.
Figure 5. Real-time quantitative RT-PCR for genes selected from the profile.
Seven genes were analyzed by real-time PCR to confirm the microarray results. Changes in mRNA expression similar to those seen in the gene array experiments were found for WEE1, H2BD, p53, RAD1 associated protein 1, and β-catenin. RGC-32 silencing also induces up-regulation of p53 and down-regulation of p21 and CDH1. Data are expressed as fold change over shCTR effect. Data are mean ± SEM from three separate experiments.
Epigenetic modifications regulate the expression of a number of genes in colon cancer cells including p53, p21, E-cadherin and CDH1 (Fang et al., 2004). To determine whether RGC-32 silencing has an impact on these genes, we examined their mRNA expression after RGC-32 silencing. p53 mRNA levels were increased after silencing of RGC-32, whereas those of CDH1, p21 and β-catenin were decreased (Fig. 5). p21 is one of the downstream effectors of p53, and a highly significant association between p53 accumulation and downregulation of p21 (WAF1/CIP1) has been reported in primary colon carcinoma (Bukholm and Nesland, 2000). Downregulation of p21 occurs as a result of p53 mutations in colorectal cancer (Ogino et al., 2006). In addition, a strong association has been found between a reduction in/absence of p21 and the development of metastases and cancer-related death (Bukholm and Nesland, 2000).
Effect of RGC-32 silencing on histone modifications
Because of the significant changes in the histone H2B family members that occurred after RGC-32 knockdown, we focused our attention on this family of genes. The change in the expression of histone H2B led us to ask whether the acetylation and methylation of histones were significantly affected by RGC-32 knockdown.
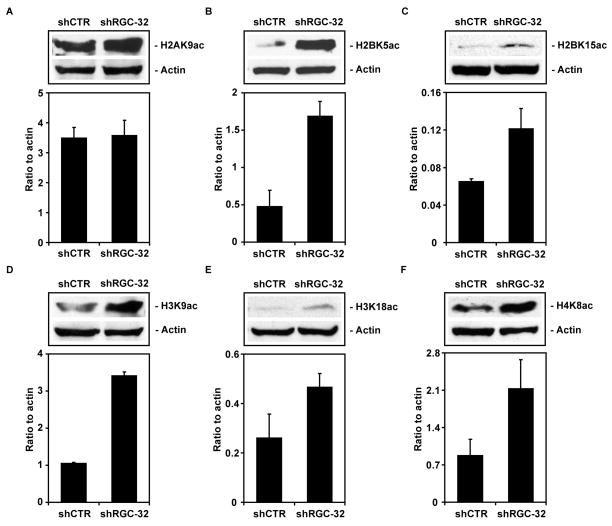
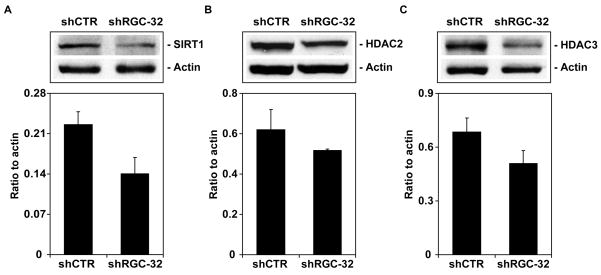
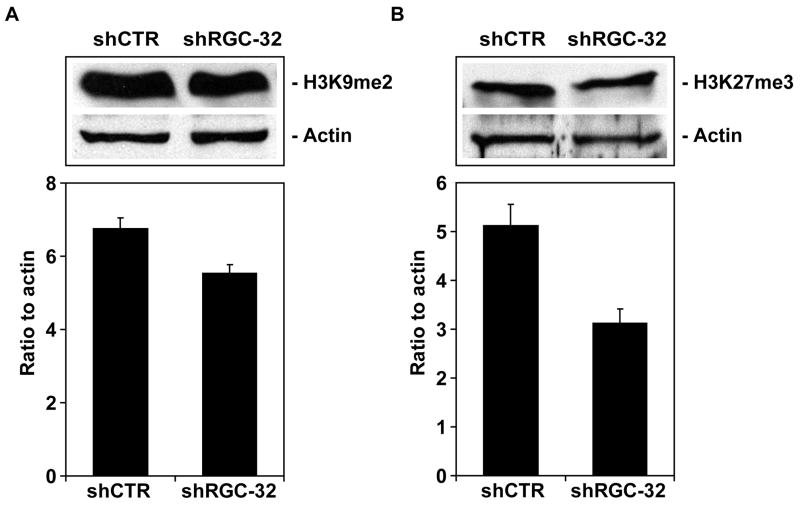
To answer this question, we used western blot analysis to detect the expression of histone and the acetylated forms of histones H2A, H2B, H3, and H4. Histone modifications were expressed as a ratio to actin and to total histone (Table 5). An increase of >1.5-fold in histones modifications and expression of the HDACs was considered significant (Table 5). We saw significant increases in the amount of acetylation of histone H2B at K5 and K15, histone H3 at K9 and K18, and histone H4 at K8 after RGC-32 knockdown (Figure 6). In contrast, the acetylation of histone H2A at K9 was not significantly affected by RGC-32 silencing (Figure 6). In addition, RGC-32 knockdown reduced the expression of the histone deacetlyase SIRT1 (Figure 7) and of H3K27me3 (Figure 8). These data suggest that RGC-32 induces epigenetic changes that might be responsible for some of its effects, including those on the cell cycle.
Table 5.
Effect of RGC-32 knockdown on histone modifications and HDACs expression.
| Epigenetic mediators | shRGC-32/shCTR (normalised to actin) | shRGC-32/shCTR (normalised to total histone) |
|---|---|---|
| H2BK5ac | 3.5 | 2.9 |
| H3K9ac | 3.2 | 2.9 |
| H4K8ac | 2.4 | ND |
| H2BK15ac | 2.1 | 1.7 |
| H3K18ac | 1.7 | 2.7 |
| H2AK5ac | 1.0 | 0.9 |
| H3K9me2 | 0.8 | 0.9 |
| H3K27me3 | 0.6 | 0.8 |
| HDAC2 | 0.8 | NA |
| HDAC3 | 0.7 | NA |
| SIRT1 | 0.6 | NA |
The effect of RGC-32 knockdown on histone acetylation, methylation and HDACs expression was measured by western blot. The expression of these epigenetic mediators was quantitated by densitometric scanning and ratios to actin were calculated for both shRGC-32 and control-transfected cells. These ratios were used to calculate the RGC-32 shRNA to control shRNA-transfected cells ratio. NA = not applicable, ND= not determined
Figure 6. Effect of RGC-32 silencing on histone acetylation.
Acetylation of histones H2B, H3, and H4 was assessed by western blotting using specific antibodies. The results were expressed as ratios to beta-actin. RGC-32 silencing induced an increase in the expression of histones H2BK5ac, H2BK15ac, H3K9ac, H3K18ac, and H4K8ac. Data are mean ± SEM from three separate experiments.
Figure 7. Effect of RGC-32 silencing on histone deacetylases.
The expression of SIRT1, HDAC2, and HDAC3 was assessed by western blotting. The results were expressed as ratios to beta-actin. A significant reduction in SIRT1 levels was seen after RGC-32 knockdown. Data are mean ± SEM from three separate experiments.
Figure 8. Effect of RGC-32 silencing on histone H3 methylation.
Histone H3 dimethylation at K9 and trimethylation at K27 were assessed by western blotting using specific antibodies. The results were expressed as ratios to beta-actin. The amount of histone H3 K27m3 was significantly reduced by treatment with shRGC-32 when compared to the control shCTR. Data are mean ± SEM from three separate experiments.
Effect of RGC-32 knockdown on the cell cycle
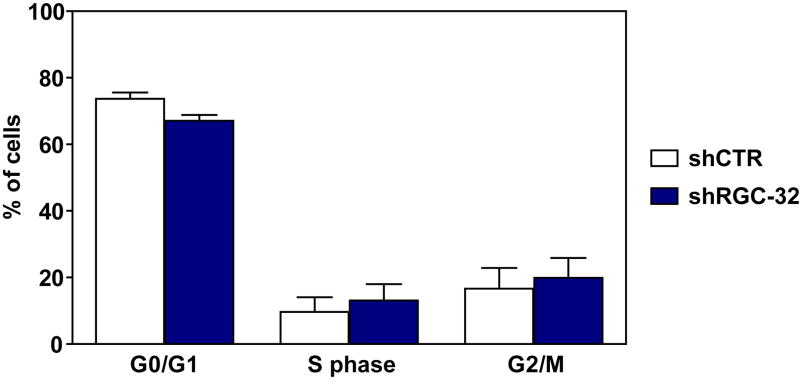
We then used BrdU incorporation assays and flow cytometry to determine the effect of RGC-32 knockdown on the cell cycle in SW480 cells. RGC-32 shRNA and CTR shRNA were transiently transfected into SW480 cells, and the cells were synchronized in G0/G1 by starvation for 18 h. The cells were then changed to medium containing 10% FBS for 18 h and pulsed with BrdU for 1 h. The percentage of SW480 cells in the G0/G1 phase after RGC-32 knockdown was significantly reduced (67%) when compared to that of control shCTR-transfected cells (74%, p=0.024); the number of cells entering S phase (13% versus 9.6%, p=0.046) and G2/M phase (19.8% versus 16.6%, p=0.009) was significantly higher for the RGC-32-silenced cells than for the shCTR-transfected cells (Fig. 9). These data indicate that silencing the RGC-32 gene induces DNA synthesis and mitosis in SW480 colon cancer cells.
Figure 9. Effect of RGC-32 knockdown on cell cycle phases.
After an 18-h stimulation with RPMI containing 10% FBS, BrdU was incorporated into SW480 cells transfected with CTR shRNA or RGC-32 shRNA. DNA synthesis was assessed by BrdU incorporation, and DNA content was determined using 7-aminoactinomycin D and flow cytometry. Results are means ± SEM from three separate experiments. RGC-32 knockdown induced S-phase and G2/M-phase entry, with 3.4% more cells being found in S phase and 3.2% more cells in G2/M phase in the SW480 RGC-32-transfected cells than in the shCTR-transfected cells. Data are means ± SEM from three independently conducted experiments.
DISCUSSION
Expression of RGC-32 in normal, precancerous and cancerous colon tissue
In the present study, the significantly higher proportion of adenocarcinomas and adenomas that display RGC-32 staining compared to normal colonic tissue suggest a possible role for RGC-32 deregulation in colon carcinogenesis. The percentage of ulcerative colitis and Crohn’s disease samples that stained intensely for RGC-32 in our study was higher than that for normal mucosa and small adenomas, a finding that may indicate that RGC-32 expression is correlated with proliferative activity in inflammatory bowel disease and contributes to IBD-related dysplasia-carcinoma (Ioachim et al., 2004). It is also important to note that RGC-32 is one of the genes that was found to be up-regulated after k-ras transformation of normal enterocytes (Sagiv et al., 2006). The high level of expression of the RGC-32 protein in tumors and precancerous states is in contrast with the low or undetectable levels of this protein that have been reported in tumor cell lines (Fosbrink et al., 2005).
Effect of RGC-32 silencing on histone modification
To date, the components of the network of proteins regulated by RGC-32 and their role(s) in tumorigenesis are not well known. To explore this issue, we took a genomic approach using gene profiling to identify genes that are differentially expressed after RGC-32 silencing. To our knowledge, this is the first transcriptome analysis performed in tumor cell lines to assess the effect of RGC-32 silencing. In the present study, we have shown that RGC-32 has a significant impact on transcriptional regulation in the SW480 colon cancer cell line. GO data mining further indicated that genes involved in chromosomal assembly were the most significantly regulated by RGC-32, a surprising result that led us to investigate the effect of RGC-32 silencing on histone modifications. These experiments indicated that RGC-32 plays an important role in regulating the acetylation of histones, a process that might in turn lead to transcriptional activation and thereby support the hypothesis that epigenetic alterations controlled by RGC-32 are involved in the regulation of the cell cycle in tumor cells.
Modification of histones can affect the degree to which DNA is compacted, and therefore its availability for use by transcription factors (Esteller, 2007). The histone deacetylase inhibitors sodium butyrate and trichostatin (TSA) have been used to produce hyperacetylation of histone H3 and H4 in Colo-320 and SW1116 colon cancer cell lines, which was shown to lead to the re-expression of the cell cycle inhibitor p21 and G1-phase cell cycle arrest (Fang et al., 2004). In gastric carcinoma tissue, histone H3 has been shown to be hypoacetylated in the p21 promoter region and to be associated with a reduction in p21 expression (Mitani et al., 2005). All these data point to the potential induction of p21 expression in colon cancer cell lines after histone hyperacetylation.
In contrast, our data have shown a significant decrease in the expression of p21 and another tumor suppressor gene, CDH1, after RGC-32 silencing. Our data are in agreement with previous observations that in tumor cells, reversing the acetylation state of a CpG island does not, by itself, result in gene reactivation (Shen and Issa, 2002). In addition, we found that RGC-32 silencing was associated with a reduction in SIRT1 and H3K27 trimethylation. The reduction in the expression of the class III histone deacetylase SIRT1 that we observed was in agreement with the increased acetylation of histones seen after RGC-32 silencing. It is possible that the increase in acetylation that we describe is secondary to the reduction of SIRT1 expression, and it is important to point out that SIRT1 is known to suppress colon cancer growth in an β-catenin-driven model of mouse colon cancer (Firestein et al., 2008). H3K27me3 is typically associated with transcriptionally silent genes, and a reduction in the methylation of H3K27, as observed here, might also account at least in part for the concomitant activation of the cell cycle (Attema et al., 2007).
Thus, our data suggest that a high level of RGC-32 expression may favor deacetylation of histones, probably via an increase in the expression of histone deacetylases and H3K27 trimetylation, with an end result of chromatin condensation and gene silencing.
Effect of RGC-32 knockdown on the cell cycle
We found that knocking down RGC-32 expression produced a modest but statistically significant increase in cell cycle progression in SW480 colon cancer cells. Overexpression of RGC-32 has been shown to delay mitotic progression in HeLa cells, and immunocytochemical analysis has indicated that the RGC-32 protein is concentrated in the centrosomes and spindle poles during mitosis (Saigusa et al., 2007). RGC-32 has also been found to belong to a group of new candidate tumor suppressor genes that are epigenetically silenced in endometrial cancer cell lines and can be upregulated after treatment with a demethylating agent (5-aza-2″-deoxycytidine) and a histone deacetylase inhibitor (suberoylanilide bishydroxamide) (Takai et al., 2005). The effect on RGC-32 on the SW480 cell cycle suggests that it may be also a possible tumor suppressor gene. RGC-32 expression is low or absent in most tumor cell lines (Fosbrink et al., 2005). These results in cancer cell lines are in contrast to the results we obtained from colon cancer tissue samples, in which high levels of expression of the RGC-32 protein were found in colon cancer and colon precancerous states. Since RGC-32 can induce the cell cycle in primary cells (Badea et al., 2002; Badea et al., 1998; Fosbrink et al., 2009), it is possible that this protein plays a dual role: as an activator of the cell cycle in primary cells, and as a tumor suppressor in cancer cells. Such dual roles have been reported for other factors such as TGF-β (Jakowlew, 2006) and RUNX1 (Wotton et al., 2008). TGF- β inhibits normal colonic cell proliferation by acting as a tumor suppressor in the early phases (Manning et al., 1991) while promoting tumor differentiation and invasion later in the disease (Akhurst and Balmain, 1999). Several reports have indicated that the elevated levels of TGF-β produced in colorectal cancer are associated with cancer progression (Tsushima et al., 1996). As RGC-32 expression can be induced by TGF- β (Huang et al., 2009), it is possible that TGF-β is responsible for the increased RGC-32 expression observed in colon cancer. Further work is needed to explore the implications of this relationship in colon cancer cell cycle regulation.
In conclusion, our data suggest that RGC-32 plays an important role in inducing epigenetic alterations of histones and may be involved in development of colon cancer by regulating chromatin assembly.
Supplementary Material
Acknowledgments
This work was supported in part by a US Public Health grant, R01 NS42011 (HR) and by a Veterans Administration Merit Award (HR). M. Fosbrink was supported in part by the NIH training grant ES 07263. We thank Dr. Deborah McClellan for editorial assistance.
Footnotes
Publisher's Disclaimer: This is a PDF file of an unedited manuscript that has been accepted for publication. As a service to our customers we are providing this early version of the manuscript. The manuscript will undergo copyediting, typesetting, and review of the resulting proof before it is published in its final citable form. Please note that during the production process errors may be discovered which could affect the content, and all legal disclaimers that apply to the journal pertain.
References
- Akhurst RJ, Balmain A. Genetic events and the role of TGF beta in epithelial tumour progression. J Pathol. 1999;187:82–90. doi: 10.1002/(SICI)1096-9896(199901)187:1<82::AID-PATH248>3.0.CO;2-8. [DOI] [PubMed] [Google Scholar]
- Ashburner M, et al. Gene ontology: tool for the unification of biology. The Gene Ontology Consortium. Nat Genet. 2000;25:25–9. doi: 10.1038/75556. [DOI] [PMC free article] [PubMed] [Google Scholar]
- Attema JL, et al. Epigenetic characterization of hematopoietic stem cell differentiation using miniChIP and bisulfite sequencing analysis. Proc Natl Acad Sci U S A. 2007;104:12371–6. doi: 10.1073/pnas.0704468104. [DOI] [PMC free article] [PubMed] [Google Scholar]
- Badea T, et al. RGC-32 increases p34CDC2 kinase activity and entry of aortic smooth muscle cells into S-phase. J Biol Chem. 2002;277:502–8. doi: 10.1074/jbc.M109354200. [DOI] [PubMed] [Google Scholar]
- Badea TC, et al. Molecular cloning and characterization of RGC-32, a novel gene induced by complement activation in oligodendrocytes. J Biol Chem. 1998;273:26977–81. doi: 10.1074/jbc.273.41.26977. [DOI] [PubMed] [Google Scholar]
- Bahnassy AA, et al. Cyclin A and cyclin D1 as significant prognostic markers in colorectal cancer patients. BMC Gastroenterol. 2004;4:22. doi: 10.1186/1471-230X-4-22. [DOI] [PMC free article] [PubMed] [Google Scholar]
- Bondi J, et al. Expression and gene amplification of primary (A, B1, D1, D3, and E) and secondary (C and H) cyclins in colon adenocarcinomas and correlation with patient outcome. J Clin Pathol. 2005;58:509–514. doi: 10.1136/jcp.2004.020347. [DOI] [PMC free article] [PubMed] [Google Scholar]
- Bredel M, et al. Tumor necrosis factor-alpha-induced protein 3 as a putative regulator of nuclear factor-kappaB-mediated resistance to O6-alkylating agents in human glioblastomas. J Clin Oncol. 2006;24:274–87. doi: 10.1200/JCO.2005.02.9405. [DOI] [PubMed] [Google Scholar]
- Bukholm IK, Nesland JM. Protein expression of p53, p21 (WAF1/CIP1), bcl-2, Bax, cyclin D1 and pRb in human colon carcinomas. Virchows Arch. 2000;436:224–8. doi: 10.1007/s004280050034. [DOI] [PubMed] [Google Scholar]
- Clarkson DB, Fan Y, Joe H. A remark on algoritm 643: FEXACT: An altgoritm for performing Fisher’s Exact Test in rxc contingency tables. ACM Transactions on Matematical Software. 1993;19:484–488. [Google Scholar]
- Cudrici C, et al. Complement C5 regulates the expression of insulin-like growth factor binding proteins in chronic experimental allergic encephalomyelitis. J Neuroimmunol. 2008;203:94–103. doi: 10.1016/j.jneuroim.2008.06.040. [DOI] [PMC free article] [PubMed] [Google Scholar]
- Donninger H, et al. Whole genome expression profiling of advance stage papillary serous ovarian cancer reveals activated pathways. Oncogene. 2004;23:8065–77. doi: 10.1038/sj.onc.1207959. [DOI] [PubMed] [Google Scholar]
- Esteller M. Cancer epigenomics: DNA methylomes and histone-modification maps. Nat Rev Genet. 2007;8:286–98. doi: 10.1038/nrg2005. [DOI] [PubMed] [Google Scholar]
- Fang JY, et al. Epigenetic modification regulates both expression of tumor-associated genes and cell cycle progressing in human colon cancer cell lines: Colo-320 and SW1116. Cell Res. 2004;14:217–26. doi: 10.1038/sj.cr.7290222. [DOI] [PubMed] [Google Scholar]
- Firestein R, et al. The SIRT1 deacetylase suppresses intestinal tumorigenesis and colon cancer growth. PLoS ONE. 2008;3:e2020. doi: 10.1371/journal.pone.0002020. [DOI] [PMC free article] [PubMed] [Google Scholar]
- Fosbrink M, et al. Overexpression of RGC-32 in colon cancer and other tumors. Exp Mol Pathol. 2005;78:116–22. doi: 10.1016/j.yexmp.2004.11.001. [DOI] [PubMed] [Google Scholar]
- Fosbrink M, et al. Response gene to complement 32 is required for C5b-9 induced cell cycle activation in endothelial cells. Exp Mol Pathol. 2009;86:87–94. doi: 10.1016/j.yexmp.2008.12.005. [DOI] [PMC free article] [PubMed] [Google Scholar]
- Hershko DD, Shapira M. Prognostic role of p27Kip1 deregulation in colorectal cancer. Cancer. 2006;107:668–75. doi: 10.1002/cncr.22073. [DOI] [PubMed] [Google Scholar]
- Huang W-Y, et al. RGC-32 Mediates Transforming Growth Factor-{beta}-induced Epithelial-Mesenchymal Transition in Human Renal Proximal Tubular Cells. J Biol Chem. 2009;284:9426–9432. doi: 10.1074/jbc.M900039200. [DOI] [PMC free article] [PubMed] [Google Scholar]
- Ioachim EE, et al. Immunohistochemical expression of cyclin D1, cyclin E, p21/waf1 and p27/kip1 in inflammatory bowel disease: correlation with other cell-cycle-related proteins (Rb, p53, ki-67 and PCNA) and clinicopathological features. Int J Colorectal Dis. 2004;19:325–33. doi: 10.1007/s00384-003-0571-3. [DOI] [PubMed] [Google Scholar]
- Jakowlew SB. Transforming growth factor-beta in cancer and metastasis. Cancer Metastasis Rev. 2006;25:435–57. doi: 10.1007/s10555-006-9006-2. [DOI] [PubMed] [Google Scholar]
- Kang Y, et al. A multigenic program mediating breast cancer metastasis to bone. Cancer Cell. 2003;3:537–49. doi: 10.1016/s1535-6108(03)00132-6. [DOI] [PubMed] [Google Scholar]
- Manning AM, et al. Differential sensitivity of human colonic adenoma and carcinoma cells to transforming growth factor beta (TGF-beta): conversion of an adenoma cell line to a tumorigenic phenotype is accompanied by a reduced response to the inhibitory effects of TGF-beta. Oncogene. 1991;6:1471–6. [PubMed] [Google Scholar]
- Massague J. G1 cell-cycle control and cancer. Nature. 2004;432:298–306. doi: 10.1038/nature03094. [DOI] [PubMed] [Google Scholar]
- Mitani Y, et al. Histone H3 acetylation is associated with reduced p21(WAF1/CIP1) expression by gastric carcinoma. J Pathol. 2005;205:65–73. doi: 10.1002/path.1684. [DOI] [PubMed] [Google Scholar]
- Ogino S, et al. Down-regulation of p21 (CDKN1A/CIP1) is inversely associated with microsatellite instability and CpG island methylator phenotype (CIMP) in colorectal cancer. J Pathol. 2006;210:147–54. doi: 10.1002/path.2030. [DOI] [PubMed] [Google Scholar]
- Sagiv E, et al. CD24 is a new oncogene, early at the multistep process of colorectal cancer carcinogenesis. Gastroenterology. 2006;131:630–9. doi: 10.1053/j.gastro.2006.04.028. [DOI] [PubMed] [Google Scholar]
- Saigusa K, et al. RGC32, a novel p53-inducible gene, is located on centrosomes during mitosis and results in G2/M arrest. Oncogene. 2007;26:1110–21. doi: 10.1038/sj.onc.1210148. [DOI] [PubMed] [Google Scholar]
- Salh B, et al. Differential cyclin-dependent kinase expression and activation in human colon cancer. Anticancer Res. 1999;19:741–8. [PubMed] [Google Scholar]
- Shen L, Issa JP. Epigenetics in colorectal cancer. Curr Opin Gastroenterol. 2002;18:68–73. doi: 10.1097/00001574-200201000-00012. [DOI] [PubMed] [Google Scholar]
- Takai N, et al. Discovery of epigenetically masked tumor suppressor genes in endometrial cancer. Mol Cancer Res. 2005;3:261–9. doi: 10.1158/1541-7786.MCR-04-0110. [DOI] [PubMed] [Google Scholar]
- Tsushima H, et al. High levels of transforming growth factor beta 1 in patients with colorectal cancer: association with disease progression. Gastroenterology. 1996;110:375–82. doi: 10.1053/gast.1996.v110.pm8566583. [DOI] [PubMed] [Google Scholar]
- Vlaicu SI, et al. Role of response gene to complement 32 in diseases. Arch Immunol Ther Exp (Warsz) 2008;56:115–22. doi: 10.1007/s00005-008-0016-3. [DOI] [PMC free article] [PubMed] [Google Scholar]
- Wotton S, et al. Gene array analysis reveals a common Runx transcriptional programme controlling cell adhesion and survival. Oncogene. 2008;27:5856–66. doi: 10.1038/onc.2008.195. [DOI] [PMC free article] [PubMed] [Google Scholar]
- Zhan F, et al. The molecular classification of multiple myeloma. Blood. 2006;108:2020–8. doi: 10.1182/blood-2005-11-013458. [DOI] [PMC free article] [PubMed] [Google Scholar]
- Zhao P, et al. Aberrant cytological localization of p16 and CDK4 in colorectal epithelia in the normal adenoma carcinoma sequence. World J Gastroenterol. 2006;12:6391–6. doi: 10.3748/wjg.v12.i39.6391. [DOI] [PMC free article] [PubMed] [Google Scholar]
Associated Data
This section collects any data citations, data availability statements, or supplementary materials included in this article.


