

Through factor analysis, MR spectroscopic imaging data can reveal differences between uninfected individuals, those chronically infected with the human immunodeficiency virus (HIV), and those with HIV-associated dementia and provides information on the spatial distribution of metabolic changes within these subjects.
Abstract
Purpose:
To develop a relevant pathophysiologic model of human immunodeficiency virus (HIV)-associated dementia by studying regional variations in metabolite levels measured with magnetic resonance (MR) spectroscopic imaging and their relationship to immunologic measures and cognitive dysfunction.
Materials and Methods:
This was a HIPAA-compliant, institutional review board-approved study involving written informed consent. Distributions of N-acetylaspartate (NAA), choline (Cho), and creatine (Cr) concentrations in 94 subjects (20 seronegative controls and 74 HIV-positive subjects; 34 of the HIV-positive subjects having HIV-associated dementia; 63 men, 31 women; mean age, 40 years) were determined with proton (hydrogen 1 [1H]) MR spectroscopic imaging. HIV-positive subjects underwent neuropsychological testing and blood and cerebrospinal fluid (CSF) analysis. Factor analysis was utilized to determine associations between metabolites across regions. Analysis of variance and t tests were used to isolate differences between cohorts.
Results:
A “Cho factor” differentiated seronegative controls from HIV-infected cohorts, indicating elevated Cho levels across deep gray and white matter regions of HIV-positive individuals. An “NAA factor” differentiated those with dementia from those without and correlated best with psychomotor and executive function tests. A “Cr factor” indicated Cr elevations correlated with CSF monocyte chemoattractant protein-1 levels. NAA and Cr factor scores were strongly weighted to metabolite changes in white matter regions.
Conclusion:
These results highlight the importance of white matter involvement in HIV-associated dementia and support the current pathogenesis model of glial cell proliferation in HIV infection, denoted by regional Cho elevations, and neuronal dysfunction and/or death, denoted by NAA decreases, associated with dementia. Factor analysis of MR spectroscopic imaging data is a useful method for determining regional metabolic variations in HIV infection and its neuropsychological correlates.
© RSNA, 2010
Introduction
The human immunodeficiency virus (HIV) has been shown to cross the blood-brain barrier and initiate cytokine-mediated signaling cascades that ultimately lead to neuronal injury (1). Magnetic resonance (MR) spectroscopy may be useful in detecting neuronal dysfunction before gross, irreversible damage and HIV-associated dementia occurs (2–5). Previous MR spectroscopic studies have revealed alterations in both gray and white matter of HIV-infected subjects, but most HIV studies have focused on single-voxel MR spectroscopy at short echo time (2,3,6–9). In contrast, MR spectroscopic imaging is commonly used in the clinical setting and is capable of greater spatial resolution and wider brain coverage all in a short period of time. However, because of the large number of variables MR spectroscopic imaging generates, examination of regional variations for this disease could benefit from the use of unconventional statistical methods, including factor analysis.
Factor analysis is a technique, the greatest advantage of which is the capability of reducing the number of variables included in an analysis of a large body of data (10). Factor analysis has been applied in various modes to identify the latent structure of patterns underlying the observed variables and has been applied to immunologic datasets, analysis of microarrays and drug libraries, clinical investigations to define disease profiles, and analysis of psychologic or psychiatric assessments (11–15). In psychologic assessments, this analysis can take the form of uncovering the core opinions and attitudes (unobservable factors) that result in the answers given in a questionnaire (observable variables). Factor analysis has also been used to reveal the fundamental mechanisms that produce the changes seen in high-throughput genomic screenings (16).
Factor analysis has been applied in MR spectroscopic studies (17), and this statistical method has been used to identify in vivo metabolite patterns in single-voxel studies within the context of HIV-related illness (18–21). When applied to MR spectroscopic imaging data, factor analysis theoretically could uncover underlying patterns of metabolic changes due to disease over many brain regions, generating “factors,” the scores of which can represent regional changes or associations between metabolites. It is in this regard that factor analysis attempts to ascertain unobservable factors that influence changes in observable metabolic variables.
In this study, factor analysis was applied to proton (hydrogen 1 [1H]) MR spectroscopic imaging data from a cohort of HIV-positive subjects and subjects seronegative for HIV, in conjunction with neuropsychological assessments and immunologic analyses of blood and cerebrospinal fluid (CSF), with the aims of (a) using MR spectroscopic imaging to explore differences in the regional metabolism between HIV-infected cohorts and seronegative controls, (b) examining these metabolic differences in light of the individual neuropsychological evaluations, and (c) correlating these MR spectroscopic imaging data with clinical and immunologic markers for HIV infection or HIV-associated dementia. Our purpose was to develop a relevant pathophysiologic model of HIV-associated dementia by studying regional variations in metabolite levels measured with MR spectroscopic imaging and their relationship to immunologic measures and cognitive dysfunction in affected subjects.
Materials and Methods
Subjects
Seventy-four chronically-infected HIV-positive subjects (not antiretroviral naive) and 20 seronegative controls were enrolled in the Health Insurance Portability and Accountability Act-compliant, institutional review board-approved study from November 1999 to December 2002. Written informed consent was obtained from all enrolled. Exclusion criteria were (a) current or past opportunistic central nervous system infection, (b) history or current evidence of schizophrenia, (c) current severe affective disorder believed to explain cognitive impairment, (d) history of chronic neurologic disorder or structural central nervous system abnormality, and (e) history of severe head injury. Subjects with a remote history of substance abuse were allowed into the study and may represent a possible confounding variable to these data. However, if a subject appeared to be acutely lethargic, the participant did not undergo any testing and was rescheduled. Each subject’s sex, race, mode of infection, education, and age were documented. All HIV-positive subjects underwent detailed neurologic, neuropsychological, and clinical assessments as described previously (22). Severity of cognitive impairment was evaluated by using the Memorial Sloan-Kettering (MSK) staging for HIV-associated dementia and a neuropsychological battery consisting of nine tests covering executive function, verbal memory, informational processing speed, and motor and psychomotor speed. All clinical data were reviewed by a neurologist (N.S., 10 years experience) and a neuropsychologist (O.S., 20 years experience), who were blinded to the MR spectroscopic imaging results until a consensus was reached. HIV-positive subjects were either classified as having dementia (MSK stage ≥ 1) or not (MSK stage < 1). Both blood and CSF samples were obtained from the HIV-positive subjects, and viral, CD4+ T-cell, and monocyte chemoattractant protein-1 (MCP-1) levels; tumor necrosis factor (TNF)-α; macrophage-colony stimulating factor (M-CSF); and interleukin (IL)-6 levels were measured (23). Neurologic, neuropsychological, and clinical examinations were not performed in healthy control subjects.
MR Imaging and MR Spectroscopic Imaging
Imaging experiments were performed with a 1.5-T (Philips, Andover, Mass) MR imager. Routine brain MR imaging and multisection, proton two-dimensional MR spectroscopic imaging examinations at long echo time (repetition time msec/echo time msec, 2000/280) were performed. A spin-echo sequence, chemical shift–selective, or CHESS, pulse water suppression, and eight outer-volume saturation pulses for lipid suppression were used with MR spectroscopic imaging (24). Three 15-mm-thick sections (2.5-mm gap) were recorded. A 28 × 28 circular phase-encoding scheme resulted in a total data acquisition time of 20 minutes. The 24-cm field of view resulted in a voxel size of approximately 1.1 cm3. Multisection two-dimensional MR spectroscopic imaging data were reconstructed by using software developed in-house (25) and were processed by means of three-dimensional Fourier transformation (Fig 1). Quantification of MR spectroscopic imaging data was performed by using phantom replacement methodology (25,26). Regions of interest for spectral quantification included the thalamus, basal ganglia (primarily centered on the putamen), frontal white matter, centrum semiovale, parietal white matter, frontal gray matter, and parietal gray matter (Fig 2). Concentrations of NAA, Cho, and Cr in seven representative brain regions were determined, yielding 21 observed variables. All imaging data were reviewed by the MR physicists (P.B.B., 28 years of experience; M.A.M., 6 years of experience) responsible for their collection and quantification, who were blinded to the MSK ratings of dementia, until a consensus was reached.
Figure 1:

Axial T1-weighted localizer, Choline (Cho), Creatine (Cr), and N-acetylaspartate (NAA) metabolic MR images at two different brain levels, with the second row of images at a higher anatomic level than those in the first row, in a 50-year-old HIV-positive male subject (MSK stage 2).
Figure 2a:

(a) Spectra from the seven regions of interest in the same patient. GM = gray matter, WM = white matter. (b, c) Unilateral regions of interest (left or right) are shown for clarity. Data analysis was performed for regions of interest in both hemispheres.
Figure 2b:

(a) Spectra from the seven regions of interest in the same patient. GM = gray matter, WM = white matter. (b, c) Unilateral regions of interest (left or right) are shown for clarity. Data analysis was performed for regions of interest in both hemispheres.
Figure 2c:

(a) Spectra from the seven regions of interest in the same patient. GM = gray matter, WM = white matter. (b, c) Unilateral regions of interest (left or right) are shown for clarity. Data analysis was performed for regions of interest in both hemispheres.
Statistical Analysis
Factor analysis was performed on MR spectroscopic imaging data from all 94 subjects. CSF and neurologic data were obtained only for the 74 HIV-positive subjects. Therefore, associations between biologic measures and factor scores were only performed for those 74 subjects. Statistics were calculated by using JMP 7 (SAS Institute, Cary, NC) statistics software package. M.R.L. (MR physicist, 6 years experience) and V.L. (research assistant, 2 years experience) performed the statistical analyses, while E.F.H. (statistician, more than 35 years of experience) oversaw these analyses. Factor analysis was performed by first generating the principal components of the 21 variables from the MR spectroscopic imaging experiment, creating 21 eigenvectors (12,13). By following the Kaiser criterion, only eigenvectors with eigenvalues greater than 1 were kept, leaving six main eigenvectors or factors that explained 68% of the variance in the original dataset. The remaining variation in the dataset was considered noise. Varimax rotation, a conventional optimization criterion, was applied to help interpret the factors (27). Factor loadings explain the association of each variable with each factor. The variable loading is considered strong if greater than 0.6, moderate if 0.4–0.6, and weak if less than 0.4. Each subject was assigned a score for each rotated factor on the basis of the loadings of the subject’s original 21 variable levels. Further information regarding the factor analysis method and limitations to its use can be found in references provided (12,13,28).
According to analysis of variance (ANOVA), factor scores for three of the six factors were associated (or a trend, P < .10) with HIV or cognitive status. Only those three factors were used at subsequent data analyses. Two-tailed least-squares means t tests were performed if ANOVA findings were significant to determine differences between groups. Nominal logistic regression was also used to verify if the factors could predict HIV and cognitive status. Pearson χ2 or nonparametric Kruskal-Wallis tests were used to determine if demographics and clinical characteristics were significantly different across groups.
ANOVA was used to determine if neuropsychological testing differed across cohorts (nine comparisons, Bonferroni correction: P < .006). Nonparametric Spearman rank correlations (Rs) were used to relate neurocognitive test scores with the three MR spectroscopic imaging factors (27 pairwise comparisons, Bonferroni correction: P < .002). Spearman rank correlations were also used to examine relationships among 11 selected immunologic measures (55 pairwise comparisons, Bonferroni correction: P < .0009), as well as to determine if they were related to the three MR spectroscopic imaging factors (33 pairwise comparisons, Bonferroni correction: P = .0015). Correlations were performed for data of HIV-positive subjects only.
Results
Clinical Characteristics
Of 74 HIV-positive subjects, seven (9%) had MSK stage 0, 33 (45%) had MSK stage 0.5, 25 (34%) had MSK stage 1, and nine (12%) had MSK stage 2 dementia. Thirty-four subjects had dementia (MSK stage ≥ 1) and 40 did not have dementia (MSK stage < 1) (Table 1). These two populations differed in race, level of education, CSF viral load, and M-CSF levels within the CSF. No differences were observed between the HIV-positive groups for mode of infection, age, CD4+ T-cell count, or plasma viral load.
Table 1.
Cohort Demographics and Immunologic Measures
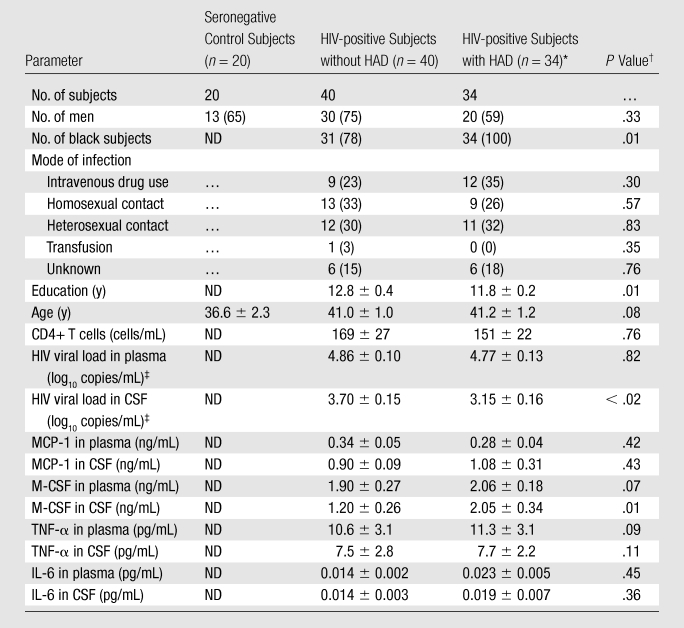
Note.—Unless otherwise indicated, data are the means ± standard error of the mean. Data in parentheses are percentages. HAD = HIV-associated dementia, ND = not determined.
MSK stages 1 (25 subjects) and 2 (nine subjects) were included.
P values for sex, race, and mode of infection represent Pearson χ2 test, while the others represent nonparametric Kruskal-Wallis test across all groups.
Viral loads in CSF represent samples from 59 HIV-positive subjects (33 without HAD, 26 with), while those in plasma represent 69 HIV-positive subjects (36 without HAD, 33 with).
Analysis of MR Spectroscopic Imaging Factors in Relation to HIV Status and Dementia Status
Subjects were assigned a score for each factor on the basis of its loadings (Table 2), and the scores for each factor were tested to determine if they differed by dementia or serostatus (see Table 3 for mean factor scores and P values). Factors 1, 4, and 6 demonstrated the ability to distinguish among the three cohorts. By examining the loadings of each metabolite in each factor, each factor showed major contributions from specific metabolites correlated across several brain regions: a “Cho factor,” “NAA factor,” and “Cr factor.” ANOVA demonstrated that scores for the Cho and NAA factors differed across cohorts, while differences in scores for the Cr factor approached significance (Fig 3). Logistic regressions confirmed those results (Table 3). The other factors (factors 2, 3, and 5) were not associated with the primary hypotheses tested here, though they may be significantly related to some other change. Therefore, no interpretation of the metabolism changes represented by those factors can be made with respect to HIV or dementia status and thus were excluded from further analysis.
Table 2.
Factor Loadings and Amount of Variance from the Original MR Spectroscopic Imaging Data Set Captured by Each Factor
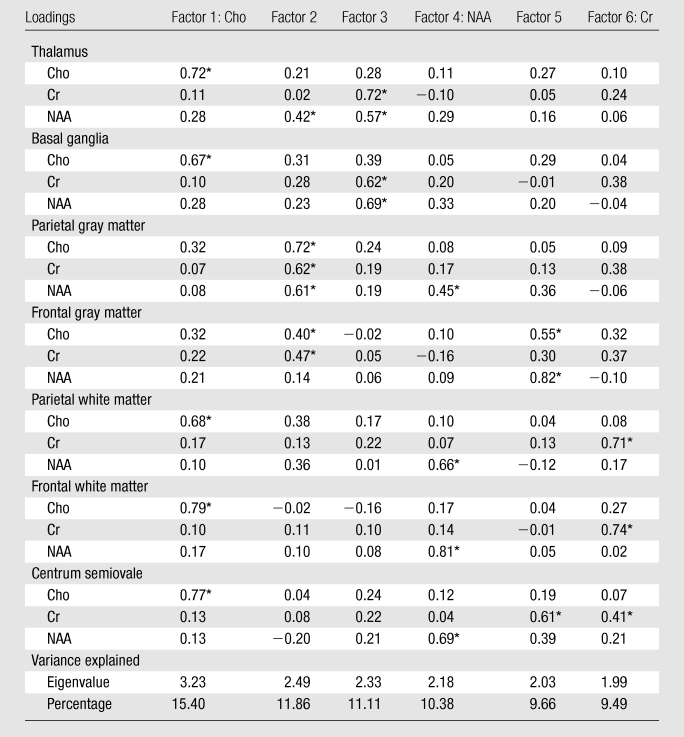
Significant loadings (> 0.4), which indicate the main metabolites involved in each factor.
Table 3.
Relationship between Each Factor and the Three Cohorts
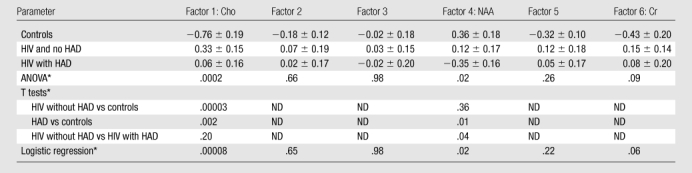
Note.—Unless otherwise indicated, data are the means ± standard error of the mean. HAD = HIV-associated dementia, ND = not determined.
Data are P values. Following Fisher least significant difference method, pairwise comparisons were not examined unless ANOVA findings were deemed significant.
Figure 3:

The Cho factor summarizes metabolic changes in Cho elevations in the thalamus, basal ganglia, and the three white matter regions and is a predictor of chronic HIV infection. Subjects with HIV had significantly higher scores for this factor than healthy controls (left). The NAA factor, which is diagnostic of HIV-associated dementia (HAD), summarizes metabolic changes in NAA levels from all three white matter regions and parietal gray matter. Scores for this factor were significantly lower in HIV-positive subjects with HIV-associated dementia compared with those without HIV-associated dementia, as well as seronegative controls (middle). The Cr factor summarizes metabolic changes in Cr levels from all white matter regions. Differences across cohort for scores of this factor approached but did not reach significance (right). Error bars = standard error of the mean.
Cho factor.—For the Cho factor, all HIV-infected subjects had higher scores and could be differentiated from seronegative control subjects (Table 3, Fig 3). However, no distinction between the two HIV-positive groups could be found with this factor. The loadings for this factor (Table 2) indicate the involvement of Cho from frontal white matter, parietal white matter, centrum semiovale, thalamus, and basal ganglia. Higher scores reflect higher Cho levels, implying that seropositive subjects had higher levels of Cho across these regions compared with control subjects.
NAA factor.—Scores for the NAA factor could distinguish between HIV-infected subjects with and those without dementia (Fig 3, Table 3). Lower scores were associated with dementia. An examination of the loadings (Table 2) demonstrated that this factor heavily reflected involvement of NAA from the frontal white matter, parietal white matter, centrum semiovale, and parietal gray matter. Subjects with HIV-associated dementia tended to have lower levels of NAA in those regions than subjects without dementia.
Cr factor.—The Cr factor was influenced by Cr levels from the three white matter regions: parietal white matter, frontal white matter, and centrum semiovale. Seropositive subjects had higher scores for this factor than control subjects, but the variance summarized in this factor, while exhibiting a trend toward elevated Cr levels in HIV-positive subjects (Fig 3), did not reach statistical significance for determining HIV or dementia status (ANOVA, P = .09; logistic regression, P = .06).
Neurocognitive Test Performance and Correlations with MR Spectroscopic Imaging Factors
A neurocognitive battery covering various cognitive domains was performed on all HIV-positive subjects (Table 4). Six of the nine tests were able to distinguish between HIV-positive subjects with HIV-associated dementia and those without. While little exists in the HIV-associated dementia literature about the association of NAA concentrations to individual neuropsychological tests, NAA ratios with cognitive impairment have been previously reported in single-voxel MR studies (29,30). Psychomotor and executive function test scores correlated best with NAA factor scores (Fig 4). None of the tests correlated with either the Cho or Cr factors.
Table 4.
Summary of Neurocognitive Test Performance between HIV-positive Cohorts
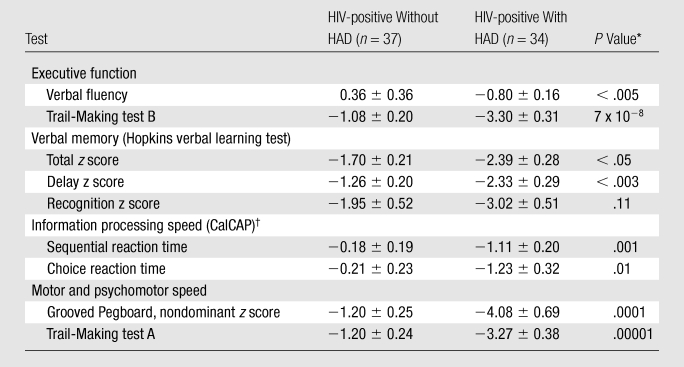
P < .006 is deemed significant due to Bonferroni correction for 9 comparisons.
California computerized assessment package.
Figure 4:

Neuropsychologic tests for psychomotor function (Trail-Making parts A and B) best correlated with NAA factor scores in HIV-positive subjects as determined with Spearman Rank correlation. This factor is heavily influenced by changes in the NAA (a marker of neuronal dysfunction/injury) across the white matter tracts and in parietal gray matter. HAD = HIV-associated dementia.
Correlations between Immunologic Measures
Associations between HIV and HIV-associated dementia-related immune markers (viral load, cytokines, and CD4 levels) and brain metabolism are often examined in the HIV-associated dementia-related literature (31–34). CD4+ T-cell depletion was related to increased HIV RNA levels in the blood (RS = −0.51, P < .00001), but correlation was lacking with respect to viral levels in the CSF (RS = 0.29, P < .03; Bonferroni correction: P < .0009). Subjects with lower CD4+ T-cell counts were also found to have higher plasma (RS = −0.44, P = .0004) and CSF (RS = −0.54, P = .00005) MCP-1 levels. Correlations between plasma viral loads and MCP-1 levels in both the plasma (RS = 0.48, P < .00007) and CSF (RS = 0.45, P < .0009) were observed. However, no correlations between CSF viral load and MCP-1 in either plasma (RS = 0.02, P = .89) or CSF (RS = −0.02, P = .91) were found.
Correlations between MR Spectroscopic Imaging Factors and Immunologic Measures
Neither plasma nor CSF viral loads correlated with the MR factors. CD4+ T-cell counts correlated with Cho factor scores (RS = −0.44, P = .0002; Fig 5). An association between Cr factor scores and MCP-1 in CSF (RS = 0.45, P = .0008) was observed but not in the plasma (RS = 0.19, P = .14). NAA factor scores in HIV-positive subjects did not correlate with the CD4+ T-cell counts or MCP-1 levels in either blood or CSF (RS = −0.25, P = .07; Bonferroni correction: P < .0015).
Figure 5:

CD4+ T-cell levels were highly correlated with Cho factor scores (left), indicating that as immunosuppression occurs, Cho concentrations increase in many regions, regardless of the presence of dementia. MCP-1 levels correlated with Cr factor scores (right), which showed increases in Cr across the white matter regions of HIV-positive subjects. HAD = HIV-associated dementia.
Discussion
Interpretation of Regional Metabolism Changes
The primary finding of this study is that factor analysis is a powerful method for the evaluation of regional variations in MR spectroscopic imaging data obtained in those with HIV and HIV-associated dementia. The Cho factor (heavily influenced by Cho levels in frontal white matter, parietal white matter, centrum semiovale, thalamus, and basal ganglia) implies that Cho elevations are observed across these regions in chronically HIV-infected subjects, regardless of dementia. In contrast, the NAA factor (influenced largely by NAA levels in frontal white matter, parietal white matter, centrum semiovale, and parietal gray matter) was able to produce scores that could differentiate HIV-positive individuals with and without dementia. These results imply that lower NAA levels are observed across white matter regions and in parietal gray matter of those with dementia. Interestingly, subjects with lower NAA factor scores performed more poorly on psychomotor and executive function tests than those with higher NAA factor scores. The Cr factor, while suggesting higher scores in all HIV-infected subjects (elevation in Cr across the frontal white matter, parietal white matter, and centrum semiovale), did not reach significance. However, results from the Cr factor do provide further support to the contention that Cr may not be a stable marker with this disease (8). These regional variations are in agreement with findings of previous single-voxel MR spectroscopic studies that investigated metabolite concentrations in frontal white matter (8,9) and basal ganglia (2,35). As a whole, these results highlight the importance of white matter involvement in HIV-associated dementia.
Interestingly, metabolites in the frontal gray matter did not aid greatly in distinguishing between cohorts. Structural MR imaging has shown a more pronounced effect on white matter and deep gray matter regions during later stages of this disease; however, cortical thinning correlating with CD4+ T-cell decline has been reported (36,37). Some brain regions can be difficult to measure with MR spectroscopic imaging because of field inhomogeneity near interfaces of greatly differing signal, which may help explain the lack of cortical gray matter metabolism findings in both the Cho and NAA factors.
Previous factor analysis results from the HIV MRS Consortium identified three metabolic patterns by using ratios from single-voxel MR spectroscopy: One reflected “inflammatory” metabolism (myo-inositol/Cr and Cho/Cr elevations in centrum semiovale and parietal cortex), another factor described “basal ganglia” metabolism (NAA/Cr and Cho/Cr elevations in basal ganglia), and a third described “neuronal” metabolism (NAA/Cr reductions in centrum semiovale and parietal cortex) (21). Logistic regressions indicated that basal ganglia and neuronal factors were strongly associated with dementia. While the results from this study provide support for the neuronal factor, NAA and Cr concentrations within the deep gray matter regions were not associated with HIV-associated dementia for this population.
Correlation of MR Factors with Immunologic Markers
Attempts to relate MR spectroscopic measurements with clinical HIV measures historically include CD4+ T-cell counts and viral RNA levels. Lower CD4+ T-cell counts have been associated with elevations in frontal white matter Cho, Cr, and myo-inositol levels (glial and energy-associated metabolites), elevations in frontal gray matter Cho, and occasionally declining frontal white matter NAA (2,6,8). Elevated Cho scores in these subjects correlated with a decline in CD4+ T-cell counts. This negative correlation, together with our findings of higher Cho scores resulting from Cho levels across deep gray and white matter regions, could suggest that glial and inflammatory mechanisms (trafficking of monocyte and/or macrophages, activation of microglia, and astrogliosis) are occurring over many brain regions and become more pronounced as CD4 function deteriorates during chronic infection. Viral levels were found not to correlate well with any MR spectroscopic factor. Plasma or CSF viral loads have never provided a particularly good or consistent correlate with MR spectroscopic findings, especially in light of antiretroviral therapy changing the dynamics of classic HIV markers (38,39).
Involvement of cytokines such as TNF-α and MCP-1 in the pathogenesis of HIV-associated neurocognitive disorders has been well documented (40), though few HIV MR studies have explored correlation of these with cerebral metabolites (7,41). An association between plasma TNF-α and MCP-1 levels with white matter and basal ganglia changes detected with diffusion tensor imaging in HIV subjects was recently reported (42). Soluble TNF-α type II receptor (not TNF-α directly) within the blood was associated with Cho/Cr levels in HIV-positive subjects (41). However, the current dataset observed no association between TNF-α and any MR spectroscopic factor. Instead, a correlation emerged suggesting that higher MCP-1 levels in CSF were associated with higher Cr factor scores. Because of evidence that treatment with antiretroviral therapy may confound attempts at establishing relationships between metabolic and immunologic markers, further longitudinal studies are required to explore that conjecture (7). While this study would have been bolstered by immunologic measurements in seronegative control subjects, by not pursuing these, the assumption was made that cytokine levels are not directly related to metabolite levels outside of this disease model.
Factor Analysis Limitations
While the reduction of variables and the identification of interrelated variables make factor analysis an attractive technique, there are limitations. Reduction techniques such as factor analysis should be used when the objective of the study is not to investigate the role of each parameter but the role of the underlying mechanism (ie, the effect of the virus on brain metabolism). Therefore, a defined theoretical model of the disease examined and an understanding of the techniques used are imperative. Since factor analysis cannot identify causality and depending on an individual’s view of a disease model, it is possible for more than one interpretation to be made from the same data. Factor analysis can only be as good as the data allow. Therefore, quality assurance of both the instrument and data processing is vital. Exploratory factor analysis (as performed herein) can create composite measures for multidimensional phenomena, but the resultant structure pattern and its interpretation require confirmation from further studies. Further information on both the use and limitations of factor analysis has been published (43–47).
In conclusion, by applying factor analysis to MR spectroscopic imaging one combines the advantages of MR spectroscopic imaging with a powerful analytic method to study HIV-associated neurocognitive disorders comprehensively, relating brain metabolism to immune response and behavior while exploring distinct disease profiles in a multidimensional dataset (metabolites across regions). Through factor analysis, MR spectroscopic imaging data can reveal differences between uninfected individuals, those chronically infected with HIV, and those with HIV-associated dementia and provides information on the spatial distribution of metabolic changes within these subjects.
Advances in Knowledge.
Three factors with functional significance, strongly related to the magnetic resonance (MR) spectroscopic imaging metabolites of N-acetylaspartate (NAA), Choline (Cho), and Creatine (Cr), emerged from the measured variables.
The NAA factor enabled differentiation between human immunodeficiency virus (HIV)-positive individuals with and without dementia.
The Cho factor allowed distinction between HIV-positive and HIV-negative individuals.
The Cr factor demonstrated a trend toward elevated levels in HIV-positive individuals.
Implications for Patient Care.
Factors derived from MR spectroscopic imaging experiments can be used as surrogate markers for prognosis and therapeutic monitoring of patients with HIV-associated dementia. The NAA factor may be particularly useful in this regard, by enabling distinction within the HIV-positive group between those with and those without dementia.
Through factor analysis MR spectroscopic imaging data can reveal differences between uninfected individuals, those chronically infected with HIV and those with HIV-associated dementia and provides information on the spatial distribution of metabolic changes within these subjects.
Acknowledgments
We thank Mahaveer Degaonkar, PhD, for recording and analyzing the MR spectroscopic data, and who was inadvertently omitted from the author list. We also thank Katherine Conant, MD, for her efforts in measuring and analyzing the cytokine data associated with this article.
Received October 20, 2008; revision requested December 17; revision received July 23, 2009; accepted August 19; final version accepted August 28.
Funding: This research was supported by the National Institutes of Health [grants R01 MH61438 and K25 NS051129]
Authors stated no financial relationship to disclose.
Abbreviations:
- ANOVA
- analysis of variance
- Cho
- choline
- Cr
- creatine
- CSF
- cerebrospinal fluid
- HIV
- human immunodeficiency virus
- MSK
- Memorial Sloan-Kettering
- TNF
- tumor necrosis factor
References
- 1.Buckner CM, Luers AJ, Calderon TM, Eugenin EA, Berman JW. Neuroimmunity and the blood-brain barrier: molecular regulation of leukocyte transmigration and viral entry into the nervous system with a focus on neuroAIDS. J Neuroimmune Pharmacol 2006;1:160–181 [DOI] [PMC free article] [PubMed] [Google Scholar]
- 2.Chang L, Ernst T, Leonido-Yee M, Walot I, Singer E. Cerebral metabolite abnormalities correlate with clinical severity of HIV-1 cognitive motor complex. Neurology 1999;52:100–108 [DOI] [PubMed] [Google Scholar]
- 3.Chang L, Lee PL, Yiannoutsos CT, et al. A multicenter in vivo proton-MRS study of HIV-associated dementia and its relationship to age. Neuroimage 2004;23:1336–1347 [DOI] [PubMed] [Google Scholar]
- 4.Tracey I, Carr CA, Guimaraes AR, Worth JL, Navia BA, Gonzalez RG. Brain choline-containing compounds are elevated in HIV-positive patients before the onset of AIDS dementia complex: a proton magnetic resonance spectroscopic study. Neurology 1996;46:783–788 [DOI] [PubMed] [Google Scholar]
- 5.Wu Y, Storey P, Cohen BA, Epstein LG, Edelman RR, Ragin AB. Diffusion alterations in corpus callosum of patients with HIV. AJNR Am J Neuroradiol 2006;27:656–660 [PMC free article] [PubMed] [Google Scholar]
- 6.Chang L, Ernst T, Leonido-Yee M, et al. Highly active antiretroviral therapy reverses brain metabolite abnormalities in mild HIV dementia. Neurology 1999;53:782–789 [DOI] [PubMed] [Google Scholar]
- 7.Chang L, Ernst T, St Hillaire C, Conant K. Antiretroviral treatment alters relationship between MCP-1 and neurometabolites in HIV patients. Antivir Ther 2004;9:431–440 [DOI] [PubMed] [Google Scholar]
- 8.Chang L, Ernst T, Witt MD, Ames N, Gaiefsky M, Miller E. Relationships among brain metabolites, cognitive function, and viral loads in antiretroviral-naive HIV patients. Neuroimage 2002;17:1638–1648 [DOI] [PubMed] [Google Scholar]
- 9.Chang L, Ernst T, Witt MD, et al. Persistent brain abnormalities in antiretroviral-naive HIV patients 3 months after HAART. Antivir Ther 2003;8:17–26 [PubMed] [Google Scholar]
- 10.Lentz MR, Lee V, Westmoreland SV, Ratai EM, Halpern EF, Gonzalez RG. Factor analysis reveals differences in brain metabolism in macaques with SIV/AIDS and those with SIV-induced encephalitis. NMR Biomed 2008;21:878–887 [DOI] [PMC free article] [PubMed] [Google Scholar]
- 11.Baer L. Factor analysis of symptom subtypes of obsessive compulsive disorder and their relation to personality and tic disorders. J Clin Psychiatry 1994;55(suppl):18–23 [PubMed] [Google Scholar]
- 12.Genser B, Cooper PJ, Yazdanbakhsh M, Barreto ML, Rodrigues LC. A guide to modern statistical analysis of immunological data. BMC Immunol 2007;8:27. [DOI] [PMC free article] [PubMed] [Google Scholar]
- 13.Byrne BM. Factor analytic models: viewing the structure of an assessment instrument from three perspectives. J Pers Assess 2005;85:17–32 [DOI] [PubMed] [Google Scholar]
- 14.Lloyd DG, Golfis G, Knox AJ, Fayne D, Meegan MJ, Oprea TI. Oncology exploration: charting cancer medicinal chemistry space. Drug Discov Today 2006;11:149–159 [DOI] [PubMed] [Google Scholar]
- 15.Hanley AJ, Karter AJ, Festa A, et al. Factor analysis of metabolic syndrome using directly measured insulin sensitivity: The Insulin Resistance Atherosclerosis Study. Diabetes 2002;51:2642–2647 [DOI] [PubMed] [Google Scholar]
- 16.Dennis JL, Oien KA. Hunting the primary: novel strategies for defining the origin of tumours. J Pathol 2005;205:236–247 [DOI] [PubMed] [Google Scholar]
- 17.Griffin JL. Metabolic profiles to define the genome: can we hear the phenotypes?. Philos Trans R Soc Lond B Biol Sci 2004;359:857–871 [DOI] [PMC free article] [PubMed] [Google Scholar]
- 18.Confort-Gouny S, Vion-Dury J, Nicoli F, Dano P, Gastaut JL, Cozzone PJ. Metabolic characterization of neurological diseases by proton localized NMR spectroscopy of the human brain. C R Acad Sci III 1992;315:287–293 [PubMed] [Google Scholar]
- 19.Confort-Gouny S, Vion-Dury J, Nicoli F, et al. A multiparametric data analysis showing the potential of localized proton MR spectroscopy of the brain in the metabolic characterization of neurological diseases. J Neurol Sci 1993;118:123–133 [DOI] [PubMed] [Google Scholar]
- 20.Salvan AM, Lamoureux S, Michel G, Confort-Gouny S, Cozzone PJ, Vion-Dury J. Localized proton magnetic resonance spectroscopy of the brain in children infected with human immunodeficiency virus with and without encephalopathy. Pediatr Res 1998;44:755–762 [DOI] [PubMed] [Google Scholar]
- 21.Yiannoutsos CT, Ernst T, Chang L, et al. Regional patterns of brain metabolites in AIDS dementia complex. Neuroimage 2004;23:928–935 [DOI] [PubMed] [Google Scholar]
- 22.Sacktor N, McDermott MP, Marder K, et al. HIV-associated cognitive impairment before and after the advent of combination therapy. J Neurovirol 2002;8:136–142 [DOI] [PubMed] [Google Scholar]
- 23.Conant K, Garzino-Demo A, Nath A, et al. Induction of monocyte chemoattractant protein-1 in HIV-1 Tat-stimulated astrocytes and elevation in AIDS dementia. Proc Natl Acad Sci U S A 1998;95:3117–3121 [DOI] [PMC free article] [PubMed] [Google Scholar]
- 24.Duyn JH, Gillen J, Sobering G, van Zijl PC, Moonen CT. Multisection proton MR spectroscopic imaging of the brain. Radiology 1993;188:277–282 [DOI] [PubMed] [Google Scholar]
- 25.Soher BJ, van Zijl PC, Duyn JH, Barker PB. Quantitative proton MR spectroscopic imaging of the human brain. Magn Reson Med 1996;35:356–363 [DOI] [PubMed] [Google Scholar]
- 26.Kreis R, Ernst T, Ross BD. Absolute quantitation of water and metabolites in the human brain. II. Metabolite concentrations. J Magn Reson B 1993;102:9–19 [Google Scholar]
- 27.Kaiser HF. The varimax criterion for analytic rotation in factor analysis. Psychometrika 1958;23:187–200 [Google Scholar]
- 28.Coste J, Bouee S, Ecosse E, Leplege A, Pouchot J. Methodological issues in determining the dimensionality of composite health measures using principal component analysis: case illustration and suggestions for practice. Qual Life Res 2005;14:641–654 [DOI] [PubMed] [Google Scholar]
- 29.Paul RH, Yiannoutsos CT, Miller EN, et al. Proton MRS and neuropsychological correlates in AIDS dementia complex: evidence of subcortical specificity. J Neuropsychiatry Clin Neurosci 2007;19:283–292 [DOI] [PubMed] [Google Scholar]
- 30.Sacktor N, Skolasky RL, Ernst T, et al. A multicenter study of two magnetic resonance spectroscopy techniques in individuals with HIV dementia. J Magn Reson Imaging 2005;21:325–333 [DOI] [PubMed] [Google Scholar]
- 31.Cinque P, Bestetti A, Marenzi R, et al. Cerebrospinal fluid interferon-gamma-inducible protein 10 (IP-10, CXCL10) in HIV-1 infection. J Neuroimmunol 2005;168:154–163 [DOI] [PubMed] [Google Scholar]
- 32.Griffin DE, Wesselingh SL, McArthur JC. Elevated central nervous system prostaglandins in human immunodeficiency virus-associated dementia. Ann Neurol 1994;35:592–597 [DOI] [PubMed] [Google Scholar]
- 33.Letendre SL, Lanier ER, McCutchan JA. Cerebrospinal fluid beta chemokine concentrations in neurocognitively impaired individuals infected with human immunodeficiency virus type 1. J Infect Dis 1999;180:310–319 [DOI] [PubMed] [Google Scholar]
- 34.Sporer B, Kastenbauer S, Koedel U, Arendt G, Pfister HW. Increased intrathecal release of soluble fractalkine in HIV-infected patients. AIDS Res Hum Retroviruses 2003;19:111–116 [DOI] [PubMed] [Google Scholar]
- 35.Meyerhoff DJ, Bloomer C, Cardenas V, Norman D, Weiner MW, Fein G. Elevated subcortical choline metabolites in cognitively and clinically asymptomatic HIV+ patients. Neurology 1999;52:995–1003 [DOI] [PubMed] [Google Scholar]
- 36.Thompson PM, Dutton RA, Hayashi KM, et al. Thinning of the cerebral cortex visualized in HIV/AIDS reflects CD4+ T lymphocyte decline. Proc Natl Acad Sci U S A 2005;102:15647–15652 [DOI] [PMC free article] [PubMed] [Google Scholar]
- 37.Filippi CG, Sze G, Farber SJ, Shahmanesh M, Selwyn PA. Regression of HIV encephalopathy and basal ganglia signal intensity abnormality at MR imaging in patients with AIDS after the initiation of protease inhibitor therapy. Radiology 1998;206:491–498 [DOI] [PubMed] [Google Scholar]
- 38.Sevigny JJ, Albert SM, McDermott MP, et al. Evaluation of HIV RNA and markers of immune activation as predictors of HIV-associated dementia. Neurology 2004;63:2084–2090 [DOI] [PubMed] [Google Scholar]
- 39.Sevigny JJ, Albert SM, McDermott MP, et al. An evaluation of neurocognitive status and markers of immune activation as predictors of time to death in advanced HIV infection. Arch Neurol 2007;64:97–102 [DOI] [PubMed] [Google Scholar]
- 40.Kaul M, Zheng J, Okamoto S, Gendelman HE, Lipton SA. HIV-1 infection and AIDS: consequences for the central nervous system. Cell Death Differ 2005;12(suppl 1):878–892 [DOI] [PubMed] [Google Scholar]
- 41.Ryan LA, Zheng J, Brester M, et al. Plasma levels of soluble CD14 and tumor necrosis factor-alpha type II receptor correlate with cognitive dysfunction during human immunodeficiency virus type 1 infection. J Infect Dis 2001;184:699–706 [DOI] [PubMed] [Google Scholar]
- 42.Ragin AB, Wu Y, Storey P, Cohen BA, Edelman RR, Epstein LG. Monocyte chemoattractant protein-1 correlates with subcortical brain injury in HIV infection. Neurology 2006;66:1255–1257 [DOI] [PMC free article] [PubMed] [Google Scholar]
- 43.Costello AB, Osborne JW. Best practices in exploratory factor analysis: four recommendations for getting the most from your analysis. Pract Assess Res Eval 2005;10:1–9 [Google Scholar]
- 44.Fabrigar LR, Wegener DT, MacCallum RC, Strahan EJ. Evalutating the use of exploratory factor analysis in psychological research. Psychol Methods 1999;4:272–299 [Google Scholar]
- 45.MacCallum RC, Widaman KF, Zhang SB, Hong SH. Sample size in factor analysis. Psychol Methods 1999;4:84–99 [Google Scholar]
- 46.Mulaik SA. Blurring the distinctions between component analysis and common factor-analysis. Multivariate Behav Res 1990;25:53–59 [DOI] [PubMed] [Google Scholar]
- 47.Widaman KF. Common factor analysis versus principal component analysis: differential bias in representing model parameters?. Multivariate Behav Res 1993;28:263–311 [DOI] [PubMed] [Google Scholar]