Abstract
Multivariate Bayesian models trained with machine learning, in conjunction with rule-based time-series statistical techniques, are explored for the purpose of improving patient monitoring. Three vital sign data streams and known outcomes for 36 intensive care unit (ICU) patients were captured retrospectively and used to train a set of Bayesian net models and to construct time-series models. Models were validated on a reserved dataset from 16 additional patients. Receiver operating characteristic (ROC) curves were calculated. Area under the curve (AUC) was 91% for predicting improving outcome. The model’s AUC for predicting declining outcome increased from 70% to 85% when the model was indexed to personalized baselines for each patient. The rule-based trending and alerting system was accurate 100% of the time in alerting a subsequent decline in condition. These techniques promise to improve the monitoring of ICU patients with high-sensitivity alerts, fewer false alarms, and earlier intervention.
Introduction
Because it is not feasible to have continual one-on-one staff to patient care even in areas of the hospital that house critical patients, bedside monitors are relied upon heavily to alert staff members of potential patient deterioration or need for help. Existing monitors, however, have been found to be poor indicators of patient need due to high false alarm rates1,2. Frequent false alerts not only hinder effective work, but also decrease the usefulness of alerts from conditioning of staff that alarms are insignificant.
Imhoff et al. have recently reviewed work in this area, stressing that “major improvements in alarm algorithms are urgently needed.”2 The goal of this project is to develop an ‘intelligent’ monitoring system using multivariate time-series data in conjunction with Bayesian techniques to learn when critical patients are improving versus declining to effect better alerting systems and thus improve patient care. This is achieved through development of machine-learning-based models that learn from time-series patient data to develop personal baselines and trends, and that alert on exceptions to personal and peer-group population-based norms.
Personal baselines of different vital signs, such as blood pressure (BP) or temperature (T), may deviate from population norms. They may converge back toward population norms in recovery [such as heart rate (HR) after hypovolemia has been corrected], or they may deviate further over time (such as BP in poorly controlled hypertension). Setting alerts based on population norms alone could give false alarms for recovering patients. Alerts based on deviations from personal baselines, on the other hand, may prove more effective. By incorporating population norms and personal baselines within prediction models, normal and abnormal deviations in both can be identified and considered. These deviations might indicate sudden changes in medical condition requiring staff intervention and therefore may prove to be better components of improved patient monitoring systems compared to traditional monitors that alert on simple thresholds alone.
The rest of this paper describes the study methods, results (with presentation of rules and models developed and performance metrics), and discussion of impressions, limitations, and future directions.
Methods
Clinical data were collected retrospectively at Virginia Commonwealth University (VCU)/Medical College of Virginia in Richmond, VA, a Level One Trauma facility, after Institutional Review Board approval. Patients meeting inclusion criteria (adult patients admitted for a serious injury or illness requiring ICU admission) between December 2005 to January 2006 were included. Patients were excluded if they did not stay in the ICU for at least two consecutive days or did not have stored monitor data in VCU’s clinical information system.
The ICU patient monitoring devices as routinely used at VCU continued to be in use during the study; no additions or deletions of monitoring devices occurred for study purposes. Data were blinded with a de-identified, coded ID number assigned to each patient. Collected information included: patient’s age, gender, admission diagnosis; vital sign data collected up to every four hours for two weeks, or shorter as per the patient’s ICU stay; and outcome (‘Better,’ ‘Same,’ or ‘Worse’) at the end of the monitoring period. T, HR, and arterial oxygen saturation (SpO2) were collected.
Raw data values and their timestamps were retrieved by staff retrospectively from the VCU clinical information system for patients meeting inclusion criteria and were compiled into a database. Outcomes were obtained from review of notes in each corresponding patient’s medical chart.
Raw data streams were then used both directly in rules-based analysis and in development of Bayesian models, and indirectly via study of derived values.
Trends in streams of time-series data were calculated using a standard moving average. Different time windows for the moving average calculation for each physiological variable were tried based on expert opinion after studying sample data streams. Normal and disease state ranges for vital signs were determined by the study’s medical team and then were used as the basis for creating thresholds for alerting algorithms. Multivariable vital sign characteristics and “alertable” thresholds that would be associated with detecting a sudden decline or improvement in a critical patient’s condition were defined. This resulted in a set of rules developed for detection of changing patient condition. These rules were then applied against the entire study dataset.
Bayesian network models were built using the FasterAnalytics system from DecisionQ Corporation (Washington, DC), which learns model structure in an unsupervised fashion, even in the presence of missing data values, to classify relationships between patient data and outcomes. FasterAnalytics does not assume any inter-dependence of input variables, even amongst time-series values; the system deduces dependencies during the learning. Seventy percent of the data were used to train and cross-validate three models: a raw data-based model, a model indexed to normal population values, and a model indexed to personal baselines (comparison with first-data observations). The Bayesian models learn from looking at all variables and classifying their relationships relative to known outcome. The learned probabilities are used to detect high risk of a decline in condition in new patients. Model validation was performed on the reserved 30% of study data.
Performance metrics of interest include sensitivity, specificity, positive predictive value (PPV), accuracy, and AUC. Sensitivity for detecting patient decline equals number of correct Worse predictions divided by number of instances of patient decline. Specificity equals number of correct predictions of non-declining patients divided by number of non-declining patients. PPV is number of correctly labeled declining patients divided by number of labeled declining patients. Accuracy is number of correct model-predicted outcomes divided by number of model-predicted outcomes. AUC values equal area underneath the ROC [sensitivity vs. (1-specificity)] curve.
Results
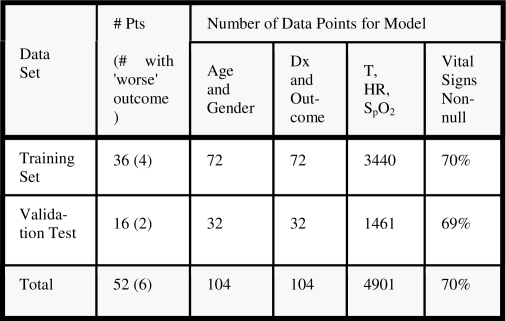
Data from 52 patients in the ICU during the study period were collected. These data were divided into two groups: data from the first 36 patients (69.2%) were used for model learning and cross-validation, while data from the next 16 patients (30.8%) were reserved for validation. Figure 1 shows the breakdown of data for model training and validation.
Figure 1.
Training and validation datasets. The final column shows the percentage of complete records (Pts, patients; Dx, diagnosis).
The time-series, rule-based algorithms derive an individual’s personal baseline via the “real-time” stream of incoming data and calculate trends continuously using a moving average over a two-day period. Over the short term, sudden downturns in a patient’s medical status are detected in deviations from their personal baseline and are calculated in terms of standard deviations or configurable thresholds on a per vital sign basis. In real-time analysis, abnormal values would cause the data sample rate to increase (‘Sentry mode’) as the system seeks confirmation data to mitigate the risk of a transient false value; Sentry mode is simulated in retrospective data processing. Other variables can also be referenced for reinforcement of the potential alert and to minimize false alarms. The resulting rule-based expert system is elaborated in Figures 2–5. Figure 5 depicts the method by which multiple vital signs are considered. Normal distribution of data points is assumed in calculating standard deviations. These time series-based algorithms had an accuracy exceeding 75% in detecting both patient decline and improvement. Table 1 depicts sample output from the clinical confirmation testing performed on the algorithms with real patient data. The output was assessed against the true clinical picture of each patient (initial diagnosis and outcome from patient chart) as well as reviewed using graphed data streams for each patient. The rules correctly correlated with a patient’s actual condition in almost all of the cases. Additionally, the time series trending and alerting algorithms were accurate 100% of the time in alerting for condition decline or monitoring improvement in a patient’s recovery status in the test set.
Figure 2.
Rule-based algorithm for monitoring of body temperature, T (MA, moving average; STD, standard deviation; F, Fahrenheit).
Figure 5.
Rule-based algorithm for integrating results of multiple vital sign algorithms.
Table 1.
Algorithm confirmation results sample.
| Patient ID | Outcome | Sentry/Alert Validation | M.D. Comments |
|---|---|---|---|
| 0 | Better | Yes | Not enough of a drop PO2 to create an alarm |
| 1 | Worse | Yes | Consistently High Tem Not Under Control, Very High HR |
| 2 | Same | Yes | Temp and HR high dropped midpt Pulse Ox decline |
| 3 | Better | Yes | Overall stable condition |
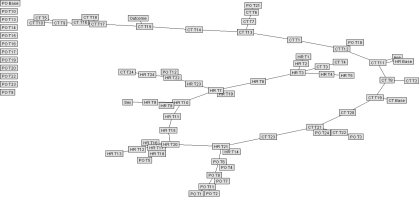
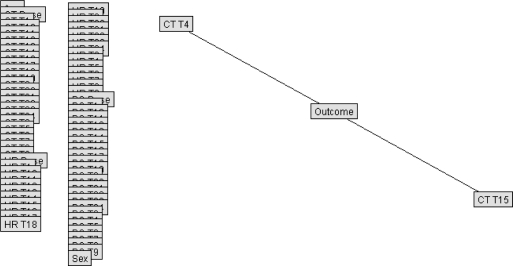
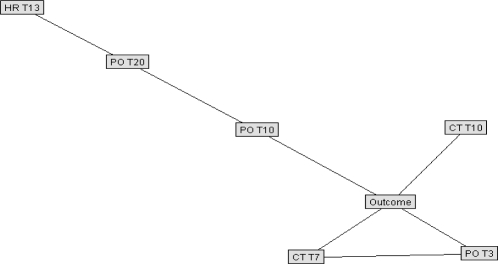
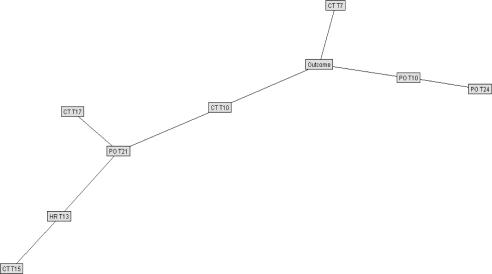
The best Bayesian models were selected for testing on the reserved validation set. Figure 6 is shown for general structure only of a raw data Bayesian model. To improve efficiency of outcome prediction, another model was created using only those variables identified to be most closely correlated with outcome. In the raw data model, only two variables showed conditional dependence: T at the 4th and 15th time periods; a Bayesian network developed with all training cases was then run using only those two variables plus outcome. The resulting simplistic model is shown in Figure 7. Figure 8 shows a simplified Bayesian model indexed to normal population values, in which outcome was most closely related to HR at time period 13, SpO2 at time periods 3, 10, and 20, and T at time periods 7 and 10. Figure 9 shows the simplified model indexed to personal baselines, in which outcome was most closely related to HR at time period 13, SpO2 at times 10, 21, and 24, and T at times 7, 10, 15, and 17.
Figure 6.
Unpruned Bayesian net, raw data model (shown for general structure only; see text). Unlinked nodes were not found to correlate with outcome.
Figure 7.
Simplified Bayesian net, raw data model (CT, core body temperature; T4, time period 4; T15, time period 15). Overlapping boxes/nodes along left edge (representing other available inputs) were not linked to outcome in this model.
Figure 8.
Simplified Bayesian network model, indexed to normal population values. (HR, heart rate; PO, pulse oximeter saturation; CT, core temperature; Tn, time period n; see text for details.)
Figure 9.
Simplified Bayesian network model, indexed to personal baselines. (HR, heart rate; PO, pulse oximeter saturation; CT, core temperature; Tn, time period n; see text for details.)
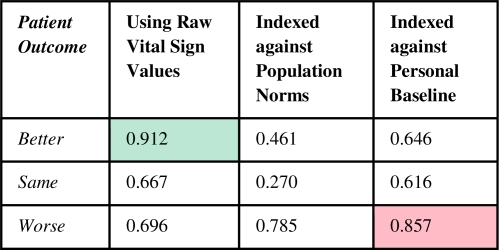
ROC curves were plotted to assess Bayesian net model quality. The graph in Figure 10 shows the ROC curves for the three outcomes in the raw data model. The intersection of the red lines represents the point on the curve for the Better outcome category at which the model can detect 88% of those patients who will improve, with a 38% false positive rate. The “0.462” means the model needs to use a 46.2% threshold value prediction to arrive at that point on the curve. When this threshold is used for detecting a Better outcome, all patients above this threshold did in fact improve, resulting in a 100% PPV. As summarized in Figure 11, the Bayesian model’s AUC to predict an on-track, successfully recovering patient, was 91% in the raw data model and 70% for declining patients. The latter rose above 85% in the model indexed to patient baseline values.
Figure 10.
Raw data model ROC curves (see text).
Figure 11.
Bayesian net analysis AUC results.
Discussion
One of the authors (CTS), in a 2000 report on the promise of machine learning techniques for the development of intelligent alerting, noted the following: “…false alarms tend to occur fleetingly, while true alarms (or events) tend to develop more slowly.”3 This concept has been used as an overall guide to development of models in the current study. The best approach may be two-fold: 1) Time series statistical analysis on individual baselines using ‘sentry sampling’ per configurable thresholds as the first pass for intelligent analysis and alerting in a monitoring system that provides clinical explanations, and 2) Greater reliance on machine learning via Bayesian predictive analysis of outcomes as the amount and variety of patient data collected expands. I.e., a monitor can incorporate both a rule-based system for real-time alerting and a Bayesian classifier to alert predicted patient decline. These can run in parallel, or the latter can be triggered, e.g., by alerting conditions detected by the rules (as in Figure 5).
The predictive models developed for intelligent patient monitoring within this study were successful in alerting potential declines in patient condition. The resulting AUC values indicate that these classifiers, in particular the classifiers using raw data and baseline indexing, have the potential to be very sensitive and specific in identifying patients at risk of an event. Admittedly, the dataset was small. The number of study patients that seriously declined was relatively low, so the model had far fewer examples of a patient with declining condition than a patient with an improving condition. Nevertheless, the results have been encouraging. While more research is needed, it appears that predictive efficacy and classification of improving patients is best represented by the raw data model given that recovering patients appear to be on a progressive and fairly linear track in their vital sign values, whereas declining patients are best predicted by analyzing their personal baselines and the changes from those trends with respect to worsening status. This may be borne out by an analysis of the volatility of the vital signs of unstable patients relative to their own baseline and not population norms (as represented by the normal index model).
Although the current study was based upon a relatively small dataset of 36 patients for the learning phase and 16 patients for the validation testing, the number of inputs available for Bayesian network development was actually much larger. The total number of time-series observations and other features used to classify the data was 3512 in the training set and 1493 in the validation set (see Figure 1).
Incomplete records were anticipated amongst the physiological data streams given that (1) a staff member needed to retrospectively retrieve the data points of interest and enter these into a repository designated for the study, and (2) any one of T, HR, or SpO2 may not have been collected at the specified times of interest; data were obtained once per four hours over a period of up to two weeks per patient to allow for longer-term trending while keeping manageable the data retrieval process. Future work with automated data collection systems would likely mean increased frequency of data values and decreased percentage of incomplete records; these would be expected to improve alerting capabilities.
The FasterAnalytics system notably does not know a priori about time dependencies amongst input values. It is possible, for example, that the model shown in Figure 7 reflects a combination of having very few patients with ‘Worse’ outcome in the training set, combined with the model’s lack of explicit knowledge about the time-series aspect of various inputs; there is not an obvious clinical explanation for why temperature at the 4th and 15th time periods should be particularly predictive of patient decline. Not considering time-series data as temporal may be disadvantageous in the current learning domain, though combined with rules-based time-series techniques as presented (see Figure 5), may still perform well. Future work should involve model development based upon greater numbers of patients (declining as well as total), and also explore use of additional time-series techniques, such as dynamic Bayesian networks.4
Clearly a clinically-useful alerting system would need to work in real time, making predictions based solely upon past and present data rather than future data. One possibility would be for a hybrid system that starts with rules-based analysis until enough time-series values have been processed to develop personalized baselines, for example, for a Bayesian system such as the one presented.
The techniques described here could also be used to improve patient monitoring in other labor-intensive settings, such as the Post-Anesthesia Care Unit, Emergency Department, Cardiac Care Unit, or Operating Room. These types of monitoring techniques, moreover, could be amenable to use in longer-term patient assessment situations, such as in chronic care or rehabilitation facilities. In the community, those who live alone, such as the elderly or mildly cognitively impaired, could benefit directly from (easily-portable) systems that can (ideally, non-intrusively) perform long-term “safety net” monitoring and detect declines in their health. Clearly, the potential is enormous for patient benefit with improved monitoring techniques such as these in the spectrum of care settings. Although additional research into this complex area is needed, the current study provides great promise for the feasibility of developing truly more “intelligent” monitors.
Figure 3.
Rule-based algorithm for monitoring of heart rate, HR (t, tth value; MA, moving average; STD, standard deviation).
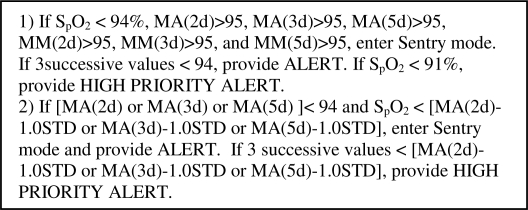
Figure 4.
Rule-based algorithm for monitoring of oxygen saturation, SpO2 [MA(nd), moving average over n days; MM(nd), moving median over n days; STD, standard deviation].
Acknowledgments
The authors would like to thank Loretta Schlachta-Fairchild, RN, PhD, CEO, iTelehealth, Inc., John Eberhardt EVP, DecisionQ Corp., Phil Kalina, DecisionQ Corp., and the AMIA reviewers for their assistance. The authors appreciate DARPA support provided via research contract W31P4Q-06-C-0016.
References
- 1.Siebig S, Kuhls S, Imhoff M, et al. Collection of annotated data in a clinical validation study for alarm algorithms in intensive care--a methodologic framework. J Crit Care. 2009. (in press). [DOI] [PubMed]
- 2.Imhoff M, Kuhls S, Gather U, Fried R. Smart alarms from medical devices in the OR and ICU. Best Pract Res Clin Anaesthesiol. 2009;23:39–50. doi: 10.1016/j.bpa.2008.07.008. [DOI] [PubMed] [Google Scholar]
- 3.Tsien CL.Trendfinder: Automated detection of alarmable trendsLab for Computer Science Tech Report 809, M.I.T., 2000.
- 4.Ghahramani Z. Learning dynamic Bayesian networks. In: Giles CL, Gori M, editors. Adaptive processing of sequences and data structures. Berlin: Springer-Verlag; 1998. pp. 168–197. [Google Scholar]


