Abstract
Critical care environments are inherently complex and dynamic. Assessment of workflow in such environments is not trivial. While existing approaches for workflow analysis such as ethnographic observations and interviewing provide contextualized information about the overall workflow, they are limited in their ability to capture the workflow from all perspectives. This paper presents a tool for automated activity recognition that can provide an additional point of view. Using data captured by Radio Identification (RID) tags and Hidden Markov Models (HMMs), key activities in the environment can be modeled and recognized. The proposed method leverages activity recognition systems to provide a snapshot of workflow in critical care environments. The activities representing the workflow can be extracted and replayed using virtual reality environments for further analysis.
1. Introduction
Workflow in critical care environments such as Emergency Rooms (ER) and Trauma is a source of several avoidable medical errors1. Assessment of workflow and activities can provide valuable insights into improvement of patient safety and efficacy of patient management. Further, clinical workflow visualization can serve as a valuable education tool for residents and nurse trainees. As a result of these possible benefits, researchers use several methods to monitor clinical workflow. These methods include ethnographic data collection, observations, surveys and questionnaires coupled with cognitive task analysis of the processes. These tools can be used to build individual pieces of the workflow centered around the individual and an activity2. However, existing tools are limited in their ability to capture the numerous activities occurring simultaneously in a complex environment. Observations, for example, are gathered from an individual’s point of view and cannot capture all activities occurring at an instance of time. Theoretically, by increasing the number of observers in the critical care environment it is possible to capture information regarding all the activities in the environment. Practically however, more than two observers, in most cases, are considered to be a disturbance in the critical care workflow. In addition, the quality of data captured by these methods is dependent upon the quality of the individual gathering the data. This is yet another limitation of current methodologies. Given the dynamic and interactive nature of critical care environments, in addition to the limitations discussed, current methods of data capture do not provide the optimal solution. With such constraints imposed on data collection in complex environments there is a need for an unobtrusive method of data collection that can augment existing methods and capture workflow from different points of view simultaneously.
Often medicine looks to aviation to provide guidance in increasing reliability and reducing the occurrence of adverse events. One critical component of error analysis in aviation is the black box. The black box refers to devices installed on aircrafts that track both communication within the cockpit of the aircraft as well as performance parameters such as altitude, airspeed and heading. If some tool akin to a black box were available for critical care units, analysis of adverse events would be far more accurate. The ability to automatically track all events that led to the adverse situation would be of great use in workflow modeling, error analysis and training clinical professionals. The method and tools described in this paper is a one solution to this problem.
2. Background
This paper presents a hybrid critical care monitoring system that combines data gathered through observations and Radio Identification (RID) tags to provide a complete picture of the workflow. RID tags provide a means for automatic identification of an entity, in addition to location sensing. In a clinical context, an entity could be a clinician (nurse, physician etc.) or an asset (such as an ultrasound machine). Key entities, through the use of RID tagging, would have capability to identify other tags and store this information.
In the domain of healthcare, tags have been used for tracking patients, equipment and staff to improve efficiency in the case of high-volume emergencies3. Context aware computing is another domain in healthcare where tags are being used, examples being context-aware pill containers, beds and electronic patient records (EPR)3, 4. A system integrating these tools could possibly verify whether the nurse approaching the bed has the right pills and dosage for the patient in the bed by cross-checking the prescription with the EPR. Other applications include using RID based wrist bands for fast and accurate patient identification.3
The applications described use RID tags to obtain proximity information, or identification or simply location. The work presented in this paper, however, takes an alternate approach to location aware computing. We shift the focus from obtaining the exact location of tagged entities to analyzing interactions and their respective activities. The theoretical foundations of this approach are as follows. When modeling workflow, we are interested in the actual activity and the sequence of activities the key players participate in. One method to find these activities is to develop a relation between location of the entity and the subset of activities possible in that location. This is done by studying preliminary ethnographic observations gathered. In this way, base heuristics for activities are gathered and can be used by the system for activity recognition.
In a critical care environment, protocols are followed when a patient is admitted into the unit. These protocols place constraints on the type of activity to be performed and the sequence of activities. For example, when a patient enters an ER unit, there are certain activities that usually occur. Firstly, key members of the patient care team (resident, nurse and so on) gather by the bed of the patient. Following this, examination of patient takes place. A resident may move to the telephone to consult or the nurse may move to the nurse’s station to document details of the encounter. All these activities are linked to entities in the space performing some type of movement in the environment. If we develop a system that can record and analyze movements and link it to known patterns of activities, we can theoretically model the workflow.
A limitation of this approach lies in reliance on movements and patterns of movements. Such an approach will noticeably miss the activities when the entities are not moving. However, in an environment such as critical care, a large percentage of activities do indeed involve movements and activities that don’t involve movements can be captured by an observer. This system in fact eases the burden on the observer who can capture high level cognitive details of examination and leave the low level activity details to the automated system.
In this work, we use Hidden Markov Models (HMM) to analyze the temporal data gathered by the tags and recognize known activities. HMM is a probabilistic modeling method used for temporal sequence analysis, and have been widely used in gesture and speech recognition. A description of this modeling technique is presented in the following subsection along with the rationale for why we chose HMM and how the method is used to solve the problem at hand.
2.1. Hidden Markov Models
The Hidden Markov Model is a finite set of states, each of which is associated with multidimensional probability distributions. Transitions among the states are governed by a set of probabilities called transition probabilities. In a particular state an outcome or observation can be generated, according to the associated probability distribution.
There are three fundamental variables that must be determined to generate a model for this system.
Initial state probability, π– This is a set of probabilities πi, which indicates the probability of the starting or initial state being i. π can be represented by a Nx1 matrix where N is the number of states.
Transition probability, A – A set of probabilities Aij where aij indicates the probability of the operator transitioning from state i to state j. Hence, A is represented by a NxN matrix.
Bias probability, B-a set of probabilities Bi(k) where bi(k) is the probability that symbol k is observed at state i. Hence, B is represented by a NxM matrix, where N is the number of states and M is the number of observation symbols.
The HMM is then represented as λ=(π,A,B), where the observed sequence is modeled as a state machine, wherein the current state is dependent only on the previous state. Using HMM’s requires solution to three basic problems:
Problem 1: Given a model λ= (A,B,π), what is the probability that a given observed sequence O belongs to λ i.e. P(O| λ).
Problem 2: Given, λ= (A,B,π), what is the sequence of states I = {i1, i2, i3, i4 … iT} (T is the number of observed symbols) such that P(O, I| λ) is maximized?
Problem 3: How can the HMM parameters π, A and B be adjusted so as to maximize P(O, I| λ)? This is also known as a training problem or training an HMM.
The current problem at hand is activity recognition using HMMs. The observed sequence in this case is temporal data about encounters obtained from the tags. We use the data gathered for a known set of activities to train separate HMMs for each of the activities. This is done by solving problem 3. Then given sample data, we can identify which HMM is most similar to the sample (problem 1). The following are the steps to train and test HMMs:
Obtain data from tags for specific (marked) activities or motions. This is obtained from qualitative data collected (observations and interviews) in addition to tag data.
Use marked data to set the parameters of the HMM i.e. train the model (Problem 3)
Test the HMM, by evaluating if test data are appropriately recognized (Problem 1)
Algorithm for Testing HMM (Forward-Backward Method)
This method defines a variable αt(i) called the forward variable as follows:
This is the probability of the partial observation sequence up to the position t. At state i at position αt(i) is given by,
α1 (i) = πibi(O1), 1 ≥ i ≥ N
- For t = 1,2,…T-1, 1 ≥ j ≥ N,
- Then,
Step 1 refers to the probability for picking state i and generating O1. The probabilities then generated by step 2 represent transitioning from state at t to state at t+1 and generating Ot+1. Inductively P(O|λ) is found. A backward variable βt(i) is defined as:
This is the probability of sequence from t+1 to T is observed, given the state i at time t and λ. βT (i) is given by,
βT(i) = 1, 1 ≥ i ≥ N
- For t = T-1, T-2, …1, 1 ≥ i ≥ N,
- Then,
Both the forward and backward procedure can solve for P(O|λ) in N2T time. Practically a test sequence is divided into two parts by breaking it in the middle. The first part is solved using the forward variable and the second part is solved using the backward variable. These probabilities are then combined to find the probability of a test sequence being close to the given HMM. As we have a library of HMM’s we find the probability of the test sequence to be close to all the HMM’s in the library. Whichever HMM generates the highest probability for a test sequence is the winning HMM for the given test sequence.
Algorithm for Training HMM (Baum-Welch)
This method is used in the training phase to find the HMM for a particular activity. All the tag data pertaining to a single activity are used to train a HMM for that activity. The function P(O|λ) is called the likelihood function. Assume,
This is the probability of being in state i at time t, given sequence O = O1,O2, … ,OT and λ. From Bayes theorem,
where αt(i) and βt(i) are the forward and backward variables defined previously. We can define a variable ξt(i, j) as,
From derivations6 we get,
It can be seen that summing up γt(i) from t=1 to T provides the number of times state i is visited or summing up only up to T-1 provides the number of transitions out of state i. Similarly, summing ξt(i, j) from t=1 to T-1, the number of transitions from state i to state j is obtained. Therefore,
The re-estimation formulae is as follows
These are the updated parameters for the new HMM. Therefore the algorithm proceeds as follows. Obtain the initial HMM. Calculate A, B and π. Estimate P(O|λ) till a sequence length t. Re-estimate the model and the likelihood function. These steps are done repeatedly until the likelihood function is maximized.
When a tag comes in proximity to the base stations, an event is recorded and the received signal strength indication (RSSI) value is recorded. RSSI value is inversely proportional to distance between the tags. HMMs provide a method by which this data can be processed to reveal the underlying activity. In the following section, activity recognition using HMMs is discussed.
3. Methods
All experiments were performed after obtaining approval from Institutional Review Boards of involved institutions.
3.1. Data Collection
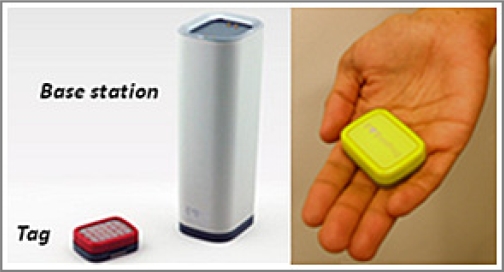
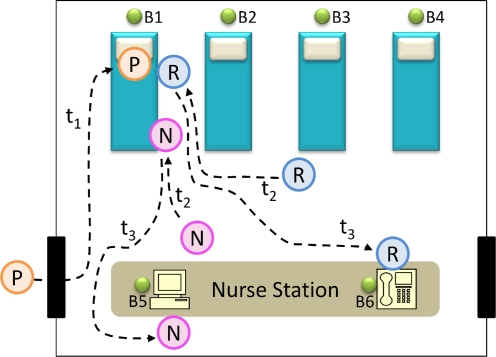
Tag information is obtained from off-the-shelf active RID tags called SNiF (http://www.sniftag.com/) tags (Figure 1). Tags record encounters with other tags (tag-tag encounter) and base stations (tag-base encounter). Base stations can be considered as fixed tags that provide approximate tag location information. We place base stations at critical locations in the environment. This allows for determining activities that pertain to certain regions. The preliminary observations conducted in a trauma unit showed that trauma bays (B1-B4 in Figure 2), nurse’s station (B5 and B6) and entry/exit points were critical areas in the unit. In our study base stations were placed in these locations. Tags were carried by the core clinical team that included the trauma nurse, Intensive Care Unit (ICU) nurse, resident and the attending.
Figure 1.
Active RID (SNiF®) tag and base station
Figure 2.
Activity heuristics for patient arrival
In order to train the HMM’s we recorded movements for certain activities in the critical care unit. We identified fifteen activities that occur in a critical care unit and can be captured by movement analysis. Key activities were identified based on analysis of preliminary ethnographic observations gathered and interviewing. These activities identified could be suitably captured by distinct movement patterns. The activities included arrival of a patient, telephone consult and documentation. These activities revolved around the patient arrival scenario, depicted in Figure 2. ‘P’ refers to the patient; ‘N’ refers to the nurse and ‘R’ to the resident on call. t refers to time instants. When a patient arrives and is placed on a bed, clinicians carrying tags tend to gather around that bed (tj and t2). This can be logged by the tag based system, provided there exists a base station near the bay. Other examples of activities included a resident being near a phone to seek a phone consult (t3) and the nurse sitting near a computer to document cases (t3). These activities have a distinct movement pattern associated with them and we can train an HMM to recognize these activities and label them. As more observations are gathered we can develop heuristics for more complex activities and train the system to recognize the same.
3.2. Training and Testing HMMs
We gathered movement samples for the 15 activities in the ER. 100 samples were gathered for each activity. 50 of these samples were used to train HMM for the activity using the training algorithm. The 50 remaining samples were employed for testing the HMM library. Overall accuracy of the system was determined as the number of correctly recognized activities by the HMM library against the total number of test samples.
3.3. Virtual World Replay
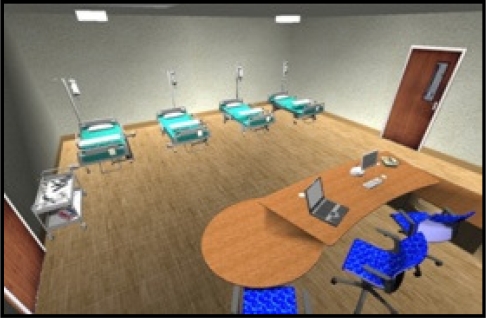
When activities are recognized by the HMM, they can easily be replayed in virtual worlds. A sample virtual trauma unit was created and visualized (Figure 3). We created the trauma room using IRRLicht® Software (www.irrlicht.net). We developed a plug-in for the IRRLicht software that could take the input sequence of activities and then play those activities back in the virtual world using standardized activity animations. This offered an opportunity to visualize the workflow after it has been recorded. This tool can be used for assessment and education purposes.
Figure 3.
Virtual trauma unit for workflow visualization
4. Experimental Results
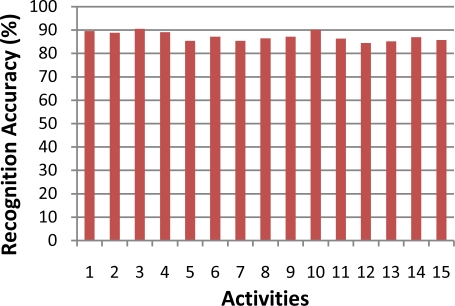
Figure 4 summarizes the recognition accuracy for the 15 motion patterns (maximum 90.5% and minimum 84.5%). When the source of error was analyzed it was found that some of the samples from the training set deviated from their normal movement pattern which introduced errors. Once the deviations were removed from the datasets, we achieved an accuracy of 98.5% at an average. In addition, at each time instant signal strength values for tag-base interactions are recorded for a single tag-base pair. This leaves a sparse matrix for analysis. We used linear interpolation to fill the sparse matrix, which added to the error rate. Our future work includes incorporation of accelerometer (records acceleration of tags) with existing signal strength values in order to improve recognition performance. It was also found that physicians using the virtual world replay perceived the visualization tool to be useful for replaying workflow and activities in an ER. A useful feature of the tool was the ability to find normative workflow and also visualize deviations from the normal workflow pattern.
Figure 4.
Hidden Markov Model based motion recognition percentage
5. Conclusion
The tool presented in the paper for automated workflow extraction makes several key contributions. Firstly, automated workflow recognition to gather information in a passive manner is of great use to cognitive science researchers interested in clinical workflow analysis. Currently the system is capable of augmenting conventional data collection mechanisms to offer rich multidimensional activity data that allows observers to focus on higher level details rather than simply annotating low level activities. Another potential use for this system is an error detection mechanism. Using HMMs models of normative workflow can be created. When deviations from norm are detected, error prone situations could be indicated. For retrospective analysis of data this could direct researchers to key points in the events to be analyzed.
A limitation of the system lies in its inability to detect activities that cannot be fully represented by movements. Future works include improving HMM recognition rates and including audio to enrich information gathered. This will provide richer data and better method to capture and analyze workflow automatically.
Acknowledgments
This work was support in part by the James S. McDonnell Foundation (JSMF 220020152).
References
- 1.Kohn LT, Corrigan JM, Donaldson MS. To Err is Human. Washington, D.C: National Academy Press; 1999. [PubMed] [Google Scholar]
- 2.Malhotra S, Jordan D, Shortliffe E, Patel VL. Workflow modeling in critical care: Piecing together your own puzzle. Journal of Biomedical Informatics. 2007;40(2):81–92. doi: 10.1016/j.jbi.2006.06.002. [DOI] [PubMed] [Google Scholar]
- 3.Al Nahas H, Deogun JS.Radio Frequency Identification Applications in Smart HospitalsComputer-Based Medical Systems, 2007 CBMS ‘07 Twentieth IEEE International Symposium on; 2007; 2007337–42.
- 4.Bricon-Souf N, Newman CR. Context awareness in health care: A review. International Journal of Medical Informatics. 2007;76(1):2–12. doi: 10.1016/j.ijmedinf.2006.01.003. [DOI] [PubMed] [Google Scholar]


