E. cuniculi Iws1, which acts in eukaryotic transcription and mRNA processing and export, has been crystallized and data have been collected to 2.5 Å resolution.
Keywords: Iws1, Encephalitozoon cuniculi, eukaryotic transcription factors, mRNA export factors
Abstract
Transcription elongation by eukaryotic RNA polymerase II requires the coupling of mRNA synthesis and mRNA processing and export. The essential protein Iws1 is at the interface of these processes through its interaction with histone chaperone and elongation factor Spt6 as well as with complexes involved in mRNA processing and export. Upon crystallization of the evolutionarily conserved domain of Iws1 from Encephalitozoon cuniculi, four different crystal forms were obtained. Three of the crystal forms belonged to space group P21 and one belonged to space group P2221. Preliminary X-ray crystallographic analysis of one of the crystal forms allowed the collection of data to 2.5 Å resolution.
1. Introduction
During eukaryotic transcription by RNA polymerase II (RNAPII), mRNA synthesis is tightly linked to chromatin modulation and to mRNA processing and export (Sims et al., 2004 ▶). The essential protein Iws1 (interacts with Spt6; yeast Spn1) is at the interface of these different processes. Firstly, Iws1 forms a complex with Spt6 (Krogan et al., 2002 ▶; Lindstrom et al., 2003 ▶; Yoh et al., 2007 ▶), a protein which is both a putative histone chaperone (Bortvin & Winston, 1996 ▶; Kaplan et al., 2003 ▶; Adkins & Tyler, 2006 ▶) and an elongation factor of RNAPII (Endoh et al., 2004 ▶; Yoh et al., 2007 ▶; Ardehali et al., 2009 ▶). Secondly, Iws1 also interacts with the mRNA processing and export factor REF1/Aly, which then recruits the mRNA surveillance-factor exosome (Yoh et al., 2007 ▶). The Spt6–Iws1 complex travels with elongating RNAPII through binding of the Spt6 SH2 domain to the hyperphosphorylated C-terminal domain (CTD) of the polymerase. Accordingly, depletion of Iws1 or mutation within Spt6 SH2 leads to the accumulation of bulk poly(A)+ RNAs in the nucleus (Yoh et al., 2007 ▶). Furthermore, mammalian Iws1 has also been shown to recruit the HYPB/Setd2 histone methyltransferase to the elongating polymerase. This recruitment is required for H3K36 trimethylation (Yoh et al., 2008 ▶). Thus, formation of the Spt6–Iws1 complex provides an effective means of coupling transcription, epigenetics mechanisms and mRNA processing and export.
In yeast, Iws1 has also been shown to have a role that is independent of Spt6. Indeed, yeast Iws1 affects transcription regulation at the post-recruitment-regulated promoter CYC1, being recruited constitutively in an Spt6-independent manner to this promoter and preventing loading of the chromatin remodelling factor Swi/Snf (Fischbeck et al., 2002 ▶; Zhang et al., 2008 ▶). Interestingly, this recruitment also requires a hyperphosphorylated RNAPII CTD. However, the interaction between Iws1 and its different partners remains unknown in molecular terms.
In yeast, the evolutionarily conserved region of Iws1 has been shown to be sufficient and necessary for growth (Fischbeck et al., 2002 ▶). Surprisingly, the C-terminal domain of this region is homologous in sequence to the N-terminal domains of the transcriptional effectors TFIIS, elongin A and Med26 (Ling et al., 2006 ▶), suggesting that these proteins may act in related transcriptional pathways and may possibly share common interaction partners. Interestingly, the sequence identity between the homologous regions of human Iws1 and human TFIIS is 18% and should be compared with the 20% identity for the same regions of yeast and human TFIIS. This suggests that the structures of the TFIIS regions from yeast and mouse (PDB code 1eo0, Booth et al., 2000 ▶; PDB code 1wjt, M. Yoneyama, N. Tochio, S. Koshiba, M. Inoue, T. Kigawa & S. Yokoyama, unpublished work) could be used for determination of the Iws1 structure by molecular replacement.
Determining the structure of Iws1 is an important requirement for elucidating the role of Iws1 in the various mechanisms that it contributes to. We are studying the Iws1 protein from the yeast-related eukaryotic parasite Encephalitozoon cuniculi. A main characteristic of this organism is the smaller size of its proteins compared with their eukaryotic orthologues, a feature that simplifies structural characterization. Despite their smaller size, these proteins retain most of the features of their orthologues (Romier et al., 2007 ▶). For instance, the evolutionary conserved domain of Iws1 from E. cuniculi is 28% identical to its yeast and human orthologues, whereas 38% identity is observed between the yeast and human domains. Once structural knowledge has been gained on the E. cuniculi proteins, it can then be used for functional studies of the yeast and human proteins (Romier et al., 2007 ▶). Here, we present the cloning, expression, purification, crystallization and preliminary X-ray crystallographic analysis of the evolutionarily conserved E. cuniculi Iws1 domain.
2. Material and methods
2.1. Cloning, expression and purification
The Iws1 gene from E. cuniculi (GenBank CAD26349.1) was amplified by PCR from genomic DNA using the following oligonucleotides: ecIws1-N, 5′-GGA TAT CCA TAT GTC ATT ATT ACG AAA ACG GAA A-3′, and ecIws1-C, 5′-CGC GGA TCC TCA ATC TCC ACC TTC TGG CTT-3′. The amplified full-length construct (amino-acid residues 1–198; ecIws11–198) was cloned into the pnEA-tH vector (Romier et al., 2006 ▶) using NdeI and BamHI restriction sites. The vector provides an N-terminal fusion composed of a hexahistidine tag and a thrombin-cleavage site. Another shorter construct was made using the oligonucleotide ecIws1-ΔN, 5′-GGA TAT CCA TAT GGA CCC TGG GAC TGT TCT GG-3′. This construct encompasses the evolutionarily conserved region of ecIws1 (amino-acid residues 55–198; ecIws155–198). The ecIws155–198 construct was also cloned into the pnEA-tH vector.
For expression, plasmids encoding ecIws11–198 and ecIws155–198 were co-transformed with the pRare vector (Novagen) in Escherichia coli BL21 (DE3) cells (Novagen). 6 l auto-induction (Studier, 2005 ▶) cultures containing 100 µg ml−1 ampicillin and 35 µg ml−1 chloramphenicol were inoculated with co-transformants gathered on Petri dishes and the cells were grown at 310 K to an optical density of 0.4 at 600 nm. The temperature was then lowered to 298 K to allow induced growth overnight. Cells were harvested by centrifugation at 4300g, resuspended in buffer A (10 mM Tris pH 8.0, 400 mM NaCl) and lysed by ultrasonication. The soluble fraction was recovered by high-speed centrifugation at 29 000g and was mixed with 1.5 ml Talon resin (Clontech). After 1 h incubation at 277 K, the supernatant was removed and the resin was washed extensively with buffer A. The resin was then resuspended in 2 ml buffer A and left overnight at 277 K in the presence of 50 U bovine thrombin (Sigma) to cleave off the hexahistidine tag. This cleavage yielded additional residues at the N-terminus of the proteins: Gly-Ser from the thrombin site followed by His-Met from the NdeI cloning site.
The supernatants were recovered and applied onto a Hiload 16/60 Superdex 75 gel-filtration column (GE Healthcare) equilibrated with buffer A containing 2 mM DTT. Protein purity was analyzed by SDS–PAGE and fractions with appropriate purity were pooled and concentrated with Centripreps and Centricons (Millipore) to a final concentration of 20 mg ml−1 as assessed by the Bio-Rad protein assay (Bio-Rad). The monodispersity of the purified sample was confirmed by dynamic light scattering (DLS; DynaPro, Protein Solutions).
2.2. Crystallization
Initial crystallization trials for ecIws155–198 were performed in 96-well sitting-drop plates (Innovaplate) using a Cartesian Honeybee 8+1 robot (Genomics Solutions). The commercial Classics, JCSG+, PACT (Qiagen) and Wizard (Emerald BioSystems) screens were used for screening at 277 and 290 K. For each condition, 200 nl protein solution was mixed with 200 nl reservoir solution and equilibrated against 50 µl reservoir solution. Crystal improvement was carried out using hanging drops (2 µl protein solution mixed with 2 µl reservoir solution) in 24-well plates (Greiner).
2.3. Data collection
All crystals were initially tested for diffraction on ESRF beamline ID14-2. A large range of cryoprotectants were tested for each crystal form. In all cases, the best results were obtained when the mother liquor was supplemented with 20%(m/v) PEG 200. Data collection at high resolution was carried out using crystals belonging to form IV. A full data set was collected from a single crystal on ESRF beamline ID23-1, which was equipped with an ADSC Q315 detector. Data were collected at a wavelength of 0.97530 Å with 1° oscillations over a range of 180°. The data were processed and scaled using the HKL-2000 program package (Otwinowski & Minor, 1997 ▶).
3. Results and discussion
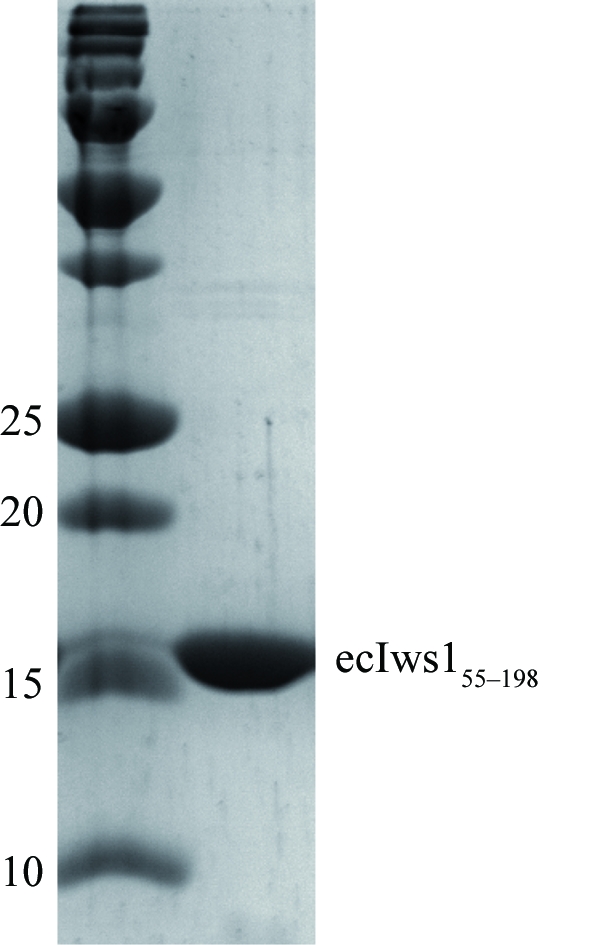
Initial expression and purification experiments using the full-length E. cuniculi Iws1 protein ecIws11–198 showed that it was very rapidly N-terminally degraded. We therefore made a C-terminal construct of this protein that corresponded to the evolutionarily conserved region of Iws1 (ecIws155–198). This domain turned out to be stable throughout purification by affinity and size-exclusion chromatography and yielded 20 mg of protein that was about 95% pure per litre of culture (Fig. 1 ▶).
Figure 1.

Purified ecIws155–198 protein. Molecular-mass markers are shown in the left lane and their corresponding masses are given in kDa.
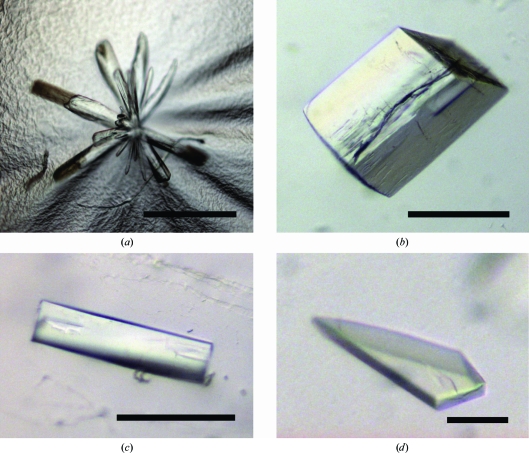
The ecIws155–198 protein could readily be crystallized. Crystals were further refined by varying the pH and the crystallizing agent concentration, yielding an optimal condition composed of 0.1 M sodium citrate pH 5.0, 20%(m/v) PEG 4000 and 8% 2-propanol. At 290 K three-dimensional needles with approximate dimensions of 100 × 20 × 20 µm were observed (crystal form I; Fig. 2 ▶ a). At 297 K two optically different crystal forms were observed in the same droplets: cuboid-shaped crystals with approximate dimensions of 200 × 100 × 100 µm (crystal form II; Fig. 2 ▶ b) and needles with approximate dimensions of 150 × 40 × 40 µm (crystal form III; Fig. 2 ▶ c). All crystals appeared within 1 d and continued to grow for a few days. A major problem that was encountered with all these crystals was that they cracked immediately after removing the cover slip, most likely owing to rapid evaporation of the 2-propanol present in the crystallization condition.
Figure 2.
Different crystal forms obtained upon crystallization of ecIws155–198. (a) Form I (space group P21). (b) Form II (space group P2221). (c) Form III (space group P21). (d) Form IV (space group P21). The black bars represent 100 µm.
Further inspection of the crystallization trials revealed the presence of plate-shaped crystals in a different condition that was refined to 0.1 M MES pH 6.6, 20%(m/v) PEG 8000 and 0.5% ethyl acetate. These crystals grew at 290 and 297 K within two weeks to reach approximate dimensions of 300 × 150 × 20 µm (crystal form IV; Fig. 2 ▶ d). Although these crystals were very fragile, they could be handled more easily than the other crystal forms obtained previously.
The crystal-cracking problems observed with crystals forms I, II and III yielded poor diffraction patterns, notably multiple lattices. Furthermore, although most crystals showed initial diffraction to 2.0–2.3 Å resolution, anisotropic diffraction and rapid crystal decay were commonly encountered. These problems allowed characterization of the different crystal forms but prevented the collection of complete data sets. Crystal forms I and III both belonged to the monoclinic space group P21, but differed in their unit-cell parameters (Table 1 ▶). Calculation of the most probable Matthews coefficients (Matthews, 1968 ▶; Kantardjieff & Rupp, 2003 ▶) showed that crystal forms I and III are most likely to contain four and two molecules per asymmetric unit, respectively. Crystal form II belonged to the orthorhombic space group P2221 and calculation of the Matthews coefficient suggested the presence of one molecule per asymmetric unit (Table 1 ▶).
Table 1. Crystal forms of ecIws155–198 .
| Crystal form | Form I | Form II | Form III | Form IV |
|---|---|---|---|---|
| Crystallization condition | 0.1 M sodium citrate pH 5.0, 20% PEG 4000, 8% 2-propanol | 0.1 M MES pH 6.6, 20% PEG 8000, 0.5% ethyl acetate | ||
| Space group | P21 | P2221 | P21 | P21 |
| Crystal system | Monoclinic | Orthorhombic | Monoclinic | Monoclinic |
| Unit-cell parameters | ||||
| a (Å) | 43.0 | 82.5 | 33.7 | 41.9 |
| b (Å) | 125.4 | 53.1 | 128.8 | 220.0 |
| c (Å) | 55.7 | 35.1 | 33.6 | 71.8 |
| β (°) | 91.7 | 90 | 101.2 | 102.4 |
| Molecules per ASU† | 4 | 1 | 2 | 8 |
| Matthews coefficient† (Å3 Da−1) | 2.25 | 2.30 | 2.14 | 2.42 |
| Solvent content (%) | 45.3 | 46.6 | 42.6 | 49.2 |
| Maximum diffraction (Å) | 2.00 | 2.20 | 2.30 | 2.50 |
The number of molecules per asymmetric unit was chosen as the most probable solution obtained from the analysis of Kantardjieff & Rupp (2003 ▶) and was used for calculation of the most probable Matthews coefficient.
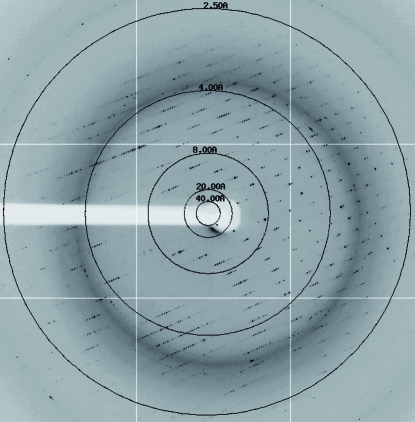
In contrast, the fourth crystal form yielded crystals that could be used for data collection (a representative diffraction pattern is presented in Fig. 3 ▶). These crystals also belonged to the monoclinic space group P21 but were different from crystal forms I and III and were characterized by a long b axis of 220 Å (Table 1 ▶). Diffraction data with good statistics were obtained in the resolution range 30–2.5 Å (Table 2 ▶). Calculation of the most probable Matthews coefficient suggested the presence of more than four molecules per asymmetric unit (Table 1 ▶). A self-rotation analysis showed the presence of two clear twofold axes but could not help to resolve the exact number of molecules per asymmetric unit.
Figure 3.
Diffraction pattern obtained with crystal form IV (space group P21). The resolution rings displayed are at 40.0, 20.0, 8.0, 4.0 and 2.5 Å.
Table 2. Experimental X-ray data for crystal form IV.
Values in parentheses are for the highest resolution shell.
| Resolution range (Å) | 30.0–2.50 (2.59–2.50) |
| Total observations | 130808 |
| Unique reflections | 43576 (4385) |
| Multiplicity | 3.0 (2.7) |
| Completeness (%) | 99.3 (99.7) |
| Rmerge (%) | 6.2 (36.4) |
| I/σ(I) | 20.6 (3.5) |
Owing to the partial sequence homology between Iws1 and TFIIS, structure determination was attempted using the NMR structures of yeast and mouse TFIIS domain I available in the Protein Data Bank (PDB codes 1eo0 and 1wjt, respectively). However, no satisfactory solution was found. Therefore, we are now concentrating on obtaining experimental phases for the structure determination of ecIws155–198.
Acknowledgments
This work was supported by institutional funds from the Centre National de la Recherche Scientifique (CNRS), the Institut National de la Santé et de la Recherche Médicale (INSERM) and the Université de Strasbourg (UDS) as well as the European Commission SPINE2-Complexes project (contract No. LSHG-CT-2006-031220).
References
- Adkins, M. W. & Tyler, J. K. (2006). Mol. Cell, 21, 405–416. [DOI] [PubMed]
- Ardehali, M. B., Yao, J., Adelman, K., Fuda, N. J., Petesch, S. J., Webb, W. W. & Lis, J. T. (2009). EMBO J.28, 1067–1077. [DOI] [PMC free article] [PubMed]
- Booth, V., Koth, C. M., Edwards, A. M. & Arrowsmith, C. H. (2000). J. Biol. Chem.275, 31266–31268. [DOI] [PubMed]
- Bortvin, A. & Winston, F. (1996). Science, 272, 1473–1476. [DOI] [PubMed]
- Endoh, M. et al. (2004). Mol. Cell. Biol.24, 3324–3336. [DOI] [PMC free article] [PubMed]
- Fischbeck, J. A., Kraemer, S. M. & Stargell, L. A. (2002). Genetics, 162, 1605–1616. [DOI] [PMC free article] [PubMed]
- Kantardjieff, K. A. & Rupp, B. (2003). Protein Sci.12, 1865–1871. [DOI] [PMC free article] [PubMed]
- Kaplan, C. D., Laprade, L. & Winston, F. (2003). Science, 301, 1096–1099. [DOI] [PubMed]
- Krogan, N. J., Kim, M., Ahn, S. H., Zhong, G., Kobor, M. S., Cagney, G., Emili, A., Shilatifard, A., Buratowski, S. & Greenblatt, J. F. (2002). Mol. Cell. Biol.22, 6979–6992. [DOI] [PMC free article] [PubMed]
- Lindstrom, D. L., Squazzo, S. L., Muster, N., Burckin, T. A., Wachter, K. C., Emigh, C. A., McCleery, J. A., Yates, J. R. III & Hartzog, G. A. (2003). Mol. Cell. Biol.23, 1368–1378. [DOI] [PMC free article] [PubMed]
- Ling, Y., Smith, A. J. & Morgan, G. T. (2006). Nucleic Acids Res.34, 2219–2229. [DOI] [PMC free article] [PubMed]
- Matthews, B. W. (1968). J. Mol. Biol.33, 491–497. [DOI] [PubMed]
- Otwinowski, Z. & Minor, W. (1997). Methods Enzymol.276, 307–326. [DOI] [PubMed]
- Romier, C. et al. (2006). Acta Cryst. D62, 1232–1242. [DOI] [PubMed]
- Romier, C., James, N., Birck, C., Cavarelli, J., Vivarès, C., Collart, M. A. & Moras, D. (2007). J. Mol. Biol.368, 1292–1306. [DOI] [PubMed]
- Sims, R. J. III, Belotserkovskaya, R. & Reinberg, D. (2004). Genes Dev.18, 2437–2468. [DOI] [PubMed]
- Studier, F. W. (2005). Protein Expr. Purif.41, 225–232. [DOI] [PubMed]
- Yoh, S. M., Cho, H., Pickle, L., Evans, R. M. & Jones, K. A. (2007). Genes Dev.21, 160–174. [DOI] [PMC free article] [PubMed]
- Yoh, S. M., Lucas, J. S. & Jones, K. A. (2008). Genes Dev.22, 3422–3434. [DOI] [PMC free article] [PubMed]
- Zhang, L., Fletcher, A. G., Cheung, V., Winston, F. & Stargell, L. A. (2008). Mol. Cell. Biol.28, 1393–1403. [DOI] [PMC free article] [PubMed]


