

Abstract
This paper explores a 3-D computer artist’s approach to the creation of three-dimensional computer-generated imagery (CGI) derived from clinical scan data. Interpretation of scientific imagery, such as magnetic resonance imaging (MRI), is restricted to the eye of the trained medical practitioner in a clinical or scientific context. In the research work described here, MRI data are visualized and interpreted by a 3-D computer artist using the tools of the digital animator to navigate image complexity and widen interaction. In this process, the artefact moves across disciplines; it is no longer tethered to its diagnostic origins. It becomes an object that has visual attributes such as light, texture and composition, and a visual aesthetic of its own. The introduction of these visual attributes provides a platform for improved accessibility by a lay audience. The paper argues that this more artisan approach to clinical data visualization has a potential real-world application as a communicative tool for clinicians and patients during consultation.
Keywords: 3-D visualization, computer animation, patient communication
Introduction
Three-dimensional computer-generated imagery (CGI) provides the contemporary digital artist with the tools and techniques to build virtual sets and characters in the fields of film visual effects (VFX), animated features and video games (Kerlow, 2004). In contrast, clinical magnetic resonance imaging (MRI) gives the physician a window into the inner body of the patient through scientific instrumentation. Superficially, these professional fields do not converse and have little in common: 3-D CGI is used to appeal to a mass audience through popular entertainment, whereas clinical MRI uses a restricted language, that of reductive science, in the pursuit of anatomical or pathological observation and medical diagnosis.
MRI technology was developed in the 1970s and entered clinical service in the 1980s. This relatively new imaging modality produces monochrome cross-sectional images of the human body that provide diagnostic information. Today, the use of MRI is widespread in modern healthcare, particularly in the developed world. According to Hornak (2008):‘In 2003, there were approximately 10 000 MRI units worldwide, and approximately 75 million MRI scans per year performed’. Similarly, since its inception in the 1970s, 3-D CGI has seen a proliferation of software and hardware development. It has its origins in American military and space research, with early technical pioneers in 3-D computer animation such as Blinn and Catmull [Blinn is a computer scientist based at the University of Utah who worked on the NASA Jet Propulsion Lab (JPL) project and developed the now widely-used ‘Blinn shader’ (Blinn, 1977); Catmull is a computer scientist who worked on the first film 3-D CGI effect in 1976 with Future World (Heffron, 1976), a live action feature film]. Animation prior to this early computer work was traditionally a hand-drawn process, based on individual 2-D cells coloured with ink and paint. Together, Catmull’s and Blinn’s works challenged this status quo, pushing a new boundary by using computers as means of creating screen-based 3-D CGI animated objects. Today’s 3-D CGI artists now have access to desktop animation software and hardware.
In a contemporary context, technologies such as maya, produced by the USA-based company Autodesk, provide the computer artist and animators with modelling, animation and software render tools. maya is a heavyweight software package used internationally in feature film, TV commercial and video game production (http://usa.autodesk.com/). These tools enable 3-D CGI artists and animators to construct and animate virtual worlds on screen primarily for film, television and video games. While film and video games are dominant markets for 3-D CGI there are other noteworthy users of 3-D CGI. These include architecture visualization, engineering product visualization and the simulation field (flight training and military applications). These virtual worlds consist of digital characters, props and assets and may combine live-action film footage with CGI. The tools they use, which only two decades ago were the sole domain of the large Hollywood film studios, have now filtered their way through to 3-D CGI artists working in medical animation (Nicholls, 2008).
Contemporary 3-D medical animation and visualization
Contemporary 3-D medical animation and visualization currently function within three areas: biomedical animation, biomedical documentary and 3-D visualization in medicine. Of these three, two reside within the arts, and one within the sciences. Broadly speaking, the 3-D CGI artist working in biomedical animation is engaged in a broad range of activities, including education for health professionals, training for medical practitioners, forensic reconstruction and pharmaceutical drug presentation. Similarly, the screen-based narrative offered by the biomedical television documentary provides a form of ‘edutainment’ that engages a mass audience in health science through a dramatic narrative. Recent examples of this include Fight for Life (BBC, 2007) and Life Before Birth (MacDonald, 2005), broadcast on British television. In contrast, 3-D visualization in medicine provides the medical professional with 3-D images that are generated by medical scan instrumentation, such as CT and MRI, for diagnosis, medical training and education. These images are used in areas such as virtual endoscopy and surgical planning.
3-D visualization in medicine uses 3-D technologies to achieve a seemingly precise and scientifically accurate visualization of clinical data. This medical instrumentation is highly advanced. It captures complex datasets that display, in detail, the internal organs and tissues of the human body, in a manner not previously possible. The imagery is locked in a reductive aesthetic, which can only be decoded with considerable medical and radiological understanding. 3-D visualization in medicine, however, is patient-specific, offering highly detailed images of the inner body that are not generic representations. The objective of this article is to discuss the value of combining MRI data with interpretative 3-D digital artisan approaches in the field of clinical data visualization and its potential real-world application.
3-D volume visualization
Owing to the increasing computational power available in contemporary computer visualization, MRI data can be post-processed into 3-D screen-based imagery. Diagnostic 3-D technology currently varies from the proprietary systems built into the MRI and CT scanning hardware, such as Siemens Leonardo (Siemens, 2005) and GE Advantage Windows (GE, 2005), to stand-alone software applications, such as voxar 3D (Barco, 2005), mimics and osirix [osirix is an open-source software package that allows 2-D MRI, CT or PET data to be viewed and visualized in 3-D http://www.osirix-viewer.com/Snapshots.html]. The image in Fig. 1 is an example of a post-processed 3-D volume visualization compiled in osirix from 2-D clinical fMRI cross-section data of the author’s head and brain.
Fig. 1.
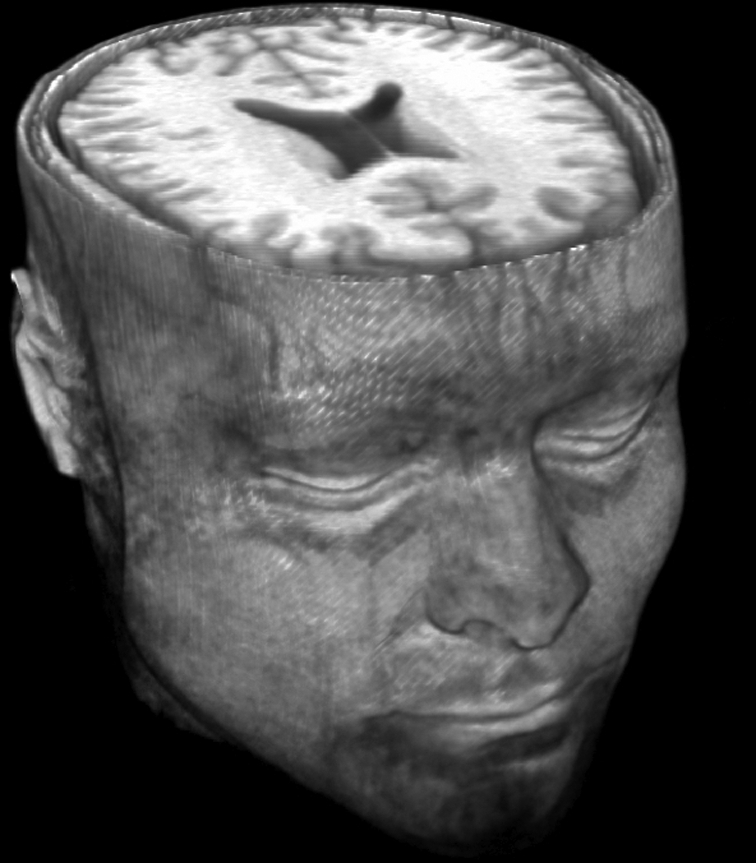
A 3-D volume visualization of the author’s head and brain on osirix software, derived from fMRI data acquired at Ninewells Hospital, Dundee, UK.
3-D digital visualization techniques, as used in clinical imaging, continue to have an almost exclusively diagnostic or scientific focus. Konig (2001) categorizes 3-D medical visualization into three special applications: virtual endoscopy, surgical planning and medical training. Virtual endoscopy uses the clinical data, primarily CT, visualized in real-time for on-screen simulation of the interior of arteries (virtual angioscopy), the colon (virtual colonoscopy) and the trachea (virtual bronchoscopy). These are virtual 3-D fly-throughs designed to assist in diagnosis and help the clinician plan any surgical intervention. 3-D visualization of clinical data used in surgical planning is similar in application to endoscopy whereby 3-D visualization is used as a means of planning complex surgical procedures. This might also include areas such as organ transplantation.
Both clinical (2-D) and any subsequent 3-D visualization of medical scan data are designed to render the body transparent and allow science to ‘see’ and ‘map’ the inner body. The ‘mechanical-medical eye’ (Dijck, 2005, p. 7) allows the body to be exposed in ever-increasing clarity whether it be in 2-D or 3-D. This ability to see more detail is not, however, necessarily correlated with increased understanding. The ‘mechanical eye’ provides detailed images, but interpretation requires significant amounts of knowledge. Medical interpretation of the body is but one stream of visualization, representing the body using a set of protocols and attributes embedded in science, e.g. MRI. Radiological instrumentation describes disease in the language of science; abstract, specialist and separated from the body. In effect these images are encoded for interpretation by clinical radiologists.
The image in Fig. 2 is a 3-D visualization of arterial data taken from 2-D MRI data, visualized in 3-D using osirix software. Both kidneys are visible on the right and left of the image with the aorta in the centre of the rendering and the spleen at the upper left. Although this is a 3-D image it says little to the untrained eye. Again, the information is encoded in the language and aesthetic of clinical scientific imaging.
Fig. 2.

A 3-D volume computer visualization of MRI renal and splenic angiogram data acquired at Ninewells Hospital, Dundee, UK.
Hybrid approach – clinical data and the artisan
This article proposes the creation of a hybrid comprising the CGI artisan approach with clinical data. The act of creating 3-D computer visualizations and animation based on medical scan data, however, requires a significant amount of technical experimentation prior to any creative intervention. In this case, the DICOM medical file format stores cross-sectional two-dimensional (2-D) data along with detailed informatics on the patient’s name and age and the scanner name and type, amongst other details. The goal is to link the data from MRI scans with maya animation software. Exporting the scientific data into a 3-D CGI software package allows the author to augment the data. During the early experimentation phase, two techniques were explored: the first was volume 3-D reconstruction and the second was ‘marching cubes’ (Lorensen & Cline, 1987). Both of these techniques are commonly used in medical visualization as a post-processing method.
Volume 3-D reconstruction is the predominant technique for 3-D reconstruction in medicine. This volume reconstruction technique uses pixels (the smallest unit used to construct a digital image) and voxels (a 3-D pixel used to represent a volume on-screen) extracted from 2-D image slice data to create a visual three-dimensional on-screen representation of the data. It is a relatively quick and less CPU-intensive (central processing unit) approach than the marching cubes algorithm. The use of pixels and voxels, however, currently limits the number of attributes that can be added by the digital artist. Ultimately, this leaves less scope for detailed animation work.
The second option for 3-D reconstruction is mesh-based geometry based on the marching cubes algorithm. Built from 2-D scan slices, the software algorithm generates surface patches, which then build up a mesh, thereby forming the 3-D shape of an object. The process is more complex than volume 3-D reconstruction, requiring more computational resources to construct the mesh. As PCs become ever more powerful and affordable, however, this polygon reconstruction process has several compelling advantages, flexibility being the strongest, as the surface geometry allows subsequent export to other applications.
Overall, the marching cubes algorithm was identified as the most appropriate means to realize the 3-D reconstruction process. mimics (mimics is a software package that facilitates the thresholding, segmentation and 3-D meshing required for making MRI or CT into 3-D geometry http://www.materialise.com/mimics/main_ENG.html) software was applied and after continued experimentation, this 3-D pipeline allowed the MRI scan geometry to be accessed in maya. The diagram in Fig. 3 highlights each stage of the pipeline developed during the research project (McGhee et al. 2007).
Fig. 3.
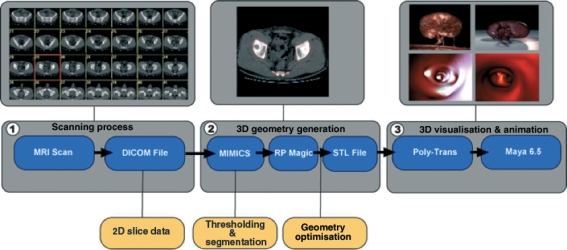
This diagram illustrates the staged pipeline developed during research on data exporting from the raw clinical MRI through to the final 3-D visualization.
In Stage 1, the raw MRI data are exported from the MRI scanner in 2-D cross-sectional images contained within a DICOM file. Stage 2 involves the image data being imported into the reconstruction software mimics. Through a process known as thresholding and segmentation, a surface geometry is generated. The image in Fig. 4 shows a masking colour being used in mimics to differentiate the aorta and kidneys from the rest of the background noise. This screen shot shows by means of a green mask an imported dataset that has been thresholded and segmented. Once the thresholding and segmentation are complete, mimics can calculate the 3-D object from the MRI data. This results in a 3-D STL (stereolithography file, a digital data format used for rapid prototyping) Stage 3 file that can be imported into maya. Once it is in maya, attributes such as colour, texture, lighting and animation can be added. This process does not simply pass data between software packages, but requires skill in segmenting the data.
Fig. 4.

Images illustrating Stage 2 of the pipeline: ‘segmentation’ and ‘thresholding’ of MRI renal angiogram data carried out in mimics software.
Being able to export the MRI data and bridge the gap between scientific instrumentation and artisan software was an important first step in the visualization process. The exporting and bridging of data was not based on any previous pathway but on the artist’s experimentation during a residency period at Ninewells Hospital, Dundee. It is a critical foundation stage of the pathway towards visualizing clinical data, supplying the digital model on which to add interpretation and narrative. This pipeline demonstrates a new pathway for accessing clinical data and importing the outputs into maya, and provides a practical reproducible working model for other artists to use and apply.
With the pipeline established, further pieces of MRI data could be visualized. The first example was a series of MRI cross-sectional images, taken from a patient’s renal arteries. These images are acquired through an MRI process known as renal angiography whereby the patient is injected with a contrast agent and a series of scan sequences are collected of the renal arteries, the kidneys and the aorta. In the final rendered 3-D visualization, the inner structure of the kidney is exposed through transparency and composition (Fig. 5). In this work, entitled ‘Medulla’, the kidney was isolated from the rest of the geometry and rotated so it could be viewed in a landscape format. Transparency was added to allow the viewer to see the blood flow patterns inside the kidney tissues. The goal was to produce an image with a degree of sensibility in an attempt to bring the viewer closer to the nature and beauty of inner kidney structure, and also as a means to penetrate the complexity of arterial disease.
Fig. 5.
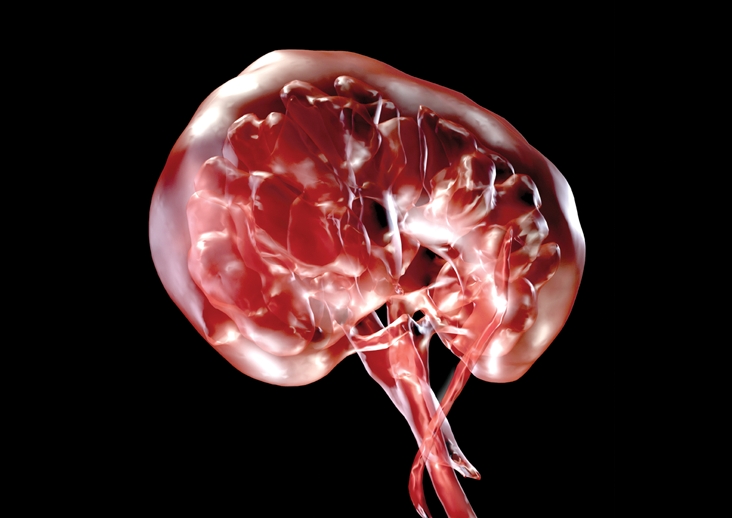
Final stage image: a 3-D CGI rendering of the human kidney entitled ‘Medulla’. The image is derived from clinical renal angiogram MRI data.
As with ‘Medulla’, ‘Stenosis’ (Fig. 6) is a reconstruction of the aorta from MRI data. It features interpretative red blood cells passing through the vessel. Initially, the blood cells were added because the MRI only provides an impression of blood flow at any given point in time. It does not capture an impression of the individual blood cells moving through the vascular system, instead highlighting blood flow as a liquid cast, which leaves an impression of the vessel’s structure. In the right third of the image, a narrowing in the renal artery can be seen, limiting the delivery of blood to its kidney. The primary intention in these images is the development of an aesthetic language that describes the body more holistically, rather than one that purely serves science. This is achieved by focusing on the visual aesthetic of the image as a whole, rather than highlighting the aspect of the human anatomy that is diseased.
Fig. 6.

This 3-D CGI rendering is a visualization of the human left kidney, aorta and right renal artery, entitled ‘Stenosis’. The image is derived from clinical renal angiogram MRI data visualizing renal artery stenosis.
In ‘Stenosis’ the anatomy is rendered by a transparent shader and a highly reflective surface. The organs are placed outside any bodily context and viewed in a landscape format. The interest is in communicating the visual quality of inner body space. It is an image that both communicates the (mal)functioning of the renal arteries and reveals to the viewer, through the use of transparency, the components of the vascular system. The particles used inside the vessel do not accurately replicate the way in which blood moves through the arterial system. The movement of blood in the human body follows a cycle, one that bursts, twists and pumps through the arterial system of the vessels, providing an aesthetic of movement that is absent from static MRI. These animated attributes were central in the development of a series of animations depicting blood flowing through the aorta. Influence came directly from the cinematic, the artist drawing from the popular inner body aesthetics seen in feature films such as Innerspace (Dante, 1987) and Fantastic Voyage (Fleischer, 1966). The artist’s objective was to focus on the essence of flow, rather than a factually correct rendering of red blood cells. The objective was not just the raw, unmediated imparting of medical ‘fact’, but communication of the rich structure and texture of the complex cycle of blood flow as it moves through the vascular system. As a result, the animated work entitled ‘Flow 1’ (Fig. 7) was created. This reflects the rhythm of blood flow in context; the spatial attributes are present, as are aspects of the other earlier work, such as structure and form. In this animated sequence, we see blood flowing through the aorta from both exterior (Fig. 7) and interior (Fig. 8) views of the vessel. This animation is the culmination of integrating different spatial approaches, rather than a static sequence.
Fig. 7.

This 3-D CGI rendering is a visualization of the human aorta and common iliac arteries (left), superior and inferior mesenteric arteries and testicular arteries, with interpretative red blood cells. This is a static image taken from an animated film sequence combining both clinical MRI data and interpretative particle effects that simulate spiral laminar flow. The piece is entitled ‘Flow’ (see Movie S1).
Fig. 8.

This 3-D CGI rendering is a static image taken from an animated film sequence that combines both clinical MRI data and interpretative particle effects (blood cells) that simulate spiral laminar flow visualization inside the aorta. The piece is entitled ‘Flow’ (See Movie S1).
The screenshots shown in Fig. 7 and Fig. 8 represent the blood pumping through the transparent aorta and its bifurcation (common iliac arteries). Exterior and interior views of the vessel have been combined as the virtual camera moves along the aorta following the red blood cells. The construction of this work saw the introduction of an approach whereby multiple reference sources such as drawings, video reference and the artist’s personal interpretation were used to visualize the MRI data.
Real-world application
There is some evidence in the literature that pictorial strategies for improved patient communication have been more successful than any text equivalent (McDonald & Kaufman, 2002; Hameen-Anttila et al. 2004; Leiner et al. 2004; Houts et al. 2006). It is implied that imagery can engage patients and improve their understanding of disease, recall and adherence to treatment. Houts et al. (2006) highlight the benefits of pictorial strategies in doctor–patient communication, but this is limited by what Mishler (1984, p. 64) terms ‘the medical voice’, which doesn’t take into account the patient’s views on illness or level of understanding of anatomy. Artistic intervention through image creation presents a potential tool for improved communication with patients and hence improved understanding and compliance. It should not, however, be applied as a persuasive tool to strengthen the doctor’s position. It should be used in the pursuit of a more equal interaction in clinical consultation with patients.
The work of Helman (2001) and the Mishler framework suggest that doctors and patients hold differing views on illness and disease. Medical doctors’ perspectives on disease processes are predominantly reductive. As Mishler (1984) describes it, the ‘voice of medicine’ results in the ‘unremarkable interview’ whereby the doctor is in control and holds a position of power during the consultation. The patient’s view of illness (described as aetiology) differs, with patients seeing illness causation relating to the individual, natural, social and supernatural worlds. These alternative approaches can lead to a ‘struggle’ and the breakdown of dialogue between the patient and the doctor.
The lessons for the 3-D CGI artist exploring new means of improving communication concern the narrative and visual approach. The CGI artist should not reinforce the ‘voice of medicine’ if the intention is to improve patient interaction. The visual approach should utilize patient views on illness in interaction with health professionals. The application of the artist’s approach to creating visualization of clinical data should address the limitations of current doctor–patient interactions. In the light of Mishler and Helman’s work, the 3-D CGI artist should not act as a conduit for science, but rather account for a body aesthetic beyond the didactic when interpreting and visualizing the body. By creation of 3-D CGI that does not compound the ‘voice of medicine’ but provides a representation of illness, dialogue may be stimulated. The goal of creating work to redress the balance of power in interaction between health professionals and patients should concern the provision of emotional insight, rather than purely medical education.
Concluding remarks
This paper demonstrates that MRI data can be ported into the animation software package maya. By means of segmentation and thresholding techniques in mimics software, computer models of human organs such as the kidneys and the aorta can be visualized. The creation of these works illustrates how an artist in the field of 3-D CGI can provide an alternative image aesthetic to that of reductive medical data visualization. The establishment of this workflow also provides a robust tool by which 3-D CGI artists can access vascular MRI medical data.
More significant, however, is the real-world application, suggesting a more visually driven approach for communicating anatomical data to patients. 3-D CGI artists have the ability to tell stories through their chosen medium and potentially widen accessibility to anatomical clinical imagery. This does raise the question of the integrity of the image – how far does the artist interpret the data? – and the appropriateness of a more abstracted visual narrative. Nonetheless, given the work of Mishler (1984) and Helman (2001), there would appear to be a need for images that describe the inner body in a more accessible and holistic way.
Acknowledgments
I would like to acknowledge all those who have contributed. My initial thanks are extended to the supervisory team, in particular to Professor Nigel Johnson, Dr Graeme Houston and Dr Louise Valentine. Also a special thanks to Dr Caroline Wilkinson based in the Centre for Anatomy and Human Identification for her additional support during this work. This research straddles two significant disciplines; that of the 3-D computer arts and that of medical imaging. The clinical team in the Radiology Department, Ninewells Hospital, Dundee, NHS Tayside, Scotland, were instrumental in the early success of the work. Key contributors from Ninewells Hospital include Trudy McLeay, Wendy Milne, Lynsay Allan, Scott Dundas, Dr Stephen Gandy and Dr Steve Nicholas. I would also like to issue a special thanks to Norma Gourlay, who guided me through the scrutiny of an NHS ethics submission. All images were created entirely by the author, except Fig. 1 (collaboration with Dr Stephen Nicholas) and Fig. 2 (collaboration with Dr Graeme Houston).
Supporting Information
Additional Supporting Information may be found in the online version of this article:
Movie S1. This movie contains 3-D CGI rendering that combines both clinical MRI data and interpretative particle effects (blood cells) simulating spiral laminar flow visualization inside the aorta.
As a service to our authors and readers, this journal provides supporting information supplied by the authors. Such materials are peer-reviewed and may be re-organized for online delivery, but are not copy-edited or typeset. Technical support issues arising from supporting information (other than missing files) should be addressed to the authors.
References
- Barco Voxar3D. 2005. Available at: http://www.barco.com/medical/en/solutions/3D_home.asp (accessed on 21 June 2005)
- BBC Fight for Life. 2007.
- Blinn JF. 4th Annual Conference on Computer Graphics and Interactive Techniques, San Jose, CA. New York: ACM; 1977. Models of light reflection for computer synthesized pictures; pp. 192–198. [Google Scholar]
- Dante J. Innerspace. USA: Warner Brothers; 1987. [Google Scholar]
- Dijck JV. The Transparent Body: A Cultural Analysis of Medical Imaging. Seattle: University of Washington Press; 2005. [Google Scholar]
- Fleischer R. Fantastic Voyage. USA: Twentieth Century-Fox Film Corporation; 1966. [Google Scholar]
- GE Advantage Workstation. 2005. Available at: http://www.gehealthcare.com/euen/advantage-workstation/index.html (accessed on 2 June 2005)
- Hameen-Anttila K, Kemppainen K, Enlund H, et al. Do pictograms improve children’s understanding of medicine leaflet information? Patient Educ Couns. 2004;55:371. doi: 10.1016/j.pec.2003.04.006. [DOI] [PubMed] [Google Scholar]
- Heffron RT. Future World. USA: American International Pictures (AIP); 1976. [Google Scholar]
- Helman CG. Culture, Health and Illness. London: Arnold; 2001. [Google Scholar]
- Hornak JP. The Basics of MRI. 2008. Available at: http://www.cis.rit.edu/htbooks/mri/ (accessed on 28 July 2008)
- Houts PS, Doak CC, Doak LG, et al. The role of pictures in improving health communication: A review of research on attention, comprehension, recall and adherence. Patient Educ Couns. 2006;61:173–190. doi: 10.1016/j.pec.2005.05.004. [DOI] [PubMed] [Google Scholar]
- Kerlow IV. The Art of 3D Computer Animation and Effects. Hoboken, NJ: John Wiley & Son; 2004. [Google Scholar]
- Konig AH. Usability Issues in 3D Medical Visualisation. Vienna: Technische Universität Vienna; 2001. [Google Scholar]
- Leiner M, Handel G, Williams D. Patient communication: a multidisciplinary approach using animated cartoons. Health Educ Res. 2004:591. doi: 10.1093/her/cyg079. [DOI] [PubMed] [Google Scholar]
- Lorensen WE, Cline HE. Marching Cubes: A high resolution 3D Surface Construction Algorithm. New York: ACM Press; 1987. [Google Scholar]
- MacDonald T. Life Before Birth. UK: Pioneer Productions; 2005. [Google Scholar]
- McDonald H, Kaufman K. Patient information leaflets did not promote informed choice and active decision-making in maternity care. Evid Obstet Gynecol. 2002;4:173. [Google Scholar]
- McGhee JB, Houston G, Chesson R. ACM SIGGRAPH 2007 Posters. San Diego, CA: 2007. 3-D computer arts in clinical radiology. [Google Scholar]
- Mishler EG. The Discourse of Medicine. New York: Ablex; 1984. [Google Scholar]
- Nicholls K. Body of work. Imagine. 2008. Wildfire Communications, UK, No. 16, 18.
- Siemens Leonardo Workstation. 2005. Available at: http://www.medical.siemens.com (accessed on 15 May 2005)
Associated Data
This section collects any data citations, data availability statements, or supplementary materials included in this article.