

Abstract
Background
When people with stroke recover gait speed, they report improved function and reduced disability. However, the minimal amount of change in gait speed that is clinically meaningful and associated with an important difference in function for people poststroke has not been determined.
Objective
The purpose of this study was to determine the minimal clinically important difference (MCID) for comfortable gait speed (CGS) associated with an improvement in the modified Rankin Scale (mRS) score for people between 20 to 60 days poststroke.
Design
This was a prospective, longitudinal, cohort study.
Methods
The participants in this study were 283 people with first-time stroke prospectively enrolled in the ongoing Locomotor Experience Applied Post Stroke (LEAPS) multi-site randomized clinical trial. Comfortable gait speed was measured and mRS scores were obtained at 20 and 60 days poststroke. Improvement of ≥1 on the mRS was used to detect meaningful change in disability level.
Results
Mean (SD) CGS was 0.18 (0.16) m/s at 20 days and 0.39 (0.22) m/s at 60 days poststroke. Among all participants, 47.3% experienced an improvement in disability level ≥1. The MCID was estimated as an improvement in CGS of 0.16 m/s anchored to the mRS.
Limitations
Because the mRS is not a gait-specific measure of disability, the estimated MCID for CGS was only 73.9% sensitive and 57.0% specific for detecting improvement in mRS scores.
Conclusions
We estimate that the MCID for gait speed among patients with subacute stroke and severe gait speed impairments is 0.16 m/s. Patients with subacute stroke who increase gait speed ≥0.16 m/s are more likely to experience a meaningful improvement in disability level than those who do not. Clinicians can use this reference value to develop goals and interpret progress in patients with subacute stroke.
Recovery of walking ability is the most frequently stated goal for patients after stroke.1 In the first week poststroke, 63% of patients are unable to walk independently and 50% cannot walk even with assistance.2 Patients and therapists naturally focus on improved walking function as a primary goal in acute and subacute stroke rehabilitation.
Gait speed has been shown to be sensitive to change over time3,4 and significantly correlated with level of disability in people with stroke.5,6 Perry et al5 identified gait speed categories that correlated with progressive levels of functional walking and disability. People walking at speeds of <0.4 m/s were household ambulators, people walking at speeds of ≥0.4 m/s but <0.8 m/s were limited community ambulators, and people walking at speeds of ≥0.8 m/s were able to walk in the community without substantial limitations. As people with stroke recover gait speed and transition between these categories, they experience substantially better function and quality of life.6
Minimal Clinically Important Difference
Gait speed of an individual poststroke can be referenced as a percentage of age- and sex-matched normative values.7 However, reference values that define clinically meaningful changes in gait speed are lacking. Thus, clinicians lack the reference values needed to answer questions such as, “How much improvement in gait speed is necessary for my patient to achieve a meaningful improvement in level of disability?” The minimal clinically important difference (MCID) is a reference value that addresses this clinical question. The MCID represents the smallest change of score in an outcome measure that a patient would perceive as beneficial.8 Clinicians can use the MCID to interpret the clinical relevance of changes observed in an individual poststroke. Researchers can use the MCID to determine the magnitude of difference between groups needed to identify an important benefit of one intervention over another. For people with stroke, the MCID has been estimated for the Functional Independence Measure,9 the Barthel Index,10 and several upper-extremity measures.11 Perera et al12 estimated small meaningful change for gait speed in a cohort of 692 older adults, including 100 people with stroke; however, their study focused on meaningful changes for decline in function. The MCID for gait speed also has been estimated for people with hip fracture.13 To our knowledge, the MCID has not been estimated for changes in gait speed associated with improved function among people with stroke.
Minimal Detectible Change
Minimal detectible change (MDC) is another commonly reported reference value for interpretation of clinical outcome measures. Whereas the MCID indicates clinically meaningful change, the MDC indicates the amount of change required to exceed measurement variability.14,15 That is, the MDC represents the smallest change on an outcome measure that would be considered “real.” The MDC is derived using the distribution, variability, and reliability of an outcome measure when it is studied in a stable population at 2 time points.* Thus, for the clinician, knowing the MDC would indicate whether a difference observed between 2 measurements on the same patient represents a true difference in performance or whether the difference could be expected due to intrinsic variability associated with the outcome measure. Because changes smaller than the MDC are likely to be due to measurement variability rather than real change, it is important that the estimated MCID be larger than the MDC for any given outcome measure.
Estimating MCID
Whereas the MDC is the value that exceeds the expected internal variability of a measure, the MCID addresses a more complex concept; it is the magnitude of change in an outcome measure that represents a meaningful change to the patient. Because individuals interpret “meaningful change” differently, depending on a multitude of factors (eg, prior level of function, severity of disability, age, physical environment, time since last measurement), the MCID is a dynamic and context-specific concept. Thus, derivations of the MCID only estimate the minimum value likely to represent meaningful change for a specific population at a particular stage of recovery.11,15 To gain a clear picture of the MCID for different stroke outcome measures, the MCID will need to be estimated for different stages of recovery and levels of severity (eg, ambulators and nonambulators, chronic and acute). Because estimation of the MCID is an iterative process (ie, evolves from multiple perspectives), it is important to begin to estimate the MCID for key clinical outcome measures such as gait speed among people with stroke.
Numerous methods have been described for deriving the MCID.8,15,17–20 Traditionally, analysis methods have been divided into 2 broad categories: distribution based and anchor based.17 Anchor-based analyses are considered a more robust method for estimating clinically meaningful change because the measure of interest, in this case gait speed, is compared with an established measure of meaningful change.14,15,21 By comparing the measure of interest with a gold standard measure with established clinical relevance and responsiveness to change, a reliable estimate of meaningful change can be determined.15,17
In this study, the MCID was estimated for comfortable gait speed (CGS) of people in the first 60 days poststroke using an anchor-based analysis. Because previous work5,6 has identified that improved gait speed is associated with reduced disability, we chose an anchor that could detect change in level of disability. The gold standard anchor used to identify minimal clinically important improvement in disability was the modified Rankin Scale (mRS).22 The mRS is a global index of disability broadly used as an outcome measure in pharmaceutical, epidemiologic, and behavioral studies of stroke recovery.23–28
Although the literature reflects the impact of gait speed on recovery after stroke and its relationship to community ambulation (ie, participation) and level of disability (ie, participation restrictions), there are no studies that have reported the minimal amount of change in gait speed that is expected to improve level of disability for an individual with stroke. Therefore, the purpose of this study was to estimate the MCID of gait speed for ambulatory individuals with subacute stroke using the mRS, an established measure of disability.
Method
Participants
Participants (N=283) in this study were prospectively enrolled in the multi-site Locomotor Experience Applied Post Stroke (LEAPS) randomized clinical trial between May 2005 and August 2008.27,† Participants were recruited from inpatient rehabilitation hospitals and the surrounding community in 5 different geographic locations across the United States. Inclusion criteria included: (1) age ≥18 years, (2) stroke within 45 days, (3) residual paresis in the lower extremity, (4) ability to walk at least 3 m with maximum assist of one person, (5) ability to follow a 3-step command, (6) CGS of <0.80 m/s, (7) expected to be discharged to home, and (8) ability to travel to the intervention site 3 times per week. Exclusion criteria included living in a nursing home prior to stroke, inability to walk at least 30 m (100 ft) prior to stroke, and medical conditions that contraindicate moderate-intensity exercise. A full list of inclusion and exclusion criteria for the LEAPS study has been published previously.27 All participants provided written informed consent to participate, as approved by each site's institutional review board.
Assessment Protocol and Outcome Measures
As part of the LEAPS trial, standardized assessments were conducted by trained assessors at approximately 20 days poststroke (T20)‡ and at approximately 60 days poststroke (T60). Between T20 and T60, participants did not participate in a research intervention but were engaged in usual care rehabilitation activities in their community. The assessment protocols and methods used to train assessors were published previously.27 For this study, stroke impairment severity was characterized using the National Institutes of Health Stroke Scale (NIHSS)29 and the Fugl-Meyer Sensorimotor Assessment upper-extremity (FM-UE), lower-extremity (FM-LE), and sensory (FM-S) domains.30 Comfortable gait speed and mRS score were used for the MCID analysis.
Comfortable gait speed.
Trained assessors, all licensed physical therapists, measured CGS using a standardized procedure for the 10-Meter Walk Test (10mWT) (see the eAppendix and video) previously described in a poststroke walking intervention study.31 High interrater and intrarater reliability have been established for timed walking tests, including the 10mWT.32–34 The walking course consisted of a total of 14 m in a hallway: a 2-m warm-up, 10 m used for the speed measurement, and 2 m for slowing down to a stop. Instructions were provided to the participant to “walk at a comfortable pace.” Participants were provided up to maximum assist by one person for balance and stability (but not for paretic-limb advancement). Participants used the assistive device (eg, cane, walker) or orthotic device (eg, ankle-foot orthosis) that they used “most often” (if any) at each time point. Two trials were conducted in succession, with a brief seated or standing rest as needed by the participant between trials.
Modified Rankin Scale.
Modified Rankin Scale scores range from 0 (no symptoms at all) to 5 (severe disability) (Tab. 1). When administered without a structured interview, the mRS has high intrarater reliability (weighted kappa=.94–.99)35 and moderate to high interrater reliability (weighted kappa=.71–.91).35,36 Numerous studies have established mRS content and convergent validity.37 Sensitivity to clinically meaningful change has been established for shifts of mRS scores of ≥1 in large prospective studies.38,39 A standardized procedure was used to determine the mRS score to optimize interrater reliability. Participant mRS scores were determined by the same assessor who conducted the 10mWT.35 The mRS score was assigned at the conclusion of a standardized 3- to 4-hour assessment. The assessment included measures of impairment (physical and cognitive), functional activities (physical and cognitive), and life participation, all of which affect the mRS score. Additional information required to accurately determine a participant's score was obtained from the participant or caregivers at the assessor's discretion (see the eAppendix).
Table 1.
Modified Rankin Scale22

Data Analysis
Descriptive statistics were used to characterize cohort demographics, stroke characteristics, days poststroke, severity of stroke impairment, CGS, and mRS scores. The Student paired t test and the Bowker test40 were used to identify statistically significant differences between continuous and ordinal measures, respectively.
Estimation of MCID
Improvement in mRS score (shift of ≥1) between T20 and T60 served as the gold standard anchor for detecting minimal clinically important change in gait speed. Anchor-based MCID studies can be designed for analysis of data at an individual or group level.15 Individual-level analyses use statistical tests commonly reported in studies of dichotomous diagnostic tests (eg, receiver operating characteristic [ROC] curve, sensitivity, specificity, likelihood ratios).15,17,41 In this study, these methods were used in conjunction with a Classification and Regression Tree (CART) analysis in a 2-step process.
Step 1: receiver operating characteristic curve.
To estimate MCID, the sample population was divided into participants who did or did not experience a “true” change in disability (improvement of ≥1 in mRS score). Individual cutoff scores for change in CGS ranging from 0.01 to 0.78 m/s then were tested to determine their sensitivity and specificity for detecting participants who did or did not experience a true change in disability. Sensitivity represents the percentage of participants who experienced an improvement of ≥1 on the mRS and met or exceeded the estimated MCID for CGS. Specificity represents the percentage of participants who did not experience an improvement of ≥1 on the mRS and failed to meet or exceed the estimated MCID for CGS. Figure 1a and the second column of Figure 1c summarize the formulas for the proposed analyses.
Figure 1.

(a) A 2 × 2 table traditionally used to calculate sensitivity and specificity. The sample population is divided into 4 groups (cells A, B, C, and D). Cell A represents the number of participants who had a positive result on both the gold standard test and the new test (true positives). Cell B represents the number of participants who had a positive result on the gold standard test but a negative result on the new test (false negatives). Cell C represents the number of participants who had a negative result on the gold standard test but a positive result on the new test (false positives). Cell D represents the number of participants who had a negative result on both the gold standard test and the new test (true negatives). (b) A 2 × 2 table of actual data from this study for the gold standard anchor (the modified Rankin Scale) and the minimal clinically important difference (MCID) of 0.16 m/s for comfortable gait speed. (c) Formulas used to calculate sensitivity, specificity, positive likelihood ratio, and negative likelihood ratio and actual data used to calculate values for the MCID of 0.16 m/s for comfortable gait speed.
A ROC curve was generated by plotting sensitivity against 1 − specificity for each potential cutoff score. The area under the curve (AUC) and 95% confidence interval (CI) were calculated using the SAS (version 9.1)§ %ROC macro described by Delong et al42 to determine the presence of a relationship between change in CGS and shift of mRS score sufficient to estimate MCID.43 If the lower limit of the AUC 95% CI was >0.5, the relationship between change in CGS and mRS was considered sufficient to estimate the MCID for CGS. Identifying a sufficient relationship between the 2 variables was the primary purpose of the ROC curve. Traditionally, if a sufficient relationship existed; the ROC curve could be used to qualitatively estimate MCID by visually determining the point on the curve closest to the upper left-hand corner of the graph, which represents the point of optimal sensitivity and specificity.9,43,44 In this study, however, the second step of the analysis provided a more-quantitative method for estimating MCID.
Step 2: Classification and Regression Tree.
The second step of the analysis used CART analysis (version 6)∥,45 to provide a more quantitative estimate of the best cutoff score to estimate MCID. For this analysis, potential cutoff scores were defined by the minimum and maximum values for change in CGS between T20 and T60 in our sample population. Within that range, cutoff scores were tested at 0.01-m/s increments. Each cutoff score served as a metric for splitting the data into 2 groups: participants whose change in CGS exceeded the cutoff score and participants whose change in CGS did not exceed the cutoff score. A heterogeneity value (ie, impurity) associated with each cutoff score was computed. The cutoff score with the largest heterogeneity represented the score with the best discrimination of the data (ie, the best MCID candidate). Thus, the cutoff score with the highest heterogeneity value was identified as the estimated MCID.
Next, tenfold cross validation was used to substantiate this estimate. This process involved development of an ancillary cross-validation learning tree (ie, computational modeling) using a randomly selected 90% of our data set. The remaining 10% of the data served as a pseudo-independent data set that was used to validate the estimate generated from the initial 90% (by calculation of a classification error). This procedure was repeated 10 times. The results of the 10 cross-validation procedures were combined to compute a statistical score for determining the significance of the estimated MCID. The CART program will provide a result only if it is statistically significant. Thus, the CART analysis produces a more-quantitative result than the ROC curve analysis.
CART analysis is not probabilistic and, therefore, provides a point estimate but not a CI. Results from the CART analysis were compared with the ROC curve to ensure that the computer-generated cutoff score corresponded to a visual representation of the data. If the 2 models were in general agreement, the cutoff score identified by CART would be considered the preferred method to estimate MCID.
Likelihood Ratios
Finally, to facilitate clinical interpretation and utilization of the MCID value, positive and negative likelihood ratios (LR+, LR–) were calculated to characterize the value of the MCID for identifying a meaningful change in level of disability for individual patients. Likelihood ratios combine sensitivity and specificity and were used to determine the likelihood, based on change in CGS, that an individual would experience a meaningful change in level of disability.44 Specifically, LR+ was used to estimate the likelihood that a participant who met or exceeded the estimated MCID would actually experience a meaningful improvement in level of disability, and LR− was used to estimate the likelihood that a participant who did not exceed the estimated MCID would experience a meaningful improvement in level of disability. Formulas used to calculate LR+ and LR− are illustrated in the second column of Figure 1c.
Once likelihood ratios were calculated, a likelihood ratio nomogram46 was used to determine the probability that an individual similar to the participants of our cohort would experience an improvement in level of disability based upon whether he or she did or did not achieve the estimated MCID for CGS. A nomogram, in this case a likelihood ratio nomogram, is a graphical calculating device.# Whenever possible, 95% CIs were calculated to demonstrate the precision of statistical analyses (AUC,42 sensitivity and specificity,47 likelihood ratios48).
Role of the Funding Source
This work was supported by funding from National Institute of Neurological Disorders and Stroke and the National Center for Medical Rehabilitation Research (RO1 NS050506). The funding source had no role in the design, conduct, or reporting of this study.
Results
Participants
A total of 283 participants (age: mean [SD]=63.5 [12.5] years, range=29–98 years) completed assessments T20 and T60. Scores for stroke impairment severity at T20, based on the NIHSS, ranged from 0 to 20 out of 42 (mean [SD]=7.5 [4.0]) (Tab. 2). Significant increases in CGS, FM-UE, FM-LE, FM-S, and mRS scores (P<.001) associated with natural recovery and participation in therapeutic rehabilitation programs were evident (Tab. 3).
Table 2.
Baseline Demographics, Stroke Characteristics, and Impairmenta
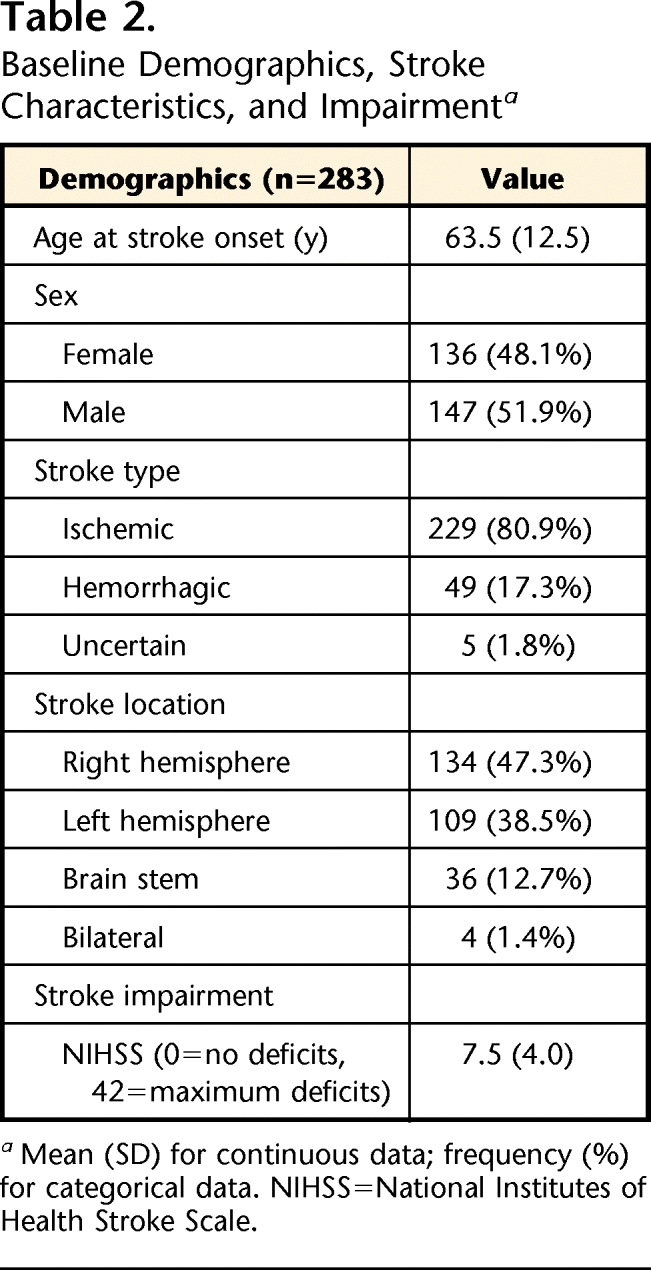
Mean (SD) for continuous data; frequency (%) for categorical data. NIHSS=National Institutes of Health Stroke Scale.
Table 3.
Stroke Severity, Gait Speed, and Disability Level at 20 Days and 60 Days Poststrokea

Mean (SD) for continuous data; frequency (%) for categorical data.
bStudent paired t test was used to determine statistical significance for continuous data.
cFM-UE=Fugl-Meyer Sensorimotor Assessment–upper extremity, FM-LE=Fugl-Meyer Sensorimotor Assessment–lower extremity, FM-S=Fugl-Meyer Sensorimotor Assessment–sensory.
dA small number of participants were unable to participate in the FM-S assessment due aphasia (T20, n=272; T60, n=270; change, n=270).
eThe Bowker test was used to determine statistical significance for ordinal data.
Comfortable Gait Speed
Individual gait speeds at T20 and T60 met the LEAPS inclusion criterion of a CGS of <0.80 m/s, ranging from 0.00 to 0.79 m/s. At T20 and T60, 67 and 7 participants, respectively, met the inclusion criterion of ability to walk 3 m but were unable to walk 10 m due to fatigue and, therefore, were considered to have a gait speed of 0.0 m/s. For the purposes of this study, these cases were not considered missing data. At T20, only 14% of the participants (n=41) were classified5 as limited community ambulators (≥0.4 to <0.8 m/s), whereas the remainder (n=242, 86%) were classified as household ambulators (<0.4 m/s). At T60, the proportion of limited community ambulators increased to 49% (n=139). Mean (SD) CGS increased 0.21 (0.17) m/s, from 0.18 (0.16) m/s at T20 to 0.39 (0.22) m/s at T60 (P<.001); change in gait speed ranged from −0.21 m/s to 0.75 m/s. Between assessments, 15 participants (5%) experienced a decline in CGS (median=−0.04 m/s).
Modified Rankin Scale
Table 4 shows frequency counts of mRS scores at T20 and T60 and illustrates the degree of change experienced by individual participants between the 2 time points. Participants represented in the blue boxes (n=141, 49.8%) did not experience a shift in mRS scores. Participants represented in cells above (and to the right of) the blue boxes (n=8, 2.8%) experienced a worsening of disability level. Conversely, participants represented in cells below (and to the left of) the blue boxes (n=134, 47.3%) experienced a clinically meaningful improvement in function (≥1 improvement of mRS scores) between T20 and T60. There was a statistically significant shift of mRS category from T20 to T60 (P<.001).
Table 4.
Stroke Outcome Characterized by Modified Rankin Scale (mRS) Score at Assessment 1 (T20) and Assessment 2 (T60)a

Blue boxes represent participants who had no change in mRS score from T20 to T60 (n=141 [49.8%]). Participants represented above blue boxes experienced increased disability from T20 to T60 (n=8 [2.8%]). Participants represented below blue boxes experienced reduced disability from T20 to T60 (n=134 [47.3%]).
MCID–ROC Curve
To derive the CGS MCID, the best match between a change in CGS and a change in the gold standard anchor (mRS) was identified. The ROC curve is illustrated in Figure 2, and the AUC was calculated as 0.69 (95% CI=0.63–0.75). The shape of the ROC curve is relatively smooth and difficult to interpret with regard to cutoff scores. Having established a substantial relationship between CGS and mRS scores (AUC >0.5), we proceeded to CART analysis to derive a specific cutoff score.
Figure 2.

Receiver operating characteristic (ROC) curve for the ability of change in gait speed to detect a change in modified Rankin Scale (mRS) scores. The ROC curve provides a visual depiction of the sensitivity (y-axis) and specificity (x-axis) of gait speed cutoff scores for detecting ≥1 level of improvement in mRS scores. Each point along the curve represents a change in gait speed for which sensitivity and specificity were calculated.
MCID–CART Analysis
The CART analysis showed that a CGS of ≥0.16 m/s produced the optimal combination of sensitivity (73.9%, 95% CI=65.9%–80.6%) and specificity (57.0%, CI=49.0%–64.7%) for detecting improvement in mRS scores among our participants (Fig. 1b and columns 3 and 4 of Fig. 1c). This cutoff score produced the strongest association to the anchor compared with all other potential cutoff scores. This finding is consistent with the trend presented in the ROC curve.
Likelihood Ratios
The LR+ for the CGS MCID of 0.16 m/s was 1.72 (95% CI=1.39–2.12), and the LR− was 0.46 (0.33–0.63). Overall, 47.3% of the participants in the cohort experienced a meaningful improvement in disability level. The overall prevalence rate of improved disability (47.3%) served as the estimated pretest probability that a participant would experience a meaningful change in disability. Using a likelihood ratio nomogram, we determined that a participant who met or exceeded a 0.16-m/s change in CGS had a posttest probability of 60% for experiencing a meaningful change in disability (Fig. 3). In contrast, those who did not meet or exceed a 0.16-m/s CGS change had a posttest probability of only 29% for experiencing a meaningful change in disability.
Figure 3.

Nomogram graphical representation of the probability that an individual with stroke will experience a meaningful change in disability level. The green line plots the pretest probability estimated at 47% (based on the overall percentage of participants in this study with improved disability level) and the positive likelihood ratio (LR+) used when an individual meets or exceeds the minimal clinically important difference (MCID) of 0.16 m/s for comfortable gait speed to determine the posttest probability that the individual has a 60% probability of experiencing an improvement in disability level. The red line plots the pretest probability and the negative likelihood ratio (LR–) used when an individual does not meet the MCID of 0.16 m/s for comfortable gait speed to determine the posttest probability that the individual has only a 29% probability of experiencing an improvement in disability level. Likelihood ratio nomogram adapted and reprinted with permission from the Centre for Evidence-Based Medicine, Oxford, United Kingdom.61
Discussion
For people between 20 and 60 days after first-time stroke who are ambulatory but have severe gait impairment (eg, mean gait speed=0.18 m/s), we estimate the MCID for gait speed to be 0.16 m/s. We anchored our MCID analysis to the mRS, an accepted and reliable indicator of disability level. From the patient perspective, walking at faster speeds results in higher levels of participation such as going out of the home for family, recreational, or occupational outings.6 For the clinician, this reference for meaningful change in gait speed can be used to interpret clinical outcomes, particularly the effectiveness of walking rehabilitation programs.
The mRS is a robust measure of global disability that has convergent validity with the Barthel Index (BI), another common measure of disability poststroke, while avoiding the ceiling effect observed in the BI.39,49 Additionally, the mRS is more sensitive than the BI for distinguishing between mild and moderate disability.39 A recent survival analysis by Huybrechts et al50 demonstrated the importance of a 1-point shift on the mRS. They found that mRS scores at 3 months poststroke are not only predictive of long-term functional independence but also highly predictive of mortality. For every 1-point improvement on the mRS, participants' life expectancy was statistically significantly longer. Further support that the relationship between CGS and mRS scores is justified and sound is provided by the ROC curve and the associated AUC, which was substantial (>0.50).
A requirement of valid, longitudinal, anchor-based MCID studies is that time between assessments is sufficient for individuals in the study cohort to experience a clinically meaningful change.15 We chose to evaluate the time points of 20 and 60 days poststroke because this is a critical time of change when most individuals are involved in some form of rehabilitation (ie, inpatient rehabilitation, home health care, outpatient therapy). Indeed, across the 20- to 60-day period poststroke, the participants in our study had a mean improvement in gait speed of 0.21 (0.17) m/s. This represents greater than 100% improvement in mean gait speed from T20 to T60. However, not all participants experienced an improvement in speed or disability level, providing sufficient diversity within the population for a difference to be detected between those who experienced at least a minimal clinically important improvement and those who did not.
Clinical Interpretation of MCID
By defining the threshold for clinically important change, we improve our ability to interpret the value of rehabilitation efforts in clinical settings and randomized clinical trials of intervention effectiveness. Thus, an MCID reference value of 0.16 m/s for gait speed could serve as an explicit therapeutic goal for rehabilitation interventions aimed at improving participation levels for individuals poststroke. Not only are higher gait speeds associated with improved function poststroke,6 but gait speed also is associated with reduced mortality in older adults.51 Improvement in usual gait speed has been shown to predict a substantial reduction in mortality, whereas a decline in gait speed predicts increased risk for hospitalization and onset of disability among older adults.52,53 Another important aspect of maintaining gait speed and high levels of participation is the established benefits of physical activity to reduce stroke risk.54 Clearly, people with stroke who are at risk for secondary stroke need to be involved in physical activities such as walking to maintain health and wellness. A valid MCID for gait speed improves not only the clinical interpretation of individual rehabilitation programs but also the clinical significance of intervention studies that may find statistical improvements in gait speed but may not achieve a threshold that is clinically meaningful.
Likelihood ratios incorporate sensitivity and specificity and typically are used to describe diagnostic tests.46 However, in our study, they provided valuable insight into the interpretation of our results by estimating how likely an individual with subacute stroke is to experience an improvement in level of disability based solely on change in gait speed. Of all participants in our study, 47.3% experienced an improvement in level of disability. For an individual with stroke who has characteristics similar to those of our cohort and achieves an improvement in CGS of ≥0.16 m/s, a nomogram and the LR+ of 1.72 estimate that this individual has a 60% probability of experiencing a meaningful change in disability level (Fig. 3). Conversely, an individual who fails to meet or exceed a 0.16-m/s change in CGS has only a 29% probability of experiencing a meaningful change in disability level. Thus, although our MCID estimate for CGS is not a perfect indicator of meaningful change, it provides a valuable reference for identifying meaningful change in clinical and research settings.
What Is the Difference Between MCID and MDC?
Both MCID and MDC provide reference values for interpreting magnitude of change on an outcome measure. The MCID indicates the magnitude of change required to achieve a clinically meaningful change. The MDC indicates the magnitude of change required to exceed test-retest reliability. As mentioned previously, it is important to interpret estimates of MCID in light of random measurement error represented by the MDC. Unfortunately, these 2 measurement constructs may be confusing for the clinician to use and interpret. This confusion is further confounded by studies that do not adhere to optimal design methods for derivation of MDC.14,16
For example, the MDC for CGS among patients with stroke was reported in 3 studies, all during the inpatient subacute phase of recovery (number of subjects ranged from 24 to 35 individuals poststroke). The MDC was reported as 0.12 m/s,55 0.17 m/s,56 and 0.30 m/s.57 The limitation of these studies is that the test-retest coefficient, an integral component of MDC derivation, was derived during a time of rapid recovery. Deviation of test-retest reliability in a changing population potentially overestimates variability, causing inflation of the MDC. The smallest real difference (SRD) is considered the same construct as the MDC.16 Perera et al12 estimated SRD to be 0.05 m/s for decline in gait speed among older adults, 14% of whom were people with chronic stroke. Similarly, among individuals following a hip fracture, the MDC for gait speed was determined to be 0.08 m/s. Thus, it appears that the MDC for gait speed in older adults and most likely in people with stroke is more in the range of 0.05 to 0.08 m/s, rather than the reported range of 0.12 to 0.30 m/s. Additional study of MDC in people with stroke who are not expected to make gains through natural recovery and are not participating in a rehabilitation program is needed.
Magnitude of change for MCID is driven by characteristics of the population studied. The MCID of 0.16 m/s found in our study is similar to, although slightly larger than, findings in other populations. Palombaro et al13 estimated an MCID of 0.10 m/s for habitual gait speed among elderly people after hip fracture with a mean (SD) initial CGS of 0.66 (0.28) m/s (range=0.14–1.33 m/s). Perera et al12 estimated “substantial meaningful change” for decline in gait speed among older adults to be 0.10 m/s in a population with initial mean (SD) gait speeds ranging from 0.65 (0.28) m/s to 0.88 (0.24) m/s. Participants in the present study, with a mean (SD) CGS of 0.18 (0.16) m/s at T20, had relatively severe initial gait speed impairments. It may be that a larger magnitude of change in speed is required to produce meaningful change in people with more-severe deficits. Future analyses of patients with mild impairment secondary to stroke are needed and may produce smaller values for MCID.
Strengths and Limitations
This study had several strengths. We were able to prospectively follow a large cohort of participants recruited from 5 distinct geographic locations during a time of rapid change in walking recovery poststroke.2,58 Data for outcome measures were collected using a standardized protocol by therapists who had completed rigorous training and competency testing. Our analysis included the traditional method of ROC curve analysis combined with a quantitative CART analysis. Finally, the mRS is a robust measure that captures small, but clearly important, changes in global disability. By using the mRS, we are able to understand the smallest magnitude of CGS improvement likely to contribute a meaningful change in disability level for individual patients during the subacute phase poststroke.
Our MCID estimate was 73.9% sensitive and 57.0% specific to improvement in mRS scores. The lack of precision (sensitivity and specificity) of our MCID estimate may be considered a limitation. However, the mRS does not directly correlate with gait speed because it is a global measure of disability. Disability from the individual perspective is a complex and multivariate phenomenon that encompasses more than gait speed. Thus, gait speed, an activity-level measure of mobility, is one of many variables (eg, arm and hand function, cognition level, emotional impairment, bowel and bladder control, pain) that contribute to mRS score.59 We consider improvement on the mRS to be a robust anchor for determining CGS MCID because it reflects change on a participation level that is important from the individual perspective.
Another possible limitation is that participants were allowed to use different assistive devices at the 2 time points. Due to the acuity of our participants (mean=21.9 days poststroke at T20), we expect that spontaneous neurologic recovery and response to therapeutic interventions are occurring simultaneously. Thus, an ecologically valid (ie, real-life) MCID for CGS would reflect both the expected changes associated with time poststroke (ie, acute, subacute, chronic)60 and the beneficial effects expected of therapy. That is, we are interested in the real-life change in gait speed regardless of assistive device.
Additional studies are needed to expand our understanding of MCID for gait speed among individuals with stroke. Other anchors also should be used to develop additional estimates of MCID, including measures that directly assess patients' perspective of change. Ideally, over time a relatively narrow range of MCID estimates will emerge that clinicians can use to more definitively understand the minimal amount of change in gait speed likely to represent clinically meaningful change for individual patients. Other subsets of people with stroke also should be studied. For example, in this study, there were insufficient participants with moderate gait speed deficits (≥0.4 to 0.8 m/s) at initial evaluation to support subanalysis by gait speed severity. Likewise, people who were able to walk at speeds of >0.8 m/s were excluded from the study. The MCID needs to be determined for people with stroke across various time frames and levels of severity.
Conclusion
We estimate that the MCID for gait speed among patients with subacute stroke and severe gait speed impairments is 0.16 m/s. Thus, patients with similar characteristics who increase their gait speed ≥0.16 m/s are more likely to experience a meaningful improvement in disability level than those who do not. This reference value can be used by clinicians to develop goals and interpret progress in patients with subacute stroke. The MCID estimate also is useful for interpretation of walking intervention effectiveness studies.
Supplementary Material
Footnotes
Dr Tilson, Dr Sullivan, Dr Cen, Ms Koradia, Dr Azen, and Dr Duncan provided concept/idea/research design. Dr Tilson, Dr Sullivan, Dr Cen, Ms Koradia, and Dr Duncan provided writing. Dr Tilson, Dr Cen, Dr Rose, Ms Koradia, and Dr Azen provided data collection. Dr Tilson, Dr Cen, Ms Koradia, and Dr Duncan provided data analysis. Dr Tilson, Dr Sullivan, Dr Cen, Dr Rose, and Dr Duncan provided project management. Dr Sullivan and Dr Duncan provided fund procurement and institutional liaisons. Dr Sullivan provided facilities/equipment. Dr Tilson, Dr Cen, Dr Rose, and Dr Azen provided consultation (including review of manuscript before submission).
The authors acknowledge the participants who dedicated their time to this study and the contributions of the following members of the LEAPS investigative team: Brooks Rehabilitation Hospital, Jacksonville, Florida: Trevor Paris, MD, Deborah Stewart, MD, and Joann Gallichio, PT; Florida Hospital Rehabilitation and Sports Medicine, Orlando, Florida: Mitchell Freed, MD, Michelle Dolske, PhD, Craig Moore, PT, and Bettina Brutsch, PT; Long Beach Memorial Medical Center, Long Beach, California: H. Richard Adams, MD, Diemha Hoang, MD, and Anita Correa, PT; Sharp Memorial Rehabilitation Center, San Diego, California: Jerome Stenehjem, MD, Roxanne Hon, MD, and Molly McLeod, PT; USC PT Associates, Los Angeles, California: David Alexander, MD, Julie Hershberg, PT, DPT, and Samneang Ith-Chang, PT, DPT. Locomotor Experience Applied Post-Stroke (LEAPS) Principal Investigator is Pamela W. Duncan, PT, PhD, FAHA, FAPTA (Duke University, Durham, North Carolina). Co-Principal Investigators are: Andrea L. Behrman, PT, PhD, FAPTA (University of Florida, Gainesville, Florida) and Katherine J. Sullivan, PT, PhD, FAHA (University of Southern California, Los Angeles, California). Members of the Steering Committee include: Stanley P. Azen, PhD (University of Southern California, Los Angeles, California), Samuel S. Wu, PhD (University of Florida, Gainesville, Florida), Bruce H. Dobkin, MD (University of California–Los Angeles, Los Angeles, California), and Stephen E. Nadeau, MD (University of Florida, Gainesville, Florida). The Data Management and Analysis Center (DMAC) is located at the University of Southern California and is directed by Stanley P. Azen, PhD. Samuel S. Wu, PhD, serves as the trial's Lead Statistician, and Steven Cen, PhD (University of Southern California, Los Angeles, California) co-directs the DMAC. Dorian K. Rose, PT, PhD (University of Florida, Gainesville, Florida) and Julie K. Tilson, PT, DPT (University of Southern California, Los Angeles, California) are the Clinical Research Coordinators for the LEAPS trial. Sarah Hayden (Duke University, Durham, North Carolina) is the Project Manager. The 4 members of the Data Safety and Monitoring Committee are: Bruce M. Coull, MD, Chair (University of Arizona, Tucson, Arizona), Elizabeth A. Noser, MD (University of Texas Medical School, Houston, Texas), Michael K. Parides, PhD (Columbia University, New York, New York), and Steven L. Wolf, PT, PhD, FAPTA (Emory University, Atlanta, Georgia).
Abstracts of the data were presented at the Combined Sections Meeting of the American Physical Therapy Association; February 9–12, 2009; Las Vegas, Nevada, and at the Annual Meeting of the California Chapter of the American Physical Therapy Association Annual Meeting; October 2–3, 2009; Pasadena, California.
This work was supported by funding from National Institute of Neurological Disorders and Stroke and the National Center for Medical Rehabilitation Research (RO1 NS050506). The funding source had no role in the design, conduct, or reporting of this study.
MDC=SEM(1.96), where SEM=standard error of the measure, 1.96 represents the z score for a 95% confidence interval, and the accounts for the difference of 2 variances used to derive SEM. SEM=SD(), where SD=standard deviation of within-subject test-retest differences and r=measure of reliability (test-retest reliability or Cronbach alpha).16
Participants were assessed initially between the 5th and 30th days poststroke; however, the protocol included tolerance for initial assessment up to 45 days poststroke.
SAS Institute Inc, PO Box 8000, Cary, NC 27513.
Salford Systems, 4740 Murphy Canyon Rd, Suite 200, San Diego, CA 92123 (http://www.salfordsystems.com/112.php).
The likelihood ratio nomogram is used traditionally to determine the probability that someone has (or does not have) a condition based upon certain baseline characteristics and the likelihood ratio of a diagnostic test.46 In this case, the tool was used to determine the probability of improved level of disability (improvement of ≥1 in mRS score) based upon likelihood ratios calculated for the estimated CGS MCID.
References
- 1.Bohannon RW, Andrews AW, Smith MB. Rehabilitation goals of patients with hemiplegia. Int J Rehabil Res 1988;11:181–183 [Google Scholar]
- 2.Jorgensen HS, Nakayama H, Raaschou HO, et al. Outcome and time-course of recovery in stroke, 2: time-course of recovery. The Copenhagen Stroke Study. Arch Phys Med Rehabil 1995;76:406–412 [DOI] [PubMed] [Google Scholar]
- 3.Salbach NM, Mayo NE, Higgins J, et al. Responsiveness and predictability of gait speed and other disability measures in acute stroke. Arch Phys Med Rehabil 2001;82:1204–1212 [DOI] [PubMed] [Google Scholar]
- 4.Goldie PA, Matyas TA, Evans OM. Deficit and change in gait velocity during rehabilitation after stroke. Arch Phys Med Rehabil 1996;77:1074–1082 [DOI] [PubMed] [Google Scholar]
- 5.Perry J, Garrett M, Gronley JK, Mulroy SJ. Classification of walking handicap in the stroke population. Stroke 1995;26:982–989 [DOI] [PubMed] [Google Scholar]
- 6.Schmid A, Duncan PW, Studenski SA, et al. Improvements in speed-based gait classifications are meaningful. Stroke 2007;38:2096–2100 [DOI] [PubMed] [Google Scholar]
- 7.Perry J. Gait Analysis: Normal and Pathological Function Thorofare, NJ: Slack Inc; 1992 [Google Scholar]
- 8.Jaeschke R, Singer J, Guyatt GH. Measurement of health status: ascertaining the minimal clinically important difference. Control Clin Trials 1989;10:407–415 [DOI] [PubMed] [Google Scholar]
- 9.Beninato M, Gill-Body KM, Salles S, et al. Determination of the minimal clinically important difference in the FIM instrument in patients with stroke. Arch Phys Med Rehabil 2006;87:32–39 [DOI] [PubMed] [Google Scholar]
- 10.Hsieh YW, Wang CH, Wu SC, et al. Establishing the minimal clinically important difference of the Barthel Index in stroke patients. Neurorehabil Neural Repair 2007;21:233–238 [DOI] [PubMed] [Google Scholar]
- 11.Lang CE, Edwards DF, Birkenmeier RL, Dromerick AW. Estimating minimal clinically important differences of upper-extremity measures early after stroke. Arch Phys Med Rehabil 2008;89:1693–1700 [DOI] [PMC free article] [PubMed] [Google Scholar]
- 12.Perera S, Mody SH, Woodman RC, Studenski SA. Meaningful change and responsiveness in common physical performance measures in older adults. J Am Geriatr Soc 2006;54:743–749 [DOI] [PubMed] [Google Scholar]
- 13.Palombaro KM, Craik RL, Mangione KK, Tomlinson JD. Determining meaningful changes in gait speed after hip fracture. Phys Ther 2006;86:809–816 [PubMed] [Google Scholar]
- 14.de Vet HC, Terwee CB, Ostelo RW, et al. Minimal changes in health status questionnaires: distinction between minimally detectable change and minimally important change. Health Qual Life Outcomes 2006;4:54 [DOI] [PMC free article] [PubMed] [Google Scholar]
- 15.Beaton DE, Bombardier C, Katz JN, et al. Looking for important change/differences in studies of responsiveness. J Rheumatol 2001;28:400–405 [PubMed] [Google Scholar]
- 16.Beckerman H, Roebroeck M, Lankhorst G, et al. Smallest real difference, a link between reproducibility and responsiveness. Qual Life Res 2001;10:571–578 [DOI] [PubMed] [Google Scholar]
- 17.Crosby R, Kolotkin R, Williams G. Defining clinically meaningful change in health-related quality of life. J Clin Epidemiol 2003;56:395–407 [DOI] [PubMed] [Google Scholar]
- 18.Crosby R, Kolotkin R, Williams G. An integrated method to determine meaningful changes in health-related quality of life. J Clin Epidemiol 2004;57:1153–1160 [DOI] [PubMed] [Google Scholar]
- 19.Jacobson N, Follette W, Revenstorf D. Toward a standard definition of clinically significant change. Behav Ther 1986;17:308–311 [Google Scholar]
- 20.Jacobson N, Truax P. Clinical significance: a statistical approach to defining meaningful change in psychotherapy research. J Consult Clin Psychol 1991;59:12–19 [DOI] [PubMed] [Google Scholar]
- 21.Haley SM, Fragala-Pinkham MA. Interpreting change scores of tests and measures used in physical therapy. Phys Ther 2006;86:735–743 [PubMed] [Google Scholar]
- 22.Bonita R, Beaglehole R. Recovery of motor function after stroke. Stroke 1988;19:1497–1500 [DOI] [PubMed] [Google Scholar]
- 23.Vanswieten JC, Koudstaal PJ, Visser MC, et al. Interobserver agreement for the assessment of handicap in stroke patients. Stroke 1988;19:604–607 [DOI] [PubMed] [Google Scholar]
- 24.Sulter G, Steen C, De Keyser J. Use of the Barthel Index and modified Rankin Scale in acute stroke trials. Stroke 1999;30:1538–1541 [DOI] [PubMed] [Google Scholar]
- 25.Duncan PW, Jorgensen HS, Wade DT. Outcome measures in acute stroke trials: a systematic review and some recommendations to improve practice. Stroke 2000;31:1429–1438 [DOI] [PubMed] [Google Scholar]
- 26.Huybrechts KF, Caro JJ. The Barthel Index and modified Rankin Scale as prognostic tools for long-term outcomes after stroke: a qualitative review of the literature. Curr Med Res Opin 2007;23:1627–1636 [DOI] [PubMed] [Google Scholar]
- 27.Duncan PW, Sullivan KJ, Behrman AL, et al. Protocol for the Locomotor Experience Applied Post-stroke (LEAPS) trial: a randomized controlled trial. BMC Neurol 2007;7:39 [DOI] [PMC free article] [PubMed] [Google Scholar]
- 28.Bernhardt J, Dewey H, Thrift A, et al. A very early rehabilitation trial for stroke (AVERT) phase II safety and feasibility. Stroke 2008;39:390–396 [DOI] [PubMed] [Google Scholar]
- 29.Brott T, Adams HP, Olinger CP, et al. Measurements of acute cerebral infarction: a clinical examination scale. Stroke 1989;20:864–870 [DOI] [PubMed] [Google Scholar]
- 30.Gladstone DJ, Danells CJ, Armesto A, et al. Physiotherapy coupled with dextroamphetamine for rehabilitation after hemiparetic stroke: a randomized, double-blind, placebo-controlled trial. Stroke 2006;37:179–185 [DOI] [PubMed] [Google Scholar]
- 31.Sullivan KJ, Brown DA, Klassen T, et al. Effects of task-specific locomotor and strength training in adults who were ambulatory after stroke: results of the STEPS randomized clinical trial. Phys Ther 2007;87:1580–1602 [DOI] [PubMed] [Google Scholar]
- 32.Rossier P, Wade DT. Validity and reliability comparison of 4 mobility measures in patients presenting with neurologic impairment. Arch Phys Med Rehabil 2001;82:9–13 [DOI] [PubMed] [Google Scholar]
- 33.Wolf SL, Catlin PA, Gage K, et al. Establishing the reliability and validity of measurements of walking time using the emory functional ambulation profile. Phys Ther 1999;79:1122–1133 [PubMed] [Google Scholar]
- 34.Flansbjer UB, Holmback AM, Downham D, et al. Reliability of gait performance tests in men and women with hemiparesis after stroke. J Rehabil Med 2005;37:75–82 [DOI] [PubMed] [Google Scholar]
- 35.Wilson JTL, Hareendran A, Hendry A, et al. Reliability of the modified Rankin Scale across multiple raters: benefits of a structured interview. Stroke 2005;36:777–781 [DOI] [PubMed] [Google Scholar]
- 36.Wilson JTL, Hareendran A, Grant M, et al. Improving the assessment of outcomes in stroke: use of a structured interview to assign grades on the modified Rankin Scale. Stroke 2002;33:2243–2246 [DOI] [PubMed] [Google Scholar]
- 37.Banks JL, Marotta CA. Outcomes validity and reliability of the modified Rankin Scale: implications for stroke clinical trials—a literature review and synthesis. Stroke 2007;38:1091–1096 [DOI] [PubMed] [Google Scholar]
- 38.Lai SM, Duncan PW. Stroke recovery profile and the modified Rankin assessment. Neuroepidemiology 2001;20:26–30 [DOI] [PubMed] [Google Scholar]
- 39.Weimar C, Kurth T, Kraywinkel K, et al. Assessment of functioning and disability after ischemic stroke. Stroke 2002;33:2053–2059 [DOI] [PubMed] [Google Scholar]
- 40.Krampe A, Kuhnt S. Bowker's test for symmetry and modifications within the algebraic framework. Computational Statistics and Data Analysis 2007;51:4124–4142 [Google Scholar]
- 41.Deyo R, Centor R. Assessing the responsiveness of functional scales to clinical change : an analogy to diagnostic test performance. J Chronic Dis 1986;39:897–906 [DOI] [PubMed] [Google Scholar]
- 42.Delong ER, Delong DM, Clarkepearson DI. Comparing the areas under 2 or more correlated receiver operating characteristic curves: a nonparametric approach. Biometrics 1988;44:837–845 [PubMed] [Google Scholar]
- 43.Ward MM, Marx AS, Barry NN. Identification of clinically important changes in health status using receiver operating characteristic curves. J Clin Epidemiol 2000;53:279–284 [DOI] [PubMed] [Google Scholar]
- 44.Stratford PW, Binkley JM, Riddle DL, Guyatt GH. Sensitivity to change of the Roland-Morris Back Pain Questionnaire: part 1. Phys Ther 1998;78:1186–1196 [DOI] [PubMed] [Google Scholar]
- 45.Breiman I. Classification and Regression Trees Belmont, CA: Wadsworth International Group; 1984 [Google Scholar]
- 46.Portney LG, Watkins MP. Foundations of Clinical Research: Applications to Practice 3rd ed.Upper Saddle River, NJ: Pearson/Prentice Hall; 2009 [Google Scholar]
- 47.Newcombe R. Interval estimation for the difference between independent proportions: comparison of eleven methods. Stat Med 1998;17:873–890 [DOI] [PubMed] [Google Scholar]
- 48.Simel D, Samsa G, Martchar D. Likelihood ratios with confidence: sample size estimation for diagnostic test studies. J Clin Epidemiol 1991;44:763–770 [DOI] [PubMed] [Google Scholar]
- 49.Kwon S, Hartzema AG, Duncan PW, Lai SM. Disability measures in stroke: relationship among the Barthel Index, the Functional Independence Measure, and the Modified Rankin Scale. Stroke 2004;35:918–923 [DOI] [PubMed] [Google Scholar]
- 50.Huybrechts KF, Caro JJ, Xenakis JJ, Vemmos KN. The prognostic value of the modified Rankin Scale score for long-term survival after first-ever stroke. Cerebrovasc Dis 2008;26:381–387 [DOI] [PubMed] [Google Scholar]
- 51.Hardy SE, Perera S, Roumani YF, et al. Improvement in usual gait speed predicts better survival in older adults. J Am Geriatr Soc 2007;55:1727–1734 [DOI] [PubMed] [Google Scholar]
- 52.Studenski SA, Perera S, Wallace D, et al. Physical performance measures in the clinical setting. J Am Geriatr Soc 2003;51:314–322 [DOI] [PubMed] [Google Scholar]
- 53.Guralnik JM, Ferrucci L, Pieper CF, et al. Lower extremity function and subsequent disability: consistency across studies, predictive models, and value of gait speed alone compared with the short physical performance battery. J Gerontol A Biol Sci Med Sci 2000;55:M221–M231 [DOI] [PMC free article] [PubMed] [Google Scholar]
- 54.Lloyd-Jones D, Adams R, Carnethon M, et al. Heart disease and stroke statistics—2009 update: a report from the American Heart Association Statistics Committee and Stroke Statistics Subcommittee. Circulation 2009;119:e21–e181 [DOI] [PubMed] [Google Scholar]
- 55.Stephens JM, Goldie PA. Walking speed on parquetry and carpet after stroke: effect of surface and retest reliability. Clin Rehabil 1999;13:171–181 [DOI] [PubMed] [Google Scholar]
- 56.Evans MD, Goldie PA, Hill KD. Systematic and random error in repeated measurements of temporal and distance parameters of gait after stroke. Arch Phys Med Rehabil 1997;78:725–729 [DOI] [PubMed] [Google Scholar]
- 57.Fulk GD, Echternach JL. Test-retest reliability and minimal detectable change of gait speed in individuals undergoing rehabilitation after stroke. J Neurol Phys Ther 2008;32:8–13 [DOI] [PubMed] [Google Scholar]
- 58.Jorgensen HS, Nakayama H, Raaschou HO, et al. Outcome and time-course of recovery in stroke, 1: outcome. The Copenhagen Stroke Study. Arch Phys Med Rehabil 1995;76:399–405 [DOI] [PubMed] [Google Scholar]
- 59.Kasner SE. Clinical interpretation and use of stroke scales. Lancet Neurology 2006;5:603–612 [DOI] [PubMed] [Google Scholar]
- 60.Sullivan KJ. Letter to the editor on “Modified constraint-induced therapy in patients with chronic stroke exhibiting minimal movement ability in the affected arm.” Phys Ther 2007;87:1560. [DOI] [PubMed] [Google Scholar]
- 61.Centre for Evidence-Based Medicine Web site. [Accessed June 20, 2009]. Available at: http://www.cebm.net/index.aspx?o=1043.
Associated Data
This section collects any data citations, data availability statements, or supplementary materials included in this article.