

Abstract
The open morphogenesis of plants requires coordination of patterning by intercellular signals. The tobacco (Nicotiana tabacum cv Virginia Bright Italia) cell line VBI-0 provides a simple model system to study the role of intercellular communication in patterning. In this cell line, singular cells divide axially to produce linear cell files of distinct polarity. The trigger for this axial division is exogenous auxin. When frequency distributions of files are constructed over the number of cells per file during the exponential phase of the culture, even numbers are found to be frequent, whereas files consisting of uneven numbers of cells are rare. We can simulate these distributions with a mathematical model derived from nonlinear dynamics, which describes a chain of cell-division oscillators where elementary oscillators are coupled unidirectionally and where the number of oscillators is not conserved. The model predicts several nonintuitive properties of our experimental system. For instance, files consisting of six cells are more frequent than expected from a strictly binary division system. More centrally, the model predicts a polar transport of the coordinating signal. We therefore tested the patterns obtained after treatment with 1-N-naphthylphthalamic acid, an inhibitor of auxin efflux carriers. Using low concentrations of 1-N-naphthylphthalamic acid that leave cell division and axiality of division unaltered, we observe that the frequencies of files with even and uneven cell numbers are equalized. Our findings are discussed in the context of auxin transport as synchronizing signal in cell patterning.
Pattern formation in living organisms culminates in a predictable and reproducible relation between the various elements of the body plan. There are two principal modes that might lead to this nonrandom organization: (a) A stereotypic sequence of asymmetric, formative cell divisions could define differential developmental fates for the prospective descendants originating from this cell division (Weismann, 1892). As a characteristic of this “mosaic-mode” development, a removed element cannot be replaced by redefinition of neighboring elements, even at a stage when their differentiation has not become manifest. (b) The pattern originates from coordinative signaling between the elements that are patterned. In this “regulation mode” development, the removal of one element can be buffered by the remaining elements that are redefined with respect to their developmental fate. In the extreme case, a complete new body plan is established, although the resulting organism will be smaller (Spemann and Mangold, 1924). In the attempt to explain this so-called proportional harmony that is highly robust against stochastic fluctuations in the initial situation, the mathematics of Turing systems was adapted to biology (Turing, 1952). First developed to explain patterning in Hydra sp., a locally constrained, self-amplifying feedback loop of an activator was linked to a far-ranging mutual inhibition (Gierer and Meinhard, 1972). This socalled Gierer-Meinhard model was later found to be a very powerful tool to simulate a great number of biological patterns from segmentation in fruitfly (Drosophila melanogaster; Meinhard, 1986) to the formation of leaf veins (Meinhard, 1976).
As a developmental consequence of their sessile lifestyle, plants are characterized by extreme developmental flexibility. This includes so-called open morphogenesis, i.e. the body plan is continuously enlarged by addition of new elements and there is no innate limit to this reiterative enlargement. Consequently, a mosaic mode of patterning would not work in plants. The principal totipotency of plant cells highlights impressively the regulation mode of plant development. Almost independently of its developmental history, each plant cell can reestablish a complete new organism (somatic embryogenesis), and the body plan of such somatic embryos is indistinguishable from those originating from normal (zygotic) development.
Among the putative signals that regulate pattern formation in plants, the polar transport of auxin seems to play a central role. The pattern of vascular tissue (Aloni, 1987; Warren Wilson et al., 1994; Sachs, 2000), leaf veins (Mattsson et al., 1999), and the position of meristems (Hadfi et al., 1998; Reinhard et al., 2000) represent good examples for patterning events that are coordinated by polar auxin fluxes. For the patterning of vascular tissue, the model runs as follows: Initially, all cells are more or less equal in their competence to form a vessel. In response to environmental stimuli or stochastic fluctuations, one of them begins to transport more auxin than the neighbors, causing a draining effect. This will reinforce the polarity of this cell leading to an even stronger auxin transport in a self-amplifying feedback loop. This auxin-transporting cell differentiates into a vessel, whereas the depletion of auxin from the neighboring cells prevents them from differentiating into vascular tissue. By channeling the flow of auxin, the vessel precursor will capacitate the differentiation of its adjacent, downstream neighbor cell. Thus, the adjacent cells will coordinate their development such that they form a functional transport tissue. In this context, synchrony and coordination between neighboring cells are of extreme importance (Sachs, 1993; for review, see Sachs, 1991a, 1991b, 2000). Formally, the self-amplification of cell polarity by a polar auxin flow corresponds to the local activator in the Gierer-Meinhard model. Interestingly, the lateral inhibition is brought about by the competition of neighboring cells for limited resources of the activator, i.e. not by a real inhibitor molecule, but by the absence of an activating molecule. The same mechanism was later invoked to explain other patterning events, such as growth of new leaves, formation of side roots, or initiation of meristem, and is supported by mutant studies (for review, see Berleth and Sachs, 2001).
It is obvious, however, that polar auxin flux can be only one component of patterning and must interact with local differences in cellular competence (for review, see Scheres, 2000). The high complexity of plant organs or even tissue explants with a great number of different cell types makes it extremely difficult to study intercellular coordination on the cellular level. An ideal system should meet the following requirements: (a) It should consist only of one or few cell types. (b) It should possess the ability to establish axiality and polarity. (c) It should be predictable in its developmental responses. (d) It should be amenable to control by exogenous signals. (e) It should be easy to handle. (f) It should be accessible to cell biological analysis.
The tobacco (Nicotiana tabacum cv Virginia Bright Italia) cell line VBI-0 meets all of these requirements. It derives from stem pith parenchyma, i.e. the cells that can differentiate into vascular tissue in response to auxin flow. In the same way as its ancestor cells within the tissue, this cell line grows in cell files exhibiting basic characteristics in pattern formation such as clear axis and polarity of cell division and growth (Opatrný and Opatrná, 1976; Petrášek et al., 1998). The progression into the culture cycle, the duration of the lag phase, the rate of cell division, and the length of the exponential phase are strongly dependent on auxin action in this cell line (Zažímalová et al., 1995, 1996). Polarity and axiality of VBI-0 cells were recently shown to depend on the transport of auxin (Petrášek et al., 2002). The cell files are formed from singular cells, such that positional information inherited from the mother tissue does not play a role. If there are patterns of competence within a cell file, they must originate de novo during the culture cycle.
Using this cell line as a model system, we demonstrate that cell division within the file is partially synchronized, leading to a much higher frequency of cell files with even cell numbers as compared with files with uneven cell numbers. We can simulate our experimental data by a mathematical model derived from nonlinear dynamics, where elementary celldivision oscillators are coupled unidirectionally, and where the number of oscillators is not conserved. The model predicts several nonintuitive properties of our experimental system, among them a polar transport of the coordinating signal. We tested whether this signal is polar auxin flux and observed that we can remove the synchronization of cell division by low concentrations of 1-N-naphtylphthalamic acid (NPA), a well-known inhibitor of polar auxin transport (for review, see Morris, 2000). It has been shown repeatedly that auxin is necessary for the progress of the cell cycle and thus can be used to synchronize the cell cycle in plant-cell cultures (Stals and Inzé, 2001; Himanen et al., 2002). However, to our knowledge, this is the first time that auxin has been found to participate in the coordination of adjacent cell divisions.
RESULTS
Cell Division Is Synchronized by the Addition of Exogenous Auxins in VBI-0
The culture cycle in VBI-0 consists of two distinct phases: Cell divisions are confined to the first phase of the cycle, whereas the second phase is characterized by prominent cell elongation (Fig. 1). Figure 1A shows examples of morphological changes in VBI-0 cells along the culture cycle. A classical growth curve in Figure 1B plots cell density against time. Under standard conditions, the singular, polar cells prevailing at the time of subcultivation initiate strictly axial divisions around 2 to 3 d after subcultivation. The subsequent divisions in the cell file follow the axiality manifest from the first division. The two terminal cells show a clear polarity: The basal cell is rounder with the nucleus in the apical half of the cell, almost adjacent to the cross wall, whereas the apical cell is more pointed with a nucleus that is situated in the basal half of the cell but with a greater distance between nucleus and cross wall. After 10 to 12 d, the elongation phase initiates: The cells stop to divide and elongate in the direction of the file axis. At the end of the elongation phase (around 18 d after subcultivation) the files disintegrate, and the cells return to the status of the starting point. The total culture cycle lasts 21 d.
Figure 1.
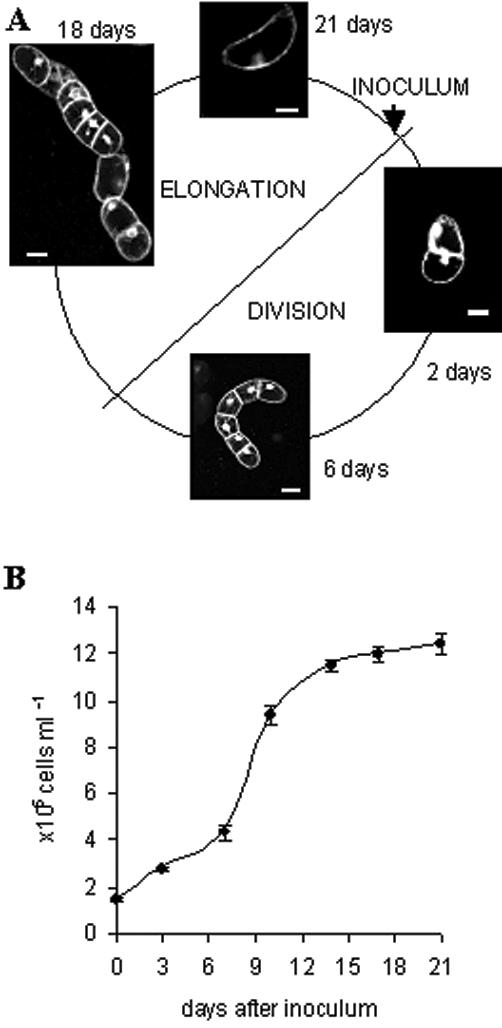
Schematic representation of the culture cycle in the tobacco cell line VBI-0. After inoculation in presence of auxin, singular cells divide into cell files presenting a clear axis of cell division and polarity. After 10 to 12 d, the cells stop to divide and elongate in the direction of the file axis. At the end of the elongation phase (around 18 d after subcultivation), the files disintegrate, and the cells return to the initial status. The images are confocal sections of cells stained with rhodamin-G6-chloride, a fluorescent membrane dye. Bars = 50 μm.
To test whether the initiation of cell division is triggered by auxin or just by the supply with fresh nutrients, we inoculated the cells at time 0 (21 d old from the previous culture cycle) in fresh Heller medium that was either complemented with the standard concentrations of auxins or in fresh medium without auxins. The number of cells per cell file as measure for division activity was scored at 2 d after inoculation (Fig. 2A, second and third bars). Under auxin starvation, the average number of cells per file was virtually identical to that of the original inoculum with the vast majority of cells still being in the singular state. In contrast, in the presence of auxin, most cells had already undergone the first division. The blocked cell division in the auxin-starved population was not due to reduced viability. In all of the samples, the cell viability was higher than 90% (data not shown).
Figure 2.
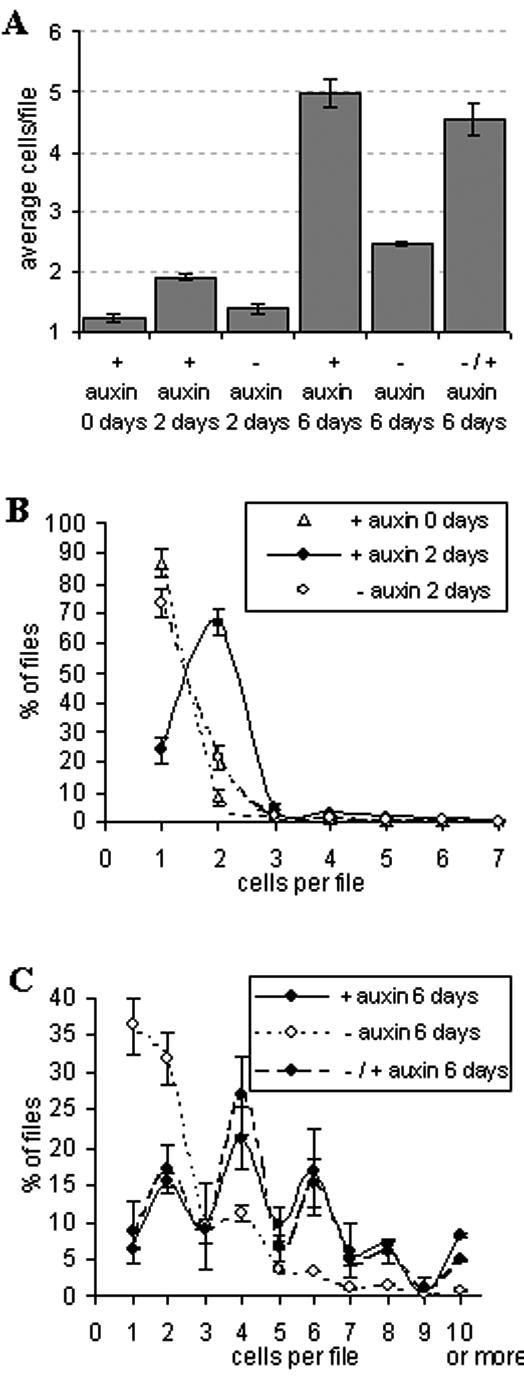
Auxin controls cell division in VBI-0 and is responsible for even cell numbers within individual files. Cells were either inoculated into fresh medium supplied with auxins (+auxin) or in auxin-free fresh medium (-auxin); in the “refeeding experiment,” cells that had been grown for 2 d in auxin-free medium were complemented with auxin and cultivated for further 4 d either without (-auxin) or with (+auxin) exogenous auxins. A, The average numbers of cells per file were determined for the initial state (0 d), and after 2 and 6 d, respectively. The frequency distributions over cell number per file are shown for 2 d after inoculation (B), for 6 d after inoculation, and for the refeeding experiment at 6 d after inoculation (C). Each experiment was repeated three times, scoring more than 103 cells per sample every time. Error bars indicate se.
Auxin starvation has been shown to stimulate production and accumulation of endogenous auxins, mainly indole-3-acetic acid (Zažímalová et al., 1995). Therefore, the starvation experiment was prolonged to test whether endogenous auxin influences cell division during later stages of the exponential phase (Fig. 2A, forth and fifth bars). Cell division remained suppressed in the auxin-starved population as compared with the control cultivated in presence of auxin. Again, the viability of the auxin-starved samples was the same as in the controls (data not shown). These data show that exogenous auxin is necessary to trigger cell division. In the context of the present work, exogenous auxin is defined as a 1:1 combination of 1-naphthaleneacetic acid (NAA) and 2,4-dichlorophenoxyacetic acid (2,4-D).
To test, whether auxin is sufficient to trigger cell division, we asked whether exogenous auxin can restore division in cells that had undergone auxin starvation for 2 d and therefore were blocked in their division. We observed that 4 d after this delayed addition of auxin (i.e. 6 d after inoculation), the average number of cells per file had reached the level of cells that had been continuously cultivated in presence of auxin (Fig. 2A, last bar). This refeeding experiment demonstrates that even under favorable conditions (i.e. when nutrients are freshly supplied), exogenous auxin is strictly necessary to trigger cell division.
In addition to the average cell numbers per file, we determined the corresponding frequency distributions over the cell population (Fig. 2, B and C). Two days after subcultivation (Fig. 2B), the presence of auxin shifted most of the cells into division (just around 25% of the files in the culture are still singular). In contrast, the addition of fresh medium without auxins blocked the population in the original situation with more than 70% of the files being singular. The level of cell coordination at 2 d after the addition of auxin is remarkable: up to 70% of the cell files had just undergone the first division. When the frequency distributions are analyzed after 6 d in the presence of auxins (Fig. 2C), pluricellular files have become very frequent. In contrast, the distribution of cells that had been cultivated under auxin starvation for 6 d is strongly shifted to low cell number files, close to the behavior of the original inoculum. Interestingly, cells cultured in the presence of auxins show an oscillatory behavior of the frequency distribution, with peaks of frequency for even cell number files. This alternating behavior was observed in every single independent experiment (data not shown) used for the pooled distribution in Figure 2C, suggesting that a high level of synchronization is maintained even at 6 d after subcultivation. We have recorded similar distributions through the entire exponential phase (5–9 d after subcultivation). This indicates that the oscillations represent a characteristic feature of exponential growth for this cell line in standard conditions. Moreover, when the frequency distributions were determined for the refeeding experiment, no significant differences were observed between prestarved cells that had been complemented with auxins at d 2 and cells that had been continuously cultivated in presence of auxin. Addition of auxin after 2 d of auxin starvation completely restored the oscillatory distribution observed in the controls.
Summarizing our data, we observed that (a) auxin is the trigger for cell division in VBI-0, (b) cell division is synchronized such that files with even cell numbers are much more frequent than files with uneven cell numbers, and (c) auxin can trigger not only cell division, but also the synchrony of cell division.
Mathematical Modeling
In a strictly binary system of cell division, files consisting of 2n cells (2, 4, 8, 16...) should be most frequent. In our system, however, we observe that files consisting of six cells are highly frequent, even more than files consisting of eight cells, which is difficult to reconcile with a strictly binary system. Thus, we conjecture the existence of some exchange of information (coupling) between the cells that coordinates and synchronizes cell division. To test whether the observed deviation from a binary system could be caused by coupling, we developed a simple mathematical model to simulate the dynamics of cell number for different combinations of coupling and innate cell cycle variability.
In the terminology of nonlinear dynamics, our cell culture system can be described as a one-dimensional array of coupled oscillators, where the number of oscillators is not conserved over time. Instead, a new oscillator is generated and inserted adjacent to the “parent” cell, whenever a certain oscillator has finished one cell cycle. In this framework, a given oscillator could run its loop freely (no coupling). Alternatively, it could sense an interference with the two neighboring oscillators (bilateral coupling) or just with one of them (unilateral coupling). Using this theoretical background, the patterns of cell number can be modeled with a reiterative algorithm from the singular cell state through the formation of a pluricellular file of N cells. The growth of cell number per file can thus be simulated as a function of time, N(t).
In this model, the state of each oscillator, i = 1.N(t), is simply defined by a real number, called the phase τi, which describes the time the cell will need to accomplish its cell cycle in the absence of coupling. Each simulation starts with the singular cell state, N(0)=1. Then, time is increased until the first oscillator i has completed one cycle. As a consequence, its phase is reduced to zero, τi (t)=0. At this time point, the following two events are introduced:
(a) To describe unidirectional coupling, the phase of the right neighbor of the dividing cell, i + 1, is reduced by ε (degree of coupling strength),
 |
Here, we have taken into account that the remaining time to cell division cannot be lower than zero. Thus, the length of the neighboring cell cycle is reduced due to interfering signals from the dividing cell. In this way, a higher chance of division is induced in the neighbor. In the case of bidirectional coupling, the phases of both the right and left neighbor are reduced by the same amount ε; whereas in the scheme without coupling, the neighboring phases are left unchanged.
(b) The mother cell is removed and replaced by two newly generated daughter cells. Thereby the total number of cells in the file increases by one.
 |
The two newborn cells are inserted in the cell file at the position of the mother cell. Each of the two daughter cells is assigned with a new independent random phase, which describes its natural period length in the absence of coupling. This value is a random number taken from a Gaussian distribution with mean period length T and sd σ.
This algorithm is repeated until a certain large time is passed, in this way successively generating a chain of cells. The total number of cells is scored as a function of time, N(t). Note that the model is based on the assumption that cell files continue to divide to arbitrary size. This means that the model does not incorporate the elongation phase with a division stop after a certain time. Second, both daughter cells originating from a division are treated equally and in particular are independent of the previous state (i.e. period length) of their mother cell.
The model depends on only three basic parameters. (a) The average free-running period length T. This parameter does not inflict any dynamical consequence because a change in T only results in an overall rescaling of time and can easily be fitted to the experimental data. However, note that the observed period length is shorter than the free-running period length T, because it is reduced by the coupling. The observed period length can be estimated from the average number of cells per file at different time points of the culture cycle (Table I). In our model, we used for the free-running period length a somewhat increased value of T = 4 d as first approximation. (b) The variability of natural period length σ. This parameter describes the disorder of the cell cycle measured as the sd of the natural period length in percent of the mean natural period T. In our simulations, we varied σ in the range from 5% up to 50%. (c) Degree of coupling ε. Because in our model, coupling results in a reduction of period length, we measure the coupling strength in percent of the mean period length, T. In our simulation we vary ε in the range from 0% to 100%.
Table I.
Estimation of the cell cycle length from the data shown in Figure 2
The time course of cell division can be approximated by an exponential curve: N(t) = N(0)·ekt with k being the average time of the cell cycle, t the time after inoculation, N(t) the average cells per file at time t, and N(0) the initial number of cells in the inoculum. This approximation leads to an estimate for k of 2.9 d.
| Time after Inoculation (t) | Average Cells/File (N) |
|---|---|
| d | |
| 0 | 1.23 |
| 2 | 1.92 |
| 6 | 4.96 |
To describe the growth over a population of files and to obtain good statistics, the whole program was repeated for a large number files, and the results were averaged over a large number of simulation runs (here at least 2,000). For each of these possibilities, the algorithm was calculated for a large number of files (at least 2,000), and the simulated frequency distributions of cell number (as estimate for the probability) were plotted as number of cells per file at a given time point.
Figure 3 depicts the simulation results. Plotted are the distribution of percentage of files with a certain number of cells per file at successive days. To indicate probability frequencies, a gray scale was used, in which the white color represents a probability of 0% and the black color a probability of 100%.
Figure 3.

Simulation of the temporal dynamics for the number of cells in individual files using a model based on coupling of elementary oscillators. The probability distributions of cell number per file are plotted for different combinations of coupling and cell-cycle variability after averaging more than 2,000 simulation runs. Left, Predicted dynamics of cell number per file during successive days (percentage). The probability for each number at a given time point is coded by a gray scale in which the white color represents a probability of 0% and the black color a probability of 100%. Time is given in days elapsed from the initial state where there is only one cell with random phase. Therefore, the average number of cells at total division time 0 equals one. Right, Probability distributions predicted for d 0 (dashed line, circles), d 2 (dotted line, triangles), and d 6 (solid line, stars). These distributions take into account that the initial cell number per file at time 0 was 1.23 (see Table I). The details of the model are explained in the text. A and B, Low variability (σ = 8%) and strong degree of coupling (ε = 100%). C and D, Medium variability (σ = 40%) strong degree of coupling (ε = 100%). E and F, Medium variability (σ = 40%) weak degree of coupling (ε = 40%). G and H, Medium variability (σ = 40%) no coupling (ε = 0%).
Peaks of probability for even cell numbers were neither obtained when the algorithm was run at a large degree of cell-cycle variability, nor for bilateral coupling (data not shown). However, under the assumption of strong unilateral coupling, even cell numbers are more frequent than uneven cell numbers. For low or medium variability of cell-cycle length, the simulation fits to our experimental data, showing peaks of probability in correspondence of even cell number files and a relatively high incidence of files consisting of six cells (Fig. 3, A–D), which was never observed in any of the other combinations (data not shown).
When the model is run at complete absence of coupling, it culminates into a binary distribution with probability peaks at 2, 4, 8,.... 2n cells per file, when the variability of the cell cycle is low (data not shown). When the variability of the cell cycle is intermediate and the coupling is weak (Fig. 3, E and F) or absent (Fig. 3, G and H), files with two and four cells become frequent, but files with three cells are also more frequent as compared with the strong unilateral coupling (Fig. 3, C and D). Under these conditions, the model predicts complete randomization for the incidence of files with more than four cells.
To test the reliability of our model, we compared the simulated distributions with our experimental data. To generate a highly significant data set, we determined division distribution in 17 independent experiments comprising more than 103 cells each time. We observed the described oscillatory synchrony in each single experiment (the pooled distribution is shown in Fig. 4). This highly reproducible pattern indicates that the mechanism responsible for this synchronicity must be very robust. In particular, the simulation using strong unilateral coupling at medium cell-cycle variability leads to a predicted frequency distribution that closely fits to the experimental data that had been collected at d 6 after inoculation (Fig. 4).
Figure 4.
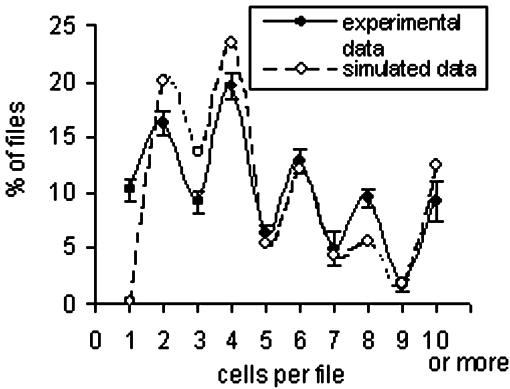
Comparison between experimental data and simulation. The distribution observed after 6 d in presence of auxin is shown as a solid line (experimental data). The distribution pools the data of more than 17 × 103 cells from 17 independent experiments. The distribution predicted by the model for strong unilateral coupling at medium cell-cycle variability (simulated data) is indicated by the dotted line. Error bars indicate se.
NPA, an Inhibitor of Polar Auxin Transport, Eliminates the Coupling
The mathematical model could approximate the observed frequency distribution under the assumption of strong unilateral coupling. Because auxins can already trigger cell division per se (Fig. 2A) but in addition can restore the peculiar frequency distribution over cell number per file (Fig. 2C), we asked whether the coupling signal might be auxin.
We therefore inoculated VBI-0 cells either under standard conditions (control) or in presence of 5 μm NPA, an inhibitor of polar auxin transport. The concentration was chosen such that auxin transport is impaired, but not completely eliminated (Petrášek et al., 2002) to avoid unspecific side effects of auxin hyperaccumulation. This treatment did not affect the overall rate of cell division (Fig. 5A, first two bars), and, consistently, we did not detect any reduction in viability (data not shown). However, the distribution of cell division is strongly affected (Fig. 5C, compare the solid curve for the control with the dotted line for the sample treated with 5 μm of NPA). Especially for files with a higher number of cells, the difference in the incidence of even and uneven numbers vanished completely. Only a slightly reduced frequency of files with three cells as compared with those with two or four persisted the treatment with this inhibitor. This frequency distribution is predicted by the model for intermediate variability in the length of the cell cycle and weak coupling (Fig. 3, E and F). It should be noted that at this concentration, the polarity of the cell file was mostly unaltered, and we observed absolutely no effect on the axiality of cell files (data not shown). We also did not observe any stimulation of cell elongation (Fig. 5B, first two bars). However, when we performed this analysis with a high concentration of NPA that causes a complete block of polar auxin transport (50 μm), we observed an inhibition of cell division (Fig. 5A, last bar), a stimulation of cell elongation (Fig. 5B, last bar), and a dramatic loss of file polarity and axiality (data not shown), consistent with recently published data (Petrášek et al., 2002). Under these conditions, files with more than four cells are very rare (Fig. 5C, white symbols and dashed curve). Again, the probability of files composed of three cells is almost the same as that for files with four cells.
Figure 5.
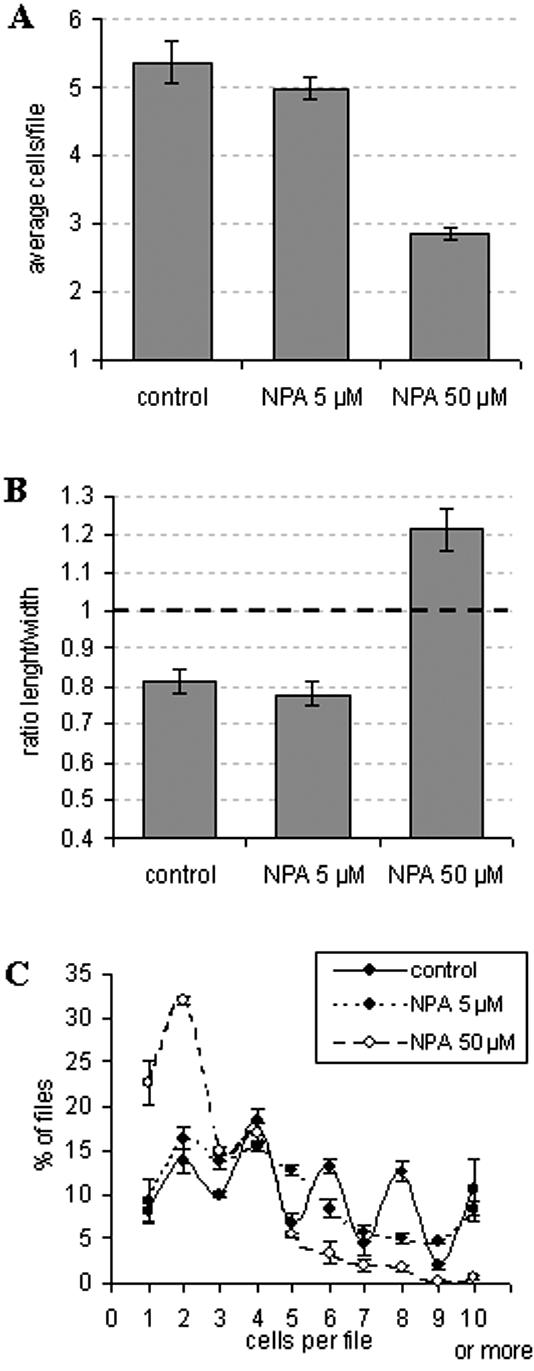
Effect of NPA on cell division and cell elongation in VBI-0. Cells were either inoculated under standard conditions with auxin alone (control) or in presence of auxin combined with 5 μm or 50 μm NPA, respectively, and the effects on cell division and elongation were assayed at d 6 after inoculation. A, Average cell number per file. B, Average ratio of cell length to width. C, Frequency distribution over cell number per file. The data are pooled from more than 5 × 10³ cells from five independent experiments. For the ratio of cell length and width, more than 300 individual cells from three independent experiments were viewed by confocal microscopy and images recorded for the central section of the cell. Error bars indicate se.
Summarizing the inhibitor experiments, we observe that low concentrations of NPA that do not affect the overall degree of cell division, the proportionality of cell expansion, axiality or polarity of the files, or their viability eliminate more or less completely the synchrony of cell division mirrored in the predominance of even-numbered cell files.
NPA Impairs the Coordination of Cell Cycles along the Cell File
To better understand the dynamics of file growth, the cells were fixed in early exponential phase (4 d after inoculation), and images were recorded after staining the DNA with Hoechst. This allowed location of mitotic events along the cell file. The observed division patterns were grouped into different categories: synchronous division (i.e. all of the cells in the file undergo mitosis in the same moment), division starting from one edge of the file, division initiating from the center of the file, or random (no visible connection between division events within a file). The frequency of these categories was scored either in standard condition (control) or under 5 μm of NPA (Fig. 6A). This concentration was chosen to avoid side effects due to inhibition of cell division.
Figure 6.
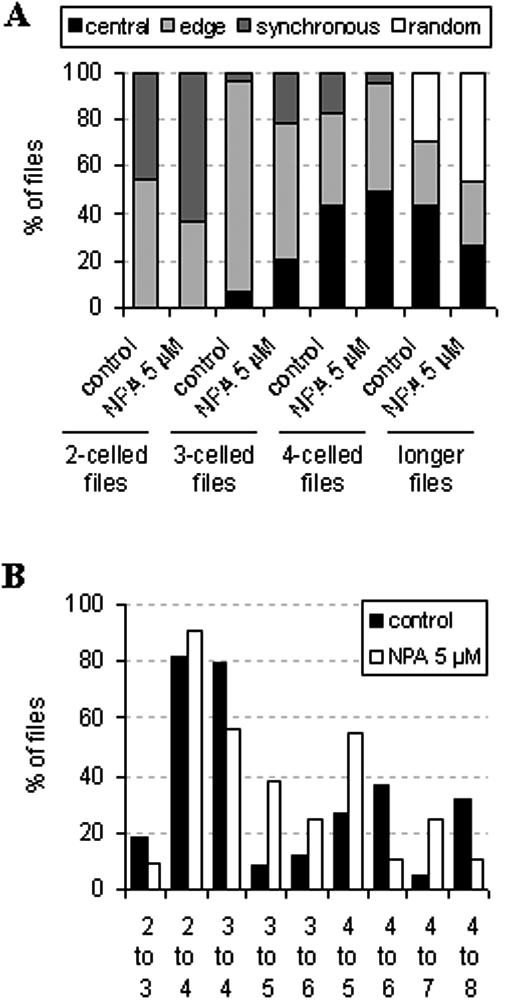
Effect of NPA on the localization of cell division events along individual cell files. After 4 d of cultivation in either standard conditions with auxin alone or with auxin in combination with 5 μm NPA, the cells were fixed, and the DNA was stained with Höchst for pictures recording. Individual files were grouped according to the spatial pattern of division (A) or to the transitions between different cell numbers (B), and corresponding frequency distributions were constructed. A, Spatial pattern of cell divisions in relation to cell number per file. Synchronous, All cells of a file divide simultaneously; edge, division is initiated at one edge of the file and spreads into the file; central, division initiates in one center of the file; random, division initiates at different locations of a cell file. B, Dynamics of file growth. Files of a given cell number n were grouped, and within this population (defined as 100%), the frequency of transitions into the subsequent cell numbers (n + 1, n + 2) was plotted.
We observed that mitosis along the cell file is rarely an isolated event: Commonly, several cells of the same file region divide simultaneously generating waves of mitosis. In the control, synchronous division was frequent only among bicellular files (around 50%), whereas division waves from the edge prevailed for files composed of three or more cells. For files with four or more cells, an increasing number of division “hot-spots” in the file center was noted, and for long cell files (five or more), random division could be observed. However, not a single case for a quadricellular file with random division was ever noted.
NPA was affecting mostly files composed of two and three cells. In both cases, the frequency of synchronous divisions was higher after treatment with NPA as compared with the control, whereas the frequency of division waves from the edge of the file was reduced. For higher cell numbers, NPA increased the frequencies of central and random division events as compared with the respective control values.
We asked then, whether we could trace preferential transitions from a given cell number to certain, higher cell numbers. We defined the total number of files of a given cell number n as 100% and then scored how many of those files chose the transition to the number n + 1, n + 2, and so forth (Fig. 6B). Under standard conditions, almost all bi- or tricellular files pass directly into the quadricellular state, and from there, they preferentially pass into the six- and the eight-cell stage. The treatment with NPA affects the first division steps (until the formation of quadricellular files) only marginally. However, quadricellular files loose their preference for a transition into evennumbered files, but more often they form files composed of five or seven cells.
DISCUSSION
In plants with their open morphogenesis, the patterning of cells and tissues must cope with the continuous expansion of the body plan through reiterative addition of new elements. Several experiments demonstrated the central role of basipetal auxin transport in mediating plant pattern formation (Friml et al., 2002; Friml, 2003; for review, see Berleth and Sachs, 2001). However, the idea of auxin as morphogen acting on a homogenous population of cells that respond exclusively to the local concentration of the morphogen does not completely explain all of the aspects of patterning in plants: High levels of synchronization and coordination between different parts must play an important role, as well as specific local differences in cell competence. Therefore it would be extremely important to study the fine cellular events that characterize the control of patterning.
The VBI-0 tobacco cv Virginia Bright Italia cell line represents an ideal system to study cellular aspects of pattern formation. This cell line is a relatively homogenous system easily accessible to cell biological analysis and endowed with the ability to establish axiality and polarity.
Our first data shown in Figure 2 demonstrated that the system is amenable to an external control by exogenous auxin. It is exogenous auxin that triggers a new culture cycle in VBI-0 (Fig. 2A), and it is exogenous auxin that synchronizes the cell cycle (Fig. 2B). Even at 6 d after inoculation, cell division remains mostly blocked when the cells are left without exogenous auxin (Fig. 2, A and C). The slight, residual division activity persisting under these conditions could be due to endogenously produced auxin (Zažímalová et al., 1995) or more probably could be caused by a small exogenous auxin pool present in the original inoculum. The effect is anyway marginal compared with the induction of cell division in response to exogenous auxin.
In the presence of exogenous auxins, a clear pattern of cell division consisting in elevated frequencies of even-numbered cell files becomes manifest (Figs. 2C and 4). Through refeeding experiments (Fig. 2, A, last bar, and C), we were able to demonstrate that the expression of this pattern depends on exogenous auxin. However, it is astonishing that the patterning program will lead to a correct pattern independently from the time when auxin is added. To get insight into the mechanism of this highly robust patterning program, we ventured to model the pattern using a nonlinear dynamics approach.
The VBI-0 cell culture can be conceived as an array of oscillators, the number of which is not conserved on time. This allowed us to mathematically model the division pattern during the exponential phase. The in silico simulation performed according to this model could approximate our experimental data when a specific precondition was met. When the probability of a given cell to divide is enhanced by a neighboring cell and the enhancing signal moves unidirectionally through the cell file (Fig. 3, A–D), predicted and observed distributions match almost perfectly (Fig. 4).
Consistent with previously published data (Zažímalová et al., 1996), we find that auxin has a highly synchronizing effect on cell division in VBI-0 (Fig. 2). In addition, auxin is known in planta to be transported unidirectionally through the tissues. For the context of VBI-0, auxin transport was shown to be required for cell division, cell axiality, and file polarity (Petrášek et al., 2002). Therefore, we have chosen auxin as a potential candidate for the unilaterally transported coupling agent, and we have tested this hypothesis experimentally. We observe that the inhibition of auxin transport produces a frequency distribution (Fig. 5C) where files with three cells are almost as frequent as those with two and four cells and where files of higher cell numbers are rare and do not show a predominance of even numbers. This would be predicted by our model for a reduction or elimination of coupling (Fig. 3, E–H), which is evidence for intrafile auxin transport being required for the patterning of cell division.
When we analyzed the dynamics of file growth (Fig. 6), we noticed that, under standard conditions, mitosis within a given cell file is rarely an isolated event, but that the individual cells of a file divide coordinately preferentially following division waves that start from one edge and “move” polarly through the file. This is especially true for low-numbered cell files (composed of two, three, and four cells), whereas files of higher cell number display an increased frequency of central divisions (Fig. 6A). As a consequence of this coordinated wave of mitoses, the files develop preferentially into even-numbered states (six and eight cells), independently from their original cell number (Fig. 6B).
In contrast, treatment with 5 μm NPA impairs the formation of division waves in bi- and tricellular files as compared with the control. Instead, central (in tri- and quadricellular files) and random divisions (in the longer cell files) become more frequent (Fig. 6A). Although the initial divisions leading to the tri- or quadricellular state seem to proceed mostly in the same way as for the controls, the impaired coordination of cell division becomes manifest during the subsequent division events: tri- and quadricellular files generate odd-numbered files at high frequency, such that the frequency peaks for even-numbered files typical for cells grown in standard conditions do not emerge after treatment with NPA (Fig. 6B).
Together with the data shown in Figure 2, these results allow us to draw a model on the dynamics of division coordination in standard conditions: The first cell division is triggered by the exogenous auxin added at the time of inoculation. In most of the newborn bicellular files, both daughter cells divide simultaneously to generate files composed of four cells. This second division-step could either still be controlled through the added auxin or could alternatively already be coordinated by an internal signal. For the next two divisions, a clear coordination via the coupling signal (most likely polar auxin transport) reinforces the formation of even-numbered files. When the cell number per file increases, these polar division waves are progressively overlaid by newly emerging hot spots of mitosis in the internal regions of the file and eventually even randomly localized mitoses. This indicates that for an increasing number of cells in a file, the relative influence of the coupling weakens progressively. This model of division dynamics is perfectly compatible with the observed frequency distribution (Fig. 5) and the frequency distribution predicted for unilateral coupling.
In the original situation within the plant tissue, the ancestors of the VBI-0 cell line can respond to auxin fluxes by forming contiguous vessels. In a classical experiment by Sachs (1981), auxin was provided in a way that no flux of auxin could occur. Under these conditions, no vessels could be regenerated. However, as soon as an outlet was created such that auxin could flow, new vessels formed in the direction of the flow. This means that the pattern is not generated by auxin per se, but by the flux of auxin. This means that auxin acts just as a trigger that allows local, intrinsical differences between neighboring cells to generate a visible pattern. In the terminology of the Gierer and Meinhard (1972) model, polar auxin flow acts as self-amplifying activator, whereas mutual competition of neighboring cells for auxin plays the role of lateral inhibition. Our refeeding experiments show that there exists an intrinsic prepattern that is independent of auxin but is rendered manifest in response to exogenous auxin. Already, a mild inhibition of polar auxin transport that leaves cell division rate as such as well as cell axiality and polarity untouched can remove the preponderance of even-numbered cell files. This indicates that the pattern is intimately linked to a flow of auxin. In other words, our experimental system has truly preserved the patterning principles of its ancestor tissue.
CONCLUSIONS
From this study, we find that the tobacco cell line VBI-0 is an ideal basic system for studying cellular events controlling auxin-induced pattern formation in plants. Our NPA experiments, in combination with the in silico simulations we performed, clearly demonstrated that auxin polar transport, and not auxin per se, mediates pattern formation. In particular, our NPA experiments highlighted another very interesting issue. Consistent with recently published data (Petrášek et al., 2002), high (50 μm) concentrations block axiality and polarity in VBI-0 and slow down cell division (Fig. 5A) in favor of enhanced cell elongation (Fig. 5B). However, cells treated with 5 μm NPA did not show any effect on division rate and axiality, but already a dramatic loss of the signal coordinating cell division (Fig. 5). This means that the cells are much more sensitive to manipulation of the coupling signal compared with other auxin-dependent effects. This finding opens the interesting question of how a cell flooded by exogenous auxin can distinguish between auxin influx from the medium and intrafile auxin flux.
We are presently investigating the patterns of division and elongation in response to altered balance between different auxins. To understand how a dividing cell can convey through auxin transport a coordinative signal to a neighboring cell, it will be necessary to visualize auxin abundance and dynamics on the cellular level.
MATERIALS AND METHODS
Cell Line
The tobacco (Nicotiana tabacum) cell line VBI-0 derives from stem pith explants of cv Virginia Bright Italia (Opatrný and Opatrná, 1976) and was cultivated in slightly modified Heller's liquid medium (Heller, 1953) supplemented with the synthetic auxins 2,4-D (4.5 μm; Fluka Chemie AG, Neu-Ulm, Switzerland) and NAA (5.4 μm; Sigma-Aldrich, St. Louis). Cells were subcultured every 3 weeks (Petrášek et al., 1998), inoculating 4 mL of stationary cells (5 × 10⁶ cells mL-1) into 30 mL of fresh medium in 100-mL Erlenmeyer flasks, and incubation at 25°C in darkness on an orbital shaker (KS250 basic, IKA Labortechnik, Staufen, Germany) at 120 rpm (1.8 cm diameter).
Morphometry
Aliquots (0.25 mL) from each sample were stained with 1:100 (v/v) Rhodamin-G6-chloride for 10 min on a topover-shaker and destained twice for 5 min in 1 mL of culture medium. Cells were then immediately viewed under a confocal laser scanning microscope (DM RBE, Leica, Bensheim, Germany) using a one-channel scan with an argon-krypton laser at 568-nm excitation, a 575-nm beam splitter, and 590-nm emission filters. Image stacks were recorded at 200-fold magnification along the z axis, and cell length and width were determined from the central section of the cells using the Scion Image Software (Scion, Frederick, MD). For each data point, 300 individual cells from three independent experimental series were scored.
Determination of Cell Viability and Division Pattern
Cell viability was assayed by the Trypan Blue dye exclusion test (Phillips, 1973). Aliquots (0.5 mL) from each sample were stained with 0.4% (w/v) Trypan Blue solution (Sigma-Aldrich) at a ratio of 1:100 (v/v). After incubation for 3 min, the frequency of the unstained viable cells was scored as well as the number of cells per individual file using a Fuchs-Rosenthal hematocytometer under a bright-field microscope. For each single sample, 103 cells were scored.
Auxin Starvation and Refeeding Experiments
For the auxin starvation experiments, stationary cells (cultured for 21 d under standard conditions) were inoculated into 30 mL of the usual culture medium that was void of exogenous auxins. In the refeeding experiments, the inoculum was first cultured for 2 d in hormone-free medium, and the hormones were then added directly into the auxin-starved cultures starting from filter-sterilized stocks of 5 mg mL-1 NAA and 5 mg mL-1 2,4-D dissolved in 96% (v/v) ethanol. An equal volume of sterile 96% (v/v) ethanol was added to the control samples.
In Silico Simulation
Simulations were performed with the MATLAB software and were run both on a DEC workstation and a Windows PC with identical results. The algorithm of the model is detailed in “Results”. The MATLAB source code of the program is available from the authors on demand.
NPA Treatments
NPA was synthesized by Dr. Wolfgang Michalke (Albert-Ludwigs-Universität Freiburg, Institut für Biologie III, Freiburg, Germany) according to Thompson et al. (1973). NPA was added at inoculation from a filter-sterilized stock of 34 mm NPA in dimethyl sulfoxide to final concentrations of 5 or 50 μm. Equal aliquots of sterile dimethyl sulfoxide were added to the control samples.
Scoring Division Events along Individual Cell Files
Cells were inoculated in standard conditions with auxin or with auxin in combination with 5 μm of NPA. Four days after inoculation, aliquots were fixed in Carnoy fixative (3:1 [v/v] 96% [v/v] ethanol:acetic acid) plus 0.5% (w/v) Triton X-100 and stained with Hoechst 33258 (Molecular Probes, Leiden, Netherlands). Randomly selected files were recorded under a fluorescent microscope (Axioskop 2, Zeiss, Oberkochen, Germany) using a 4′,6-diamino-phenylindole filter set (365-nm excitation, 395-nm beam splitter, and 397-nm emission; Zeiss). The observed patterns were grouped according to the cell number and the localization of cell division as specified in “Results” with a minimum of 50 files scored for each data point.
Acknowledgments
NPA was kindly provided by Dr. Wolfgang Michalke (Albert-Ludwigs-Universität Freiburg).
Article, publication date, and citation information can be found at www.plantphysiol.org/cgi/doi/10.1104/pp.103.027953.
This work was supported by the Volkswagen-Foundation Nachwuchsgruppen-Programme (grants to P.N. and B.B.).
References
- Aloni R (1987) Differentiation of vascular tissue. Annu Rev Plant Physiol 38: 179–204 [Google Scholar]
- Berleth T, Sachs T (2001) Plant morphogenesis: long-distance coordination and local patterning. Curr Opin Plant Biol 4: 57–62 [DOI] [PubMed] [Google Scholar]
- Friml J (2003) Auxin transport: shaping the plant. Curr Opin Plant Biol 6: 7–12 [DOI] [PubMed] [Google Scholar]
- Friml J, Benkova E, Blilou I, Wisniewska J, Hamann T, Ljung K, Woody S, Sandberg G, Scheres B, Jürgens G et al. (2002) AtPIN4 mediates sink driven auxin gradients and patterning in Arabidopsis roots. Cell 108: 661–673 [DOI] [PubMed] [Google Scholar]
- Gierer A, Meinhard H (1972) A theory of biological pattern formation. Kybernetik 12: 30–39 [DOI] [PubMed] [Google Scholar]
- Hadfi K, Speth V, Neuhaus G (1998) Auxin-induced developmental patterns in Brassica juncea embryos. Development 125: 879–887 [DOI] [PubMed] [Google Scholar]
- Heller R (1953) Studies on the mineral nutrition of in vitro plant tissue cultures (in French). Ann Sci Nat Bot Biol Veg 14: 1–223 [Google Scholar]
- Himanen K, Boucheron E, Vanneste S, de Almeida Engler J, Inzé D, Beeckman T (2002) Auxin-mediated cell cycle activation during early lateral root initiation. Plant Cell 14: 2339–2351 [DOI] [PMC free article] [PubMed] [Google Scholar]
- Mattsson J, Sung ZR, Berleth T (1999) Responses of plant vascular systems to auxin transport inhibition. Development 126: 2979–2991 [DOI] [PubMed] [Google Scholar]
- Meinhard H (1976) Morphogenesis of lines and nets. Differentiation 6: 117–123 [DOI] [PubMed] [Google Scholar]
- Meinhard H (1986) The threefold subdivision of segments and the initiation of legs and wings in insects. Trends Genet 3: 36–41 [Google Scholar]
- Morris DA (2000) Transmembrane auxin carrier systems-dynamic regulators of polar auxin transport. Plant Growth Regul 32: 161–172 [DOI] [PubMed] [Google Scholar]
- Opatrný Z, Opatrná J (1976) The specificity of the effect of 2,4-D and NAA on the growth, micromorphology, and occurrence of starch in long-term Nicotiana tabacum L. cell strains. Biol Plant 18: 359–365 [Google Scholar]
- Petrášek J, El[caron]ckner M, Morris DA, Za ímalová E (2002) Auxin efflux carrier activity and auxin accumulation regulate cell division and polarity in tobacco cells. Planta 216: 302–308 [DOI] [PubMed] [Google Scholar]
- Petrášek J, Freudenreich A, Heuing A, Opatrný Z, Nick P (1998) Heatshock protein 90 is associated with microtubules in tobacco cells. Protoplasma 202: 161–174 [Google Scholar]
- Phillips HJ (1973) Dye exclusion tests for cell viability. In PF Kruse, MK Patterson, eds, Tissue Cultures: Methods and Application. Section VIII: Evaluation of Culture Dynamics. Academic Press, New York, p 406
- Reinhard D, Mandel T, Kuhlemeier C (2000) Auxin regulates the initiation and radial position of plant lateral organs. Plant Cell 12: 507–518 [DOI] [PMC free article] [PubMed] [Google Scholar]
- Sachs T (1981) The controls of the patterned differentiation of vascular tissues. Adv Bot Res 9: 151–262 [Google Scholar]
- Sachs T (1991a) Cell polarity and tissue patterning in plants. Development Suppl 1: 83–93 [Google Scholar]
- Sachs T (1991b) Pattern formation in plant tissues. Cambridge University Press, Cambridge.
- Sachs T (1993) The specification of meristematic cell orientation by leaves and by auxin. Aust J Plant Physiol 20: 541–553 [Google Scholar]
- Sachs T (2000) Integrating cellular and organismic aspects of vascular differentiation. Plant Cell Physiol 41: 649–656 [DOI] [PubMed] [Google Scholar]
- Scheres B (2000) Non-linear signaling for pattern formation? Curr Opin Plant Biol 3: 412–417 [DOI] [PubMed] [Google Scholar]
- Spemann H, Mangold H (1924) Über Induktion von Embryonalanlagen durch Implantation artfremder Organisatoren. Wilhelm Roux' Arch Entwicklungsmech Org 100: 599–638 [Google Scholar]
- Stals H, Inzé D (2001) When plant cells decide to divide. Trends Plant Sci 6: 359–364 [DOI] [PubMed] [Google Scholar]
- Thompson KS, Hertel R, Müller S, Tavares JE (1973) 1-N-naphthylphthalamic and 2, 3, 5-triiodobenzoic acids: in vitro binding to particulate cell fractions and action on auxin transport in corn coleoptiles. Planta 109: 337–352 [DOI] [PubMed] [Google Scholar]
- Turing AM (1952) The chemical basis of morphogenesis. Philos Trans R Soc Lond Ser B 237: 37–72 [Google Scholar]
- Warren Wilson J, Keys WMS, Warren Wilson PM, Roberts LW (1994) Effects of auxin on the spatial distribution of cell division and xylogenesis in lettuce pith explants. Protoplasma 183: 162–181 [Google Scholar]
- Weismann A (1892) Aufsätze über Vererbung und verwandte biologische Fragen. G. Fischer, Jena, Germany
- Zažímalová E, Bøezinová A, Holik J, Opatrný Z (1996) Partial auxin deprivation affects endogenous cytokinins in an auxin-dependent, cytokinin-independent tobacco cell strain. Plant Cell Rep 16: 76–79 [DOI] [PubMed] [Google Scholar]
- Zažímalová E, Opatrný Z, Bøezinová A, Eder J (1995) The effect of auxin starvation on the growth of auxin-dependent tobacco cell culture: dynamics of auxin-binding activity and endogenous free IAA content. J Exp Bot 46: 1205–1213 [Google Scholar]