Abstract
Extraction parameters of flavonoids from Ipomoea batatas leaf (FIBL) and anti-diabetic activity of FIBL on alloxan induced diabetic mice were studied. The optimal extraction parameters of FIBL were obtained by single factor test and orthogonal test, as follows: ethanol concentration 60 %, ratio of solvent to raw material 30, extraction temperature 75 ° and extraction time 1.5 h, while extraction yield of FIBL was 5.94 %. FIBL treatment (50, 100, and 150 mg/ kg body weight) for 28 days resulted in a significant decrease in the concentration of fasting blood glucose (FBG), total cholesterol (TC) and triglyceride (TG) in diabetes mellitus mice. Furthermore, FIBL significantly increased body weight (bw) and serum high-density lipoprotein cholesterol (HDL-c) level. The data demonstrated FIBL at the dose of 100 mg/kg bw exhibited the optimal effect. The above results suggest that FIBL can control blood glucose and modulate the metabolism of blood lipid in diabetes mellitus mice.
Keywords: flavonoids from Ipomoea batatas leaf, extraction, anti-diabetic
Introduction
Diabetes mellitus is a metabolic disorder of the endocrine system. The disease occurs worldwide and its incidence is increasing rapidly in most parts of the world. People suffering from diabetes are not able to produce or properly use insulin in the body, so they have a high level of blood glucose (Kumar et al., 2008). Diabetes is becoming the third ‘killer’ of mankind, after cancer and cardiovascular diseases, because of its high prevalence, morbidity and mortality (Li et al., 2004). Approximately 4% of the population worldwide is affected and expected to increase by 5.4% in 2025 (Kim et al., 2006). These facts show that proposing an immediate strategy for diabetes prevention and treatment is a global subject. For a long time, diabetics have been treated with several medicinal plants or their extracts based on the folklore medicine (Akhtar and Ali, 1984). Synthetic hypoglycemic agents can produce serious side effects and they are too expensive. Therefore, the search for more effective and safer hypoglycemic agents has continued to be an important area of active research.
Ipomoea batatas leaf possess accelerating metabolism, preventing arteriosclerosis, protecting eyesight, hypoglycemic and antimutation activities (Han, 2000). Flavonoids is considered to be one of main active components of Ipomoea batatas leaf. (Harborne and Williams, 2000).The health benefits of flavonoids are well known and are displayed as a remarkable range of biochemical and pharmacological properties (Middleton et al., 2000). Accumulating evidence shows that flavonoids have antioxidant, hypolipidaemia, soften the blood vessel, hypoglycaemia properties (Hollman et al., 1999),and reduced risk for developing various cancers (Carroll et al., 1998; Sharma et al., 2008). But at present there is no study on the effect of flavonoids extracted from Ipomoea batatas leaf on diabetes mellitus. The purpose of this study was to investigate optimal extraction parameters of FIBL and Anti-diabetic activity of FIBL on alloxan-induced diabetic mice for the use of this plant in the treatment of diabetes.
Materials and methods
Plant material
Leaves of Ipomoea batatas were collected from Hebei province district in the month of October and the material was identified by Mr Wang GuangYao, a botanist of Jilin Agriculture Science and Technology College. A voucher specimen has been deposited in herbarium of Jilin Agriculture Science and Technology College. Fresh, intact, leaves were picked to shade dried as experimental material.
Drugs and reagents
Rutin standard was obtained from Chengdu mansite pharmaceutical Co. (Chengdu, China). Alloxan was obtained from Sigma Co. (USA). Glucose Analyzer and strips were purchased from Roche Diagnostic Co. (USA). Reagents for TC, TG and HDL-c were obtained from Beijing Chengxinde Biochemistry Reagent Co. (Beijing, China). All other reagents were of analytical grade.
Extraction of FIBL
The shade dried Ipomoea batatas leaf was crushed in an electrical grinder and then powdered. Out of this powder, 10g was subjected to hot continuous extraction in Erlenmeyer flask with ethanol (ethanol concentration ranged from 40 to 90 %, ratio of solvent to raw material ranged from 10 to 40), while the temperature of the water bath ranged from 30 to 90 ° and was kept steady (within ±1.0 °). After a period of time (ranged from 0.5 to 3 hrs), a deep brown extract was obtained which was filtrated by using the filter. The extract was evaporated by using a rotary evaporator (RE52AA, Yalong Biochemical Instrument Co., Shanghai, China) under reduced pressure at 40° to get the flavonoids. It was stored at (0–4) °C until used. The contents of flavonoids were determined by the NaNO2-Al(NO3)3-NaOH colorimetric assay and by reference to Rutin, and wavelenth in spectrophotometer (V-5100, Beijing Chenxiyongchuang Science and Technology Co., Beijing, China) was set at 510 nm (Xu, 2007; Wang et al., 2004).
Experimental animals
Male mice of original Kun-ming strain, weighing 18–22 g, were used for the study,. housed individually in polypropylene cages, maintained under standard conditions (12 h light and 12 h dark cycle, 25±30 °, 35–60 % humidity), the animals were fed with standard diet and water ad libitum. The approval of this experiment was obtained from the Institutional Animal Ethics Committee of Yanshan University (Qinhuangdao, China). After 1 week of acclimation, the fasted mice were induced with a single injection of 4 % alloxan prepared freshly at a dose of 200 mg/kg bw (Yang et al., 2006). Diabetes was confirmed by the determination of tail vein blood glucose levels on the third day after administration of alloxan. Mice having blood glucose levels greater than 11.1 mmol/L were considered diabetic and were used for the study (Yang et al., 2006; Dong et al., 2006)..
Anti-diabetic activity of FIBL
Sixty male Mice were randomly divided into six equal groups as follows:
Normal control group (NC): normal control mice administered water daily for 28 days;
Diabetic control group (DC): diabetic control mice administered water daily for 28 days;
Diabetic + FIBL (150 mg/kg) group (DHF): diabetic mice administered flavone extracted from Ipomoea batatas leaf (150mg/kg) daily for 28 days.;
Diabetic + FIBL (100 mg/kg) group (DMF): diabetic mice administered flavone extracted from Ipomoea batatas leaf (100 mg/kg) daily for 28 days.;
Diabetic + FIBL(50 mg/kg) group (DLF): diabetic mice administered flavone extracted from Ipomoea batatas leaf (50 mg/kg) daily for 28 days.;
Diabetic + glibenclamide (0.25 mg/kg) group (DG): diabetic mice administered reference drug glibenclamide (0.25 mg/kg) daily for 28 days.
During FIBL and glibenclamide supplement for 28 days, fasting blood glucose level was measured once every week. Blood was collected from tip of the tail vein and fasting blood glucose level was measured by using a glucose analyzer. At the same time, the body weight of each mouse was measured with a weighing balance (MP2000, Shanghai instrument No.1 factory, Shanghai, China). On 28th day of experiment, the mice were sacrificed by decapitation under light ether anesthesia and blood was collected from dorsal aorta and serum was separated by centrifugation for 5 min (VORTEX21K, Xiangyi centrifuge machines Co., Changsha, China). TC, TG and HDL-c were determined by enzyme assay methods. All results were expressed as mean ± SD and analyzed by SPSS for Windows (version 13.0, SPSS Inc, Chicago, USA). The Duncan test and one way analysis of variance were used for comparisons (Achyut et al., 2007). The values were considered significant when P < 0.05.
Acute toxicity studies
Healthy mice (18–22 g) of either sex, starved overnight were divided into three groups (n = 6) and were orally fed with FIBL in increasing dose levels of 300, 900, 1500 mg/kg bw. The animals were observed continuously for 2 hrs under the following profiles (Shirwaikar et al., 2006):
i) Behavioral profile. Alertness, restlessness, irritability, and fearfulness.; ii) Neurological profile. Spontaneous activity, reactivity, touch response, pain response and gait; iii) Autonomic profile. Defecation and urination. After a period of 24 and 72 hrs they were observed for any lethality or death.
Results and Discussion
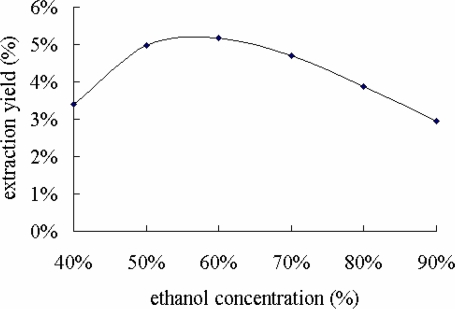
Different extraction conditions, such as ethanol concentration, ratio of solvent to raw material, extraction temperature and extraction time, have different effects on extraction yield of flavonoids (Zhang et al., 2007). Ethanol concentration is an important factor affecting extraction yield of flavonoids (Lan et al., 2007), which was set at 40 %, 50 %, 60 %, 70 %, 80 % and 90 %, respectively. With the increase of ethanol concentration from 40 % to 60 % in the extraction system, the extraction yield quickly increased from 3.41% to5.17% (Figure 1). However, with the increase of the ethanol concentration from 60% to 90% in the extraction system, extraction yield quickly decreased from 5.17 % to 2.94 %. This maybe because the extraction efficiency of water-soluble flavonoids and alcohol-soluble flavonoids is best when extracted with 60% ethanol. Therefore, the suitable ethanol concentration for higher yield of the FIBL was considered to be 60%
Figure 1.
Effect of ethanol concentration on extraction yield of FIBL
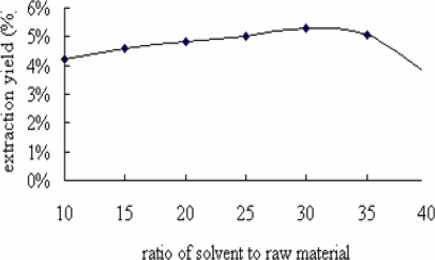
Ratio of solvent to raw material was another factor affecting extraction yield of flavonoids (Zhang et al., 2007). It was set at 10, 15, 20, 25, 30, 35 and 40, respectively. With the increase of ratio of solvent to raw material from 10 to 30 in the extraction system, extraction yield quickly increased from 4.21 % to5.31 %. It can be seen from Figure 2 that extraction yield of flavonoids in the extraction system gives higher value when ratio of solvent to raw material was 30. In addition, extraction yield of flavonoids decreased from 5.31 % to 3.69 % when ratio of solvent to raw material was from 30 to 40 in the extraction system. Therefore, the suitable ratio of solvent to raw material for higher total yield of the FIBL was considered to be 30.
Figure 2.
Effect of ratio of solvent to raw material on extraction yield of FIBL
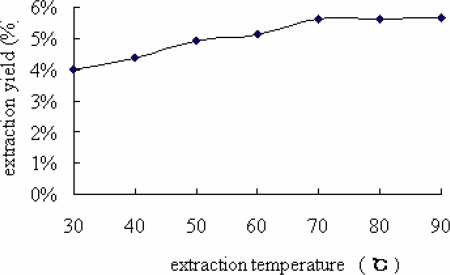
As for the extraction temperature, the higher the temperature, the higher the extraction yield of flavonoids. As shown in Figure 3, extraction yield increased from 3.98 % to 5.65 % with the increasing temperature. However, on the other hand, a relatively high extraction temperature (at 90 °) was detrimental to the extraction yield. Only a bit of the extraction yield was increased as the temperature was higher than 70 ° because of destruction of enzyme activity at high temperature in this reaction system (Zhao et al., 2007). Therefore, the suitable temperature for higher yield of the FIBL was considered to be70 °.
Figure 3.
Effect of extraction temperature on extraction yield of FIBL
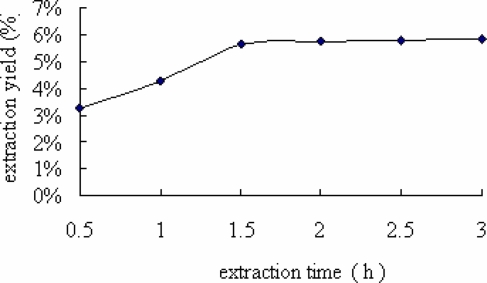
Extraction time is another factor that would influence the extraction efficiency and selectivity of the fluid (Zhu 2006). With the increase of the extraction time from 1 to 2 hrs in the extraction system, the extraction yield quickly increased from 3.27 % to 5.61 % (Figure 4). When extraction time continued to lengthen, the extraction yield increased a little. Because longer extraction time could delay and lengthen production cycle, 2 hrs of extraction time was adopted in the present work..
Figure 4.
Effect of extraction time on extraction yield of FIBL
Orthogonal test with four factors and three levels to analyze the optimal process parameters of extraction yield. And the L9 (3)4 table was designed to detect the most suitable extraction conditions of four factors (ethanol concentration, ratio of solvent to raw material, extraction temperature and extraction time) for extraction yield (Table 1). According to the value of range R in Table 2, ratio of solvent to raw material (factor B) exerted the most significant effect on extraction yield, and the order of importance that influenced extraction yield was found to be ratio of solvent to raw material (B) > ethanol concentration (A) > extraction temperature (C) > extraction time (D). The optimal combination parameters of the processing technology were A2B2C3D1, namely, ethanol concentration (60 %), ratio of solvent to raw material (30), extraction temperature (75 °) and extraction time (1.5 h), while extraction yield of FIBL was 5.94 %.
Table 1.
Factors and levels of orthogonal test
| No | Factor | |||
| A (ethanol concentration) (%) |
B (ratio of solvent to raw material) |
C (extraction temperature) (°) |
D (extraction time) (h) |
|
| 1 | 55 | 25 | 65 | 1.5 |
| 2 | 60 | 30 | 70 | 2 |
| 3 | 65 | 35 | 75 | 2.5 |
Table:2.
L9 (3)4 orthogonal test result
| No. | A (ethanol concentration) (%) |
B (Ratio of solvent to raw material) |
C (extraction temperature) (°) |
D Extraction time (h) |
extraction yield (%) |
| 1 | 1 | 1 | 1 | 1 | 5.08 |
| 2 | 1 | 2 | 2 | 2 | 5.39 |
| 3 | 1 | 3 | 3 | 3 | 5.24 |
| 4 | 2 | 1 | 2 | 3 | 5.21 |
| 5 | 2 | 2 | 3 | 1 | 5.94 |
| 6 | 2 | 3 | 1 | 2 | 5.27 |
| 7 | 3 | 1 | 3 | 2 | 5.06 |
| 8 | 3 | 2 | 1 | 3 | 5.24 |
| 9 | 3 | 3 | 2 | 1 | 5.01 |
| K1 | 5.237 | 5.117 | 5.197 | 5.343 | |
| K2 | 5.473 | 5.523 | 5.203 | 5.240 | |
| K3 | 5.103 | 5.173 | 5.413 | 5.230 | |
| R | 0.370 | 0.406 | 0.216 | 0.113 |
Acute toxicity studies revealed no obvious symptom of toxicity or any significant changes in general behaviour in mice exposed to FIBL. There was no lethality or any toxic reactions found at any of the doses selected until the end of the study period.
The alloxan-induced diabetic mice exhibited loss of body weight. Before embarking on the experiment, all the groups had no significant difference in body weight (P >0.05). A significant (P < 0.05) decrease in body weight was detected in diabetic control group as compared to the normal control group from 7 days after alloxan injection. However, the body weights in the DMF mice were significantly (P < 0.05) and dose-dependently increased as compared to those of the diabetic control from 14 days after administration. In the DG group, a significant (P < 0.05) increase in body weight as compared to the diabetic controls was also detected from 7 days after administration .The results are shown in Table 3.
Table 3.
Effect of FIBL on body weight (g) in mice
| Group | Animal number |
Days after dosing | ||||
| 0d | 7d | 14d | 21d | 28d | ||
| NC | 10 | 19.01±0.66 | 23.33±0.58 | 25.50±0.49 | 27.66±0.39 | 30.21±0.59 |
| DC | 10 | 19.04±1.03 | 20.53±1.18* | 22.14±1.08* | 23.11±0.91* | 23.74±0.83* |
| DHF | 10 | 19.37±0.74 | 21.30±1.26* | 23.17±1.25* | 24.95±1.23*# | 25.82±1.14*# |
| DMF | 10 | 19.10±1.07 | 21.42±1.75* | 23.87±1.34*# | 25.81±1.79*# | 27.37±1.55*# |
| DLF | 10 | 19.04±1.04 | 20.86±1.55* | 22.57±1.66*# | 24.02±1.49* | 25.21±1.34*# |
| DG | 10 | 19.10±0.99 | 21.77±1.38*# | 25.33±0.69# | 27.32±0.83# | 29.30±1.22# |
n=10; (mean±S.D., g);
P < 0.05 as compared with normal control group.
P < 0.05 as compared with diabetic control Group
Diabetes mellitus is a serious chronic disease, and effective control of the blood glucose level is a key step in preventing or reversing diabetic complications and improving the quality of life in both type 1 and type 2 diabetic patients (Abraira et al., 1995; DeFronzo, 1999). In the diabetic control group, a significant (P<0.05) increase in blood glucose levels was detected as compared to the normal control group, but these abnormal increases in blood glucose levels significantly (P<0.05) and dose-dependently decreased in the FIBL -administered groups as compared to the diabetic control group at 7 days after administration. In the DG group, a significant (P<0.05) decrease in blood glucose levels as compared to the diabetic control group was also detected from 7 days after administration. The dosage of 100mg/kg is more effective than that of 50 mg/kg.and 150 mg/kg. The results are shown in Table 4.
Table 4.
Effect of FIBL on blood glucose level (mmol/L )in mice
| Groups | Animal number |
Days after dosing | |||
| 0 d | 7 d | 14 d | 28 d | ||
| NC | 10 | 5.92±1.79 | 6.23±1.75* | 5.91±1.57* | 6.43±1.72* |
| DC | 10 | 22.19±3.45* | 22.51±2.11* | 22.60±3.39* | 22.41±2.71* |
| DHF | 10 | 22.15±3.45* | 19.27±2.22*# | 16.75±1.95*# | 14.56±2.37*# |
| DMF | 10 | 22.70±3.40* | 17.20±2.34*# | 13.83±2.78*# | 9.72±2.22*# |
| DLF | 10 | 22.29±3.37* | 19.34±2.66*# | 16.99±2.45*# | 14.34±2.53*# |
| DG | 10 | 22.72±3.70* | 11.52±1.71*# | 9.91±2.15*# | 7.08±1.08* |
n=10; (mean±S.D., g);
P < 0.05 as compared with normal control group.;
P < 0.05 as compared with diabetic control Group
Diabetes is also associated with hyperlipidemia (Maiti et al., 2005). The present results showed that the TC and TG levels were significantly elevated in the diabetic control group as compared to the normal control group (P<0.05), and serum HDL-c level, a friendly lipoprotein, was decreased in diabetic control group as compared to the normal control group (P<0.05). After supplementation with the FIBL and glibenclamide, the alteration in lipid metabolism was partially attenuated as evidenced by decreased serum TG and TC levels and by increased HDL-c concentration in diabetic mice. The response was better in the DMF group compared with the DLF group and the DHF group which is comparable to that of the DG group. The results are shown in Table 5.
Table 5.
Effect of FIBL on blood lipids (mmol/L ) in mice
| Groups | Animal number | TC | TG | HDL-c |
| NC | 10 | 2.61±0.17 | 1.64±0.25 | 1.65±0.16 |
| DC | 10 | 3.43±0.56* | 3.33±0.16* | 0.76±0.21* |
| DHF | 10 | 3.15±0.16*# | 2.45±0.53*# | 0.97±0.13*# |
| DMF | 10 | 2.84±0.21# | 1.77±0.31# | 1.21±0.15*# |
| DLF | 10 | 3.21±0.12* | 2.78±0.11*# | 0.82±0.12* |
| DG | 10 | 2.75±0.57# | 1.79±0.22# | 1.44±0.28*# |
n=10; (mean±S.D., g);
P<0.05 as compared with normal control group.;
P < 0.05 as compared with diabetic control Group
Our research has indicated that FIBL possesses antidiabetic activities and the dose of 100 mg/kg body weight represents the optimal level for effecting a positive diabetic response in mice. Therefore, FIBL should be considered as a candidate for future studies on diabetes. Further studies are in progress to elucidate the molecular and cellular mechanism of FIBL.
Acknowledgements
This work was supported by the 2006 Qinhuangdao Scientific Research Grant (Project No. D08)
References
- 1.Abraira C, Colwell JA, Nuttall FQ, Sawin CT, Nagel NJ, Comstock JP. Veterans Affairs Cooperative Study on glycemic control and complications in type II diabetes (VA CSDM). Results of the feasibility trial. Veterans Affairs Cooperative Study in Type II Diabetes. Diabetes Care. 1995;18:1113–1123. doi: 10.2337/diacare.18.8.1113. [DOI] [PubMed] [Google Scholar]
- 2.Achyut NK, Shweta K, Santosh KS, Rajesh KG, Geeta W. Studies on the glycemic and lipidemic effect of Murraya koenigii in experimenta animals. J Ethnopharmacol. 2007;112:3.5–311. doi: 10.1016/j.jep.2007.03.023. [DOI] [PubMed] [Google Scholar]
- 3.Akhtar FM, Ali MR. Study of the anti diabetic effect of a compound medicinal plant prescription in normal and diabetic rabbit. Journal Pakistan Medical Association. 1984;34:239–244. [PubMed] [Google Scholar]
- 4.Carroll KK, Guthrie N, So FV, Chambers AF. Anticancer properties of flavonoids with emphasis on Citrus flavonoids. In: Rice-Evans CA, Parker L, editors. Flavonoids in Health and Disease. NY: Marcel Dekker Inc.; 1998. ISBN 0-824700961. [Google Scholar]
- 5.DeFronzo RA. Pharmacologic therapy for type 2 diabetes mellitus. Annals Internal Med. 1999;131:281–303. doi: 10.7326/0003-4819-131-4-199908170-00008. [DOI] [PubMed] [Google Scholar]
- 6.Dong HQ, Ning ZX, Yu LL. Anti-hyperglycemia and effects of flavonoid phloridzin from lithocarpus polystachyus rehd on diabetic model mice. Food Sci. 2006;12:715–718. [Google Scholar]
- 7.Han ZM. Good Vegetable and Medicine–Ipomoea batatas leaf. Agriculture of Hunan Province. 2000;6:27. [Google Scholar]
- 8.Harborne JB, Williams CA. Good Advances in flavonoid research since. Phytochemistry. 2000;55:481–504. doi: 10.1016/s0031-9422(00)00235-1. [DOI] [PubMed] [Google Scholar]
- 9.Kim SH, Hyun SH, Choung SY. Anti-diabetic effect of cinnamon extract on blood glucose in db/db mice. J f Ethnopharmacol. 2006;104:119–123. doi: 10.1016/j.jep.2005.08.059. [DOI] [PubMed] [Google Scholar]
- 10.Kumar A, Ilavarasan R, Jayachandran T, Deecaraman M, Aravindan P, Padmanabhan1 N, Krishan M R V. Anti-diabetic activity of Syzygium cumini and its isolated compound against streptozotocin-induced diabetic rats. J Medicinal Plants Res. 2008;9:246–249. [Google Scholar]
- 11.Lan D, Wen L, Wang XP. Study on the Extracting Condition of the Total Flavonoid from Ipomoea batatas Lam leaves. Studies of Trace Elements and health. 2007;1:47–48. [Google Scholar]
- 12.Li WL, Zheng HC, Bukuru J, De Kimpe N. Natural medicines used in the traditional Chinese medical system for therapy of diabetes mellitus. J Ethnopharmacol. 2004;92:1–21. doi: 10.1016/j.jep.2003.12.031. [DOI] [PubMed] [Google Scholar]
- 13.Maiti R, Das UK, Ghosh D. Attenuation of Hyperglycemia and Hyperlipidemia in Streptozotocin-Induced Diabetic Rats by Aqueous Extract of Seed of Tamarindus indica. Biol Pharmaceut Bull. 2005;28:1172–1176. doi: 10.1248/bpb.28.1172. [DOI] [PubMed] [Google Scholar]
- 14.Middleton E, Kandaswami C, Theoharides TC. The effects of plant flavonoids on mammalian cells: implications for inflammation, heart disease and cancer. Pharmacol Reviews. 2000;52:673–751. [PubMed] [Google Scholar]
- 15.Sharma B, Viswanath G, Salunke R, Roy P. Effects of flavonoid-rich extract from seeds of Eugenia jambolana (L.) on carbohydrate and lipid metabolism in diabetic mice. Food Chem. 2008;110:697–705. [Google Scholar]
- 16.Sharma SB, Nasir A, Prabhu KM, Murthy PS, Dev G. Hypoglycaemic and hypolipidemic effect of ethanolic extract of seeds of Eugenia jambolana in alloxan-induced diabetic rabbits. J Ethnopharmacol. 2003;85:201–206. doi: 10.1016/s0378-8741(02)00366-5. [DOI] [PubMed] [Google Scholar]
- 17.Shirwaikar A, Rajendran K, Barik R. Effect of aqueous bark extract of Garuga pinnata Roxb in streptozotocin-nicotinamide induced type-II diabetes mellitus. J Ethnopharmacol. 2006;107:285–290. doi: 10.1016/j.jep.2006.03.012. [DOI] [PubMed] [Google Scholar]
- 18.Wang QA, Zhou B, Shan Y. Progress on antioxidant activation and extracting technology of flavonoids. Chemical Production and Technology. 2004;11:29–33. [Google Scholar]
- 19.Xu G. Studies on the extracting and antioxidant activities of flavonoids in sweet potatoes. J Food Sci Biotechnol. 2007;26:22–27. [Google Scholar]
- 20.Yang RJ, Li QW, Zhao R. Comparison between the effects of alloxan and streptozotoci on inducing diabetes in mice. Journal of Northwest Sci-Tech University of Agriculture and Forestry. 2006;90:17–21. [Google Scholar]
- 21.Zhang YN, Li M, Guo WL, Yang QS, Feng ZS. Study on extracting procedure of total flavonoids from Sea-buckthorn. Academic Periodical of Farm Products Processing. 2007;100:8–11. [Google Scholar]
- 22.Zhao WH, Zhao X, Bai WD, Wang DW. Extraction of flavonoids from persimmon leaves. Journal of Shaanxi University of Science & Technology(Natural Science Edition) 2007;5:54–57. [Google Scholar]
- 23.Zhu PH. Process for the Extraction of Flavones from Ginkgo Leaves. Chemical Production and Technology. 2006;12:25–27. [Google Scholar]


