

Abstract
The Ptdlns-3-kinase (PI3-K) signaling pathway plays a vital role in cell survival, proliferation, apoptosis and differentiation in normal cells, as well as in diseases such as cancer and diabetes. Quantification of phospho-Akt is a standard way of assessing the activity of the PI3-K signaling pathway in both cells and tumors. This measurement is traditionally performed semiquantitatively using immunoassays such as Western blot. Here we report an LC-MS method to accurately measure the stoichiometry of Akt phosphorylation in biological samples. The procedure includes immunoprecipitation, gel electrophoresis, in-gel digestion, addition of isotopicaly labeled internal standards and LC-MS/MS. Two proteolytic enzymes, chymotrypsin and trypsin, were used to generate suitable peptide fragments for measuring Thr308 and Ser473 phosphorylation, respectively. The interday imprecision was estimated to be 3.8% and 2.3% for Thr308 and Ser473, respectively. This method has been tested on human T-cells grown in presence and absence of pervanadate and with or without a PI3-K inhibitor and on human glioblastoma cells (U-87 MG) grown in presence and absence of wortmannin (PI3-K inhibitor).The results of T cells suggest that the levels of Akt phosphorylation in untreated cells were below 1% for both phosphorylation sites. Pervanadate treatment provoked an 18-fold increase in phosphorylation of Thr308 and the PI3-K inhibitor partially reversed the increase. A comparison between LC-MS/MS and Western blotting suggests that the LC-MS based method is of comparable sensitivity and provides a more accurate phosphorylation stoichiometry, a wider dynamic range and more in-depth information. The application of the new method and its utility to providing predictive markers of response to targeted therapies is discussed.
Keywords: Akt, PKB, phosphorylation, stoichiometry, LC-MS/MS, T cells, U-87 MG cells
Short abstract
The Ptdlns-3-kinase signaling pathway plays a vital role in normal physiology and pathophysiology. An LC-MS method using stable isotope peptides to accurately measure the stoichiometry of Akt phosphorylation, a biomarker of Ptdlns-3-kinase activation, in biological samples was developed. A comparison between LC-MS/MS and Western blotting suggests that the LC-MS based method is of comparable sensitivity and provides a more accurate phosphorylation stoichiometry, a wider dynamic range and more in-depth information.
Introduction
The phosphatidylinositol-3-kinase (PI3-K) pathway, one of the signaling pathways downstream of receptor tyrosine kinases, controls a wide range of biological processes including survival, cell proliferation,1,2 metabolism3,4 and cell mobility.(3) Activation of PI3-K pathway involves growth factor binding to a receptor tyrosine kinase and activation of PI3-K, which phosphorylates membrane-bound phosphatidylinositol biphosphate, (PIP2) to generate phosphatidylinositol trisphosphate (PIP3). It is believed that, upon binding of PIP3 to the pleckstrin homology (PH) domain, the phosphoinositide dependent protein kinases PDK-1 is recruited to the plasma membrane and become activated although the degree of recruitment remains controversial.(5) PDK1 was discovered a decade ago(6) and is known to transduce signals by phosphorylating and activating a number of downstream protein kinases such as Akt/PKB, SGK, PKCzeta, PKCdelta, p70 S6 kinase, p90 ribosomal S6 kinase (p90 Rsk) and p21-activated kinase (see ref (7) for review). The identity of PDK2 has been controversial with various kinases proposed to act as the PDK-2 for Akt, such as ILK and PKC. However, recent biochemical studies have strongly suggested that PDK-2 is the mTOR/Rictor complex.(8) The activity of the PI3-K pathway is negatively regulated by the lipid phosphatases PTEN and SHIP.9,10
Akt/PKB is a critical component in the PI3-K pathway residing directly downstream of both PDK-1 and -2.(5) There are three Akt protein kinase isoforms (Akt 1, 2, 3) showing a high degree of sequence homology, but differences in location of expression in mammals.11,12 Akt1 is the predominant isoform in most tissues, Akt2 is highly expressed in the insulin-responsive tissues, and Akt3 is abundant in brain.(13) Each Akt isoform has three functionally distinct domains: an N-terminal PH domain providing a lipid-binding module to PIP3, a central catalytic domain, and a C-terminal hydrophobic domain. Activation of Akt is regulated through two distinct phosphorylation events at Thr308 and Ser473 in Akt1, 309 in Akt2 and 305 in Akt3. Phosphorylation of Thr308, which precedes Ser473, is mediated by PDK-1 and is sufficient to activate Akt. However, phosphorylation at both sites is required for maximal activation of this phosphoprotein. Phosphorylation of Thr308 by PDK-1 is believed to render the Ser473 site accessible to PDK-2.(14) These two phosphorylation events are often used as indicators for PI3-K pathway activation.
The PI3-K pathway is also found to be deregulated in many diseases such as cancer and diabetes. For example, overactivated PI3-K is found in 32% of colon, 27% of glioblastoma, 25% of gastric and 8% of breast cancers.(15) The overactivation of such a pathway could be caused by mutations, amplification/overexpression of key components in the pathway or through inactivation of tumor suppressor protein PTEN.16,17 In diabetes, the compromised insulin signaling pathway which includes PI3-K/mTOR pathway has been implicated in causing insulin resistance in tissues and β cell dysfunction in pancreas.18,19 Because of its importance in physiological and pathological conditions, measurement of PI3-K activation has became an essential task for scientists in cell biology and biomedical research.
Conventionally, detection of PI3-K pathway activation is performed by measuring phosphorylation at Thr308 and Ser473 on Akt using immunoassays such as Western blot, or less frequently by a kinase activity assay (either PI3-K itself or its downstream kinase such as Akt). The latter provides most direct activity measurements but requires fresh samples making it less applicable to clinical samples. The former estimates Akt phosphorylation by the ratio of signals from two immunoassays: one using phospho-specific antibody and the other total Akt antibody. Despite being very sensitive, this method provides only arbitrary ratios and a reference control sample to which the comparison of the levels of phosphorylation in experimental samples is required. Without absolute stoichiometry readings, critical information is missed. In the case of PTEN mutation, although it is known that PTEN knockout causes tumorigenesis via activation of Akt (for review, see ref (20)), the quantity of Akt and the stoichiometries of phosphorylation at Thr308 and Ser478 that are required to trigger such an event are unknown. Quantitative information about the total amount of Akt and its phosphorylation stoichiometry could be used not only to understand the biological roles of Akt, but also to assess the effectiveness and/or appropriate dosing of PI3-K inhibitors in cancer patients. The other advantage of absolute quantification of phosphorylation stoichiometry is that data from different studies can be directly compared, and thus, population studies with large sample sizes can be conducted.
A relatively new strategy of quantifying phosphorylation using LC-MS has been proposed by Gygi and his colleagues.(21) The procedure consists of immunoprecipitation, SDS-PAGE, protease digestion, internal standard spike-in, and LC-MS/MS. This method utilizes a synthetic peptide with incorporated stable isotopes as ideal internal standards to mimic native peptides formed by proteolysis. The internal standard peptide is then used to quantitatively measure the absolute levels of proteins and post-translationally modified proteins after proteolysis by using triple quadrupole tandem mass spectrometer in multiple reaction monitoring (MRM) mode. This approach has been used to monitor phosphorylation events in human separase protein,(21) focal adhesion kinase,22,23 cyclin-dependent kinases,(24) ERK and S6 kinase.(25) In this study, we adapted the same approach to measure and monitor the phosphorylation stoichiometry of Akt in both T and U-87 MG cells grown in various conditions. The assay performance was assessed extensively.
Experimental Procedures
Cell Culture, Immunoprecipitation of Akt, and SDS-PAGE
Human CD8 activated T-cells were isolated and purified from the peripheral blood mononuclear leucocytes.(26) Isolated T-cells were activated with 2 μg/mL phytohemagglutinin and cultured in RPMI medium for 3 days. The cells were then washed and subcultured in RPMI supplemented with 10% fetal calf serum (FCS) in presence of IL2 (20 ng/mL) every 3 days until reaching confluency (2 × 10⁶ cell/mL). Prior to treatments, cells were washed with PBS, resuspended in fresh RPMI at 108 cell/mL and then divided equally into four separate treatment groups consisting of the control, PI3-K inhibitor alone (treatment with 10 μM of PI3-K inhibitor LY294002 for 35 min), PI3-K inhibitor LY294002 and pervanadate (100 μM), and pervanadate (100 μM) alone. Incubation in presence of pervanadate was carried out for 12 min.
T-cells were subsequently harvested by centrifugation (108 cells, for each phosphorylation site), washed twice with PBS and then lysed in 2 mL of lysis buffer (50 mM Tris-HCl, pH 7.4, 2 mM EDTA, 1% NP40, 5 mM sodium pyrophosphate decahydrate (Sigma), 5 mM β-glycerol 2-phosphate disodium salt hydrate (Sigma), 5 mM sodium pervanadate, protease inhibitor cocktail (Roche), and phosphatase inhibitor cocktail (Calbiochem)). Lysed cells were left on ice for 10 min with regular vortexing for 10 s every 2 min. Insoluble material was removed by centrifugation 10 min at 13 000g. The cell lysate was centrifuged again for 2 min to remove residual insoluble material. Seven micrograms of rabbit polyclonal anti-Akt1 antibody (Millipore) bound to protein G agarose beads (60 μL of 50% slurry) was added to the clear lysate. The mixture was left at 4 °C for 2 h on a shaking platform and beads were subsequently washed 5 times in 500 μL of wash buffer (lysis buffer supplemented with 200 mM NaCl) to remove nonspecifically bound proteins. Ten microliters of 4× loading buffer (Invitrogen) and 5 μL of 50 mM DTT were then added to the beads followed by incubation at 70 °C to reduce cysteine residues. Alkylation was performed by adding 5 μL of 300 mM iodoacetamide (Sigma) and incubation at room temperature in the dark for 30 min. Proteins were separated on a NuPAGE bis-tris 4−12% gradient gel (Invitrogen) at 200 V for 45 min and gels were washed for 5 min in Milli-Q water before staining with 20 mL of Simply Blue (Invitrogen) to visualize proteins. The gel was subsequently washed with Milli-Q water four times over 10 h.
For the U-87 MG (American Type Culture Collection) experiments, cells were grown in DMEM medium supplemented with 10% FCS in a humidified atmosphere of 95% air and 5% CO2 at 37 °C. The medium was changed every second day and cells were subcultured every 3 to 4 days when they reached 80−90% confluency. U-87 MG cells were grown in the presence or absence of 7 nM wortmannin for 2 h to evaluate the effect of the PI-3K inhibitor on Akt phosphorylation. About 3 × 10⁷ cells in each group were used to measure each phosphorylation site. Cell lysis, immunoprecipitation and SDS-PAGE were performed as described above for T cells.
Excission of the AKT Band and In-Gel Digestion
The procedure followed was previously described(27) with some modifications. The Akt protein band was cut with a clean scalpel blade, transferred to a microcentrifuge tube and cut into small pieces. Gel pieces are washed for 15 min sequentially with 200 μL of Milli-Q water, 200 μL of acetonitrile, 200 μL of 100 mM ammonium bicarbonate, 200 μL 20 mM ammonium bicarbonate and 50% acetonitrile and finally 100 μL of acetonitrile. The gel pieces were then air-dried in a laminar flow.
In-gel digestion was carried out with trypsin (measurement of phosphorylation at Ser473 site) or chymotrypsin (measurement of phosphorylation at Thr308) at a final concentration of 12 μg/mL (in 30 mM ammonium bicarbonate). Heavy peptides (Cambridge Research Bioscience, Cambridge, U.K.) corresponding to the phospopeptide and nonphosphopeptide of both sites were spiked-in at a final amount of 37 fmol. After overnight incubation (∼16 h) on a shaker at 37 °C, an equal volume of acetonitrile (i.e., 30 μL) was added and the peptide mixtures were extracted by shaking (1000 rpm) at room temperature for 10 min. The resulting supernatant was transferred to a fresh microcentrifuge tube. Peptides in the gel pieces were further extracted first by adding 50 μL of 5% formic acid and shaking for 20 min then 50 μL of 100% acetonitrile for another 20 min. The supernatant was then collected and transferred to the first fraction. The gel pieces were finally washed with 50 μL of acetonitrile for 10 min and the three pooled fractions were dried in Speed-Vac and stored at −70 °C until further processing.
Alkylation of Thr308 and Phospho-Thr308 Peptides
The peptides used for quantification of the phosphorylation site Thr308 contain a cysteine residue which required reduction and alkylation. This was achieved by adding 10 μL of 10 mM DTT to 10 μL of light or heavy peptides (both phospho- or nonphosphopetides, 1 nM) and incubation at room temperature for 45 min with regular sonication every 15 min. A total of 2.5 μL of ammonium bicarbonate (1.0 M) was then added to the sample prior to the incubation at 60 °C for 1 h. After cooling to room temperature, 4.5 μL of iodoacetamide (300 mM) was added to the samples and the mixture was incubated at room temperature in the dark on an orbital shaker for 1 h. Three microliters DTT (100 mM) was added to the samples followed by the addition of 20 μL of 5% formic acid and 140 μL of Milli-Q water.
LC/MS Conditions
Quantification of Akt peptides (and phospho-peptides) was performed by LC-MS on a Q-TRAP 4000 (ABI-MDS-Sciex) mass spectrometer coupled with a Dionex 3000 nano-LC system. LC buffers were the following: buffer A (2% acetonitrile and 0.1% formic acid in Milli-Q water (v/v)) and buffer B (90% acetonitrile and 0.08% formic acid in Milli-Q water (v/v). Peptide mixtures were reconstituted in 54 μL of 0.5% formic acid and then pipetted into microvials containing 1 μL of 25 mM EDTA. Aliquots of 16 μL of each sample were loaded at 20 μL/min onto a trap column (300 μm × 5 mm, PepMap C18 column, 5 μm, 100 Å, LC packing) equilibrated in 99% buffer A. The trap column was washed for 4 min at the same flow rate and then the trap column was switched in-line with an LC-Packings, resolving C18 column (300 μm × 15 mm, PepMap C18 column, 3 μm, 100 Å, LC-Packings). The peptides were eluted from the column at a constant flow rate of 300 nL/min with a linear gradient from 99% buffer A to 45% buffer B in 20 min, then to 90% buffer B by 22 min. The column was then washed with 90% buffer B for 10 min and re-equilibrated in 99% buffer A. The HPLC was interfaced to the mass spectrometer with an FS360−20−10 picotip (New Objectives) fitted to a NanoSpray II Source and interface kit (Applied Biosystems). The Q-trap 4000 was operated in the positive mode using MRM mode with analyte and source dependent parameters that were optimized for each peptide and MRM transition (Table 1).
Table 1. Sequences, Molecular Weight (MW), Retention Times, Charge States, and Transitions of 8 Peptides Used for the Quantification of Akt Phosphorylation at Thr308 and Ser473.
| peptide | sequence | MW | retention time (min) | charge state | transition | collision energy |
|---|---|---|---|---|---|---|
| Phospho-Thr308 | GLCKEGIKDGATMK[pT]F | 1835.8 | 14.7 | [M + 3H]3+ | 612.6 → 745.4 | 27 |
| Phospho-Thr308 (IS) | GLCKEGIKDGATM[KC13N15][pT]F | 1843.8 | 14.7 | [M + 3H]3+ | 615.2 → 749.4 | 28 |
| Nonphospho-Thr308 | GLCKEGIKDGATMKTF | 1755.8 | 14.1 | [M + 3H]3+ | 585.9 → 745.4 | 27 |
| Nonphospho-Thr308 (IS) | GLCKEGIKDGATMK[C13N15]TF | 1763.8 | 14.1 | [M + 3H]3+ | 588.6 → 749.4 | 27 |
| Phospho-Ser473 | RPHFPQFSY[pS]ASGTA | 1732.7 | 17.3 | [M + 2H]2+ | 866.8 → 254.2 | 47 |
| Phospho-Ser473 (IS) | RPHFPQ[FC13N15]SY[pS]ASGTA | 1742.7 | 17.3 | [M + 2H]2+ | 871.8 → 254.2 | 47 |
| Nonphospho-Ser473 | RPHFPQFSYSASGTA | 1652.7 | 16.0 | [M + 2H]2+ | 826.8 → 254.2 | 46 |
| Nonphospho-Ser473 (IS) | RPHFPQ[FC13N15]SYSASGTA | 1662.7 | 16.0 | [M + 2H]2+ | 831.8 → 254.2 | 46 |
Western Blotting
The same amount of proteins (e.g., 20 μg) from each group of cultured cells and 12.2 ng of recombinant Akt (Millipore) as control were subjected to gel-electrophoresis (NuPAGE Bis-Tris 4−12% gradient gel). After electrophoresis, proteins were transferred onto PVDF membrane (Invitrogen) at 25 mA for 2 h at room temperature using X Cell Sure Lock and Blot module (Invitrogen). After blocking overnight in Buffer C (PBS containing 4% BSA and 0.5% Tween 20) at 4 °C, membranes were incubated with primary antibody (anti-phospho-Akt, Thr308 (Cell Signaling) diluted 1/500, anti-phospho-Akt Ser473 (Cell Signaling) diluted 1/1000 or total anti-Akt antibody (Millipore) diluted 1/1000 in Buffer C for 4 h at room temperature. Loading was confirmed using anti-Actin antibody (Santa Cruz) diluted 1/1000 in buffer C. Membranes were washed three times for 5 min in Buffer C and then incubated for 1 h at room temperature with secondary antibody (stabilized goat anti-rabbit or anti-mouse conjugated to horseradish peroxidase (HRP), Pierce) diluted 1/600 in buffer C. Visualization was by enhanced chemiluminescence (GE Biosciences).
Data Analysis
Data analysis was performed using Microsoft Excel (Version 2003, Microsoft) or Analyst software (Version 1.4, Applied Biosystems). Peak areas for the phospho- and nonphospho peptides from both phosphorylation sites were calculated for the dominant MRM transition of each peptide. The equation used for quantitation of peptide of interest is the following. Quantity of peptide of interest = (peak area of transition representing peptide of interest)/(peak area of transition representing the Internal standard (IS)) × the quantity of IS. Percentage of phosphorylation was calculated as (phospho peptide)/(phospho peptide + nonphospho peptide) × 100.
Results
Workflow of LC-MS Based Quantification
The procedure of MRM-based quantitative analysis is shown in Figure 1A and is primarily based on the workflow published by Gygi and colleagues.(21) In brief, after cells or tissues lysis, Akt was immunoprecipitated from the lysate and the precipitated proteins were then reduced and alkylated (to eliminate disulfide bridges and hence cross-linked peptides) before SDS-PAGE protein separation. The Akt band was excised, washed and mixed with heavy isotope internal standards corresponding to the peptides and phosphopeptides of interest. Enzymatic digestion was then carried out prior to LC-MS/MS using the MRM mode. Before the levels of phosphorylated and nonphosphorylated peptides can be measured in samples, several assay development steps including selection of protein digestion method and immunoprecipitation were optimized. The former is particularly important as it also determines the characteristics (i.e., length and amino acid composition) of the resultant peptides to be analyzed and quantified.
Figure 1.

Assay procedure of LC-MS-based quantification of Akt phosphorylation stoichiometry at Thr308 and Thr473. (A) The procedure for LC-MS based phosphorylation measurement contains six steps including lysis of cell/tissue, immunoprecipitation, reduction/alkylation, proteolytic digestion, and LC-MS/MS. (B) Representative MRM extracted ion chromatogram for Thr308, phospho-Thr308, Ser473 and phospho-Ser473 peptides. Phosphopeptides are shown in red.
In silico digestion of the Akt amino acid sequence with various proteolytic enzymes suggested that Asp-N might generate suitable peptide fragments for measuring both the Thr308 and Ser473 phosphorylation sites. However, subsequent trials using recombinant Akt, Asp-N and LC-MS/MS analysis showed that only the peptide containing Ser473, and not that containing Thr308, was detected (data not shown). As an alternative, trypsin and chymotrysin were chosen to digest Akt into peptide fragments for monitoring phosphorylation at the Ser473 and Thr308 sites, respectively. Both phospho- and nonphospho-peptides (phospho-Thr308 and Thr308; phospho-Ser473 and Ser473) generated, respectively, by chymotrypsin and trypsin digestion of recombinant Akt, can be detected (Figure 1B).
Characterization of AQUA Peptides Using LC-MS/MS
To quantify the levels of Thr308, phospho-Thr308, Ser473 and phospho-Ser473 peptides, a total of eight peptides (isotopic heavy and light peptide for each site) were synthesized. These peptides were also used to optimize conditions for both LC separation and MS detection. The retention time, MRM transition, and major settings in LC-MS are summarized in Table 1. Phosphopeptides are retained longer on the column than their unmodified counterparts (Figure 1B). The standard curve of phospho-Ser473 peptide showed linearity in the range of 0.05−500 fmol (Figure 2A). The lower limits of detection for the eight peptides were around 40−120 amol, as defined by signal-to-noise ratios >5 (Figure 2B). The lower limits of quantification were between 90−250 amol, as determined by intra- and interassay imprecision and inaccuracy <25% (Figure 2B).
Figure 2.

Analytical performance of LC-MS based quantification of Akt phosphorylation stoichiometry at Thr308 and Thr473. (A) An example of calibration curves for phospho-Ser473 peptide indicates a good linearity over a range between 50 amol and 500 fmol. The detection limit (defined as signal-to-noise ratio = 5) is 50 amol for this peptide (bottom left). (B) Summary of analytical performance of the four peptides measured. Limit of quantification (LOQ) is defined as ≤25% CV and bias for all intraday and interday precision and accuracy.
Selection of Suitable Immunoprecipitation Antibody
An immunoprecipitation step is normally required to detect low-abundance proteins such as Akt. The immunoprecipitation enriches protein-of-interest and improves the sensitivity of LC-MS/MS methods. Three antibodies (7 μg) recognizing three different parts (a.a. 1−149, mouse monoclonal anti Akt-1, (Millipore), a.a. 140−480, mouse monoclonal anti-Akt1, (Cell Signaling) and a.a. 466−480, rabbit polyclonal anti-Akt1, (Millipore)) of Akt1 were tested for their ability to immunoprecipitate 0.2 μg of the active form of recombinant Akt1. The results suggest that the antibodies recognizing a.a. 140−480 and a.a. 466−480 gave the best recovery (∼80%) (Supplementary Figure S1). The antibody preparation recognizing a.a. 140−480 contained an interfering protein that migrated close to the recombinant Akt1 band on SDS-PAGE and therefore was not considered for further use. The efficiency of immunoprecipitation using this antibody was also tested on T cells cultured in the presence or absence of pervanadate in order to examine the ability of pool-down for both phosphorylated and unphosphorylated forms of Akt. The results showed that this antibody pooled down quantitatively both phosphorylated and unphoshorylated (or low phosphorylated) forms of Akt1 (Supplementary Figure S2). Thus, the antibody recognizing the C-terminal region of Akt1 (a.a. 466−480) was used for immunoprecipitation of Akt1 from biological samples throughout the study.
Effects of Methionine Oxidation and the Cysteine Alkylation Step on Thr308 Phosphorylation Measurements
The Thr308 and phospho-Thr308 peptides contain a methionine residue at position 306 prone to oxidation by free radicals, and a cysteine residue requiring alkylation to prevent cross-linking (Table 1). These processes could potentially cause discrepancies in the measurement of these peptides. LC-MS/MS analysis of chymotrypsin digested recombinant Akt after SDS-PAGE indicates that both unoxidized and oxidized forms were observed for the phospho-Thr308 peptide and the Thr308 peptides using a data dependent MS/MS acquisition method and also using MRM mode taking into account the extra 16 Da mass shift resulting from methionine oxidation. Both peptides elute 2 to 3 min earlier than their native counterparts in accordance with their polar character (Figure 3A). Methionine oxidation of both Thr308 and phospho-Thr308 was also confirmed by Mascot database search (Figure 3B).
Figure 3.

Oxidation of the methionine residues of the phospho-Thr308 and Thr308 peptides during sample processing. Recombinant Akt (0.2 μg) was processed through the assay procedures as described in Figure 1 and the resulting peptide mixture was subjected to LC-MS/MS using an extra transition that takes into account the 16 Da of methionine oxidation. (A) The potential oxidized form (+8, doubly charged ion) of the Thr308 peptide can be observed (upper panel, blue trace). The oxidized peptide was eluted 2 to 3 min earlier than its native counterpart in accordance with its polar character. (B) Mascot database search indicates that the oxidized forms of both Thr308 and phospho-Thr308 can be observed.
To examine the influence of potential oxidation of methionine and the alkylation step on the measurement of Akt phosphoryaltion at Thr308, the assay was performed 5 times (3 replicates each time) on different days using recombinant Akt protein (0.2 μg) and the interday imprecision was estimated. We found that the imprecisions for the absolute quantification of unoxidized Thr308 peptide and phospho-Thr308 peptide were 28% and 32%, respectively, which are significantly higher than those of Ser473 and phospho-Ser473 (14.2% and 14.0%, respectively, Table 2). These results imply that oxidation of methionine and the alkylation step increase imprecision for measuring the absolute quantities of the Thr308 and phosphoThr308 peptides. Nevertheless, the ratio of phospho-Thr308 to Thr308 was reliable, as indicated by the interday imprecision of only 3.8%. The active form of human recombinant Akt1 was used as a quality control sample for all measurements. The levels of phosphorylation at Thr308 and Ser473 sites in the recombinant Akt1 were found to be 78.1 ± 3.0% and 82.2 ± 1.9%, respectively (mean ± SD) (Table 2). These ratios did not change when other buffer systems (e.g., 80% acetonitrile and 50% methanol) were used, suggesting that the phospho- and nonphospho-peptides behave similarly during protein digestion and extraction.
Table 2. Interassay Precision and Accuracy of the Validation Samples (Recombinant Akt).
| phospho-Thr308 peptidea | Thr308 peptidea | stoichiometry of phosphorylation at Thr308 | phospho-Ser473 peptidea | S473 peptidea | stoichiometry of phosphorylation at Ser473 | |
|---|---|---|---|---|---|---|
| 1 | 93.8 | 30.8 | 75.3% | 176.9 | 46.4 | 79.2% |
| 2 | 115.6 | 26.9 | 81.1% | 147.5 | 31.8 | 82.3% |
| 3 | 49.3 | 15.9 | 75.6% | 184.9 | 37.3 | 83.2% |
| 4 | 63.1 | 18.8 | 77.0% | 168.0 | 36.5 | 82.2% |
| 5 | 86.4 | 19.8 | 81.4% | 216.8 | 40.6 | 84.2% |
| Average | 78.1% | 82.2% | ||||
| SD | 3.0% | 1.9% | ||||
| CV | 31.9% | 27.5% | 3.8% | 14.2% | 14.0% | 2.3% |
Measurements are in femtomole of peptide.
Stoichiometry of Akt Phosphorylation in Human T-Cells and the Effects of Pervanadate and PI-3 Kinase Inhibitor Treatment
A human T-cell model with pervanadate and /or PI-3 kinase inhibitor treatments was used to test if the LC-MS/MS method can be used to measure Akt phosphorylation stoichiometry in biological samples. Pervanadate, an extremely potent protein-tyrosine phosphatase inhibitor,(28) is known to activate the PI-3K pathway and stimulate phosphorylation of Akt.29,30 Human CD8+ T-cells (2 × 10⁸ cells) from healthy volunteers were cultured in the absence or presence of pervanadate for 15 min with and without a PI3-K inhibitor (LY294002). The stoichiometry of Akt1 phosphorylation was monitored using both the LC-MS/MS method and traditional Western blotting.
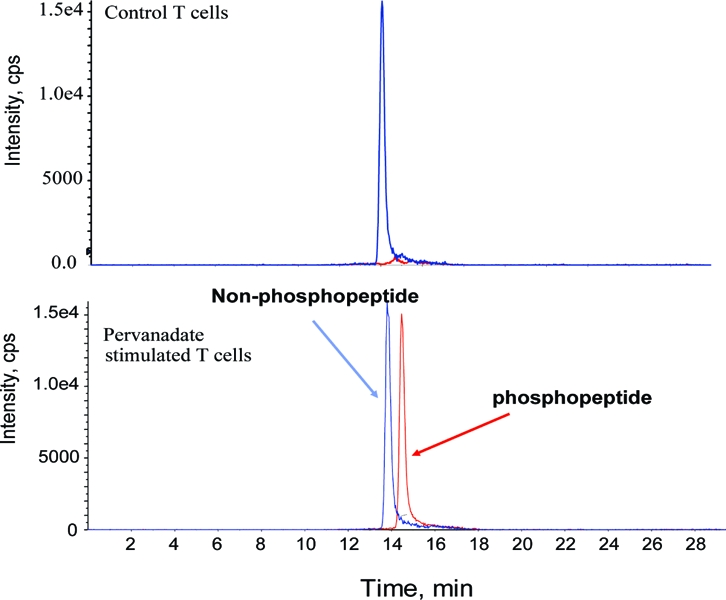
Western blotting analysis indicated that pervanadate stimulated substantial, but undefined, Akt phosphorylation at Thr308 and Ser473 phosphorylation sites compared to the unstimulated cells (Figure 4A). However, the presence of LY294002 decreased phosphorylation levels in both pervanadate stimulated cells and unstimulated cells (Figure 4A). The levels of total Akt1, which did not show any significant difference in all various treatments, provide a reference point to normalize the phosphorylation signals. Useful, but ultimately arbitrary, semiquantitative data can be extracted by expressing the antiphosphorylation Western blot signals as a percentage of the signal for total Akt. In this case, the phosphorylation status for Thr308 and Ser473 in the unstimulated and LY294002 treated cells were undetectable, making any estimates of fold-change upon pervanadate treatment impossible (Figure 4A). In the presence of pervanadate, the PI-3K inhibitor LY294002 decreased Akt phosphorylation by approximately 55% and 32% for Thr308 and Ser473, respectively (Figure 4A). The same samples from these experiments were also analyzed by the LC-MS based method. We found that in the untreated cells the basal stoichiometry of Thr308 and Ser473 phosphorylation was just 0.92% and 0.62%, respectively, and that pervanadate treatment provoked a 39- and 18-fold increase of phosphorylation at Thr308 and Ser473, respectively (Figure 4B,C). The presence of the PI-3 kinase inhibitor LY294002 decreased phosphorylation at both sites by ∼30% in the pervanadate stimulated T-cells (Figure 4C). In the untreated T-cells, the presence of LY294002 also decreased the phosphorylation of Thr308 and Ser473 by 22% and 47%, respectively (Figure 4C). In these experiments, the LC-MS method showed significant advantages over Western blotting procedure. Specifically, the LC-MS method uniquely allowed the accurate measurement of basal Akt phosphorylation stoichiometries of the two key phosphorylation sites, their precise fold-change upon stimulation and the precise effects of the pharmacological agent LY294002 on the stoichiometries of phoshphorylation in resting and stimulated T-cells.
Figure 4.

Measurements of phosphorylation stoichiometry of Akt in cultured human T-cells. CD8+ T-cells (2 × 10⁸ cells) derived from a healthy volunteer (see Experimental Procedures for the details) were cultured in the absence or presence of the stimulant (100 μM pervanadate) with/without 10 μM LY294002 and the phosphorylation levels of Akt were monitored using traditional Western blotting method and the LC-MS/MS method. The experiments were performed three times independently. Similar results were observed in an independent experiment. (A) Western blotting analysis of T-cells treated with pervanadate or LY294002 using phospho-Thr308, phospho-Ser473, total Akt and actin antibodies. A total of 60 μg of protein were loaded in each well and recombinant Akt (12.2 ng) was used as a positive control (shown as R). (B) Extracted ion chromatogram of phospho-Thr308 and Thr308 peptides in control and pervanadate stimulated T-cells. (C) Stoichiometry of Akt phosphorylation (Thr308 and Ser473) in T-cells cultured in different conditions. Phospho and non-phospho-peptides for both sites are expressed in fmol. All LC-MS runs were performed in triplicate.
Stoichiometry of Akt Phosphorylation in U-87 MG Cells and the Effects Wortmannin (PI-3 Kinase Inhibitor) Treatment
We also compared the LC-MS method with Western blot in U-87 MG cells where the phosphorylation of Akt is known to be elevated due to the loss of PTEN.(31) Cells were treated either with or without Ptdlns-3-kinase inhibitor (wortmannin) for 2 h prior to lysis. The basal phosphorylation levels of Akt at Thr308 and Ser473 in U-87 MG cells were 4.80% and 1.49%, respectively, using the LC-MS/MS method (Figure 5A). The presence of wortmannin resulted in an average reduction of 28% and 59% in the phosphorylation levels at Thr308 and Ser473, respectively (Figure 5A). Similarly, Western blots showed a ∼60% decrease of phosphorylation at Ser473. However, the decrease was higher at Thr308 (∼60%) compared to the reading derived from the LC-MS/MS method (Figure 5B).
Figure 5.

Measurements of phosphorylation stoichiometry of Akt in U-87 MG cells. Cells (20 million cells) were cultured in the presence or absence of 7 nM wortmannin for 2 h prior to cell lysis. Stoichiometry of Akt phosphorylation (Thr308 and Ser473) were analyzed using LC-MS/MS (A) and Western blotting (B).
Discussion
Measurement of protein phosphorylation is typically qualitative or semiquantitative by Western blot using phospho-specific antibodies. Consequently, one usually only knows whether the phosphorylation status of a specific site in a given protein component of a signaling cascade has gone up or down in response to extracellular stimuli. This approach usually does not indicate the absolute quantity of the protein or the precise stiochiometry of phosphorylation at specific sites. This missing quantitative information is important for understanding how the cells utilize intracellular machinery to propagate signals. With the LC-MS based quantification method, we are able to monitor phosphorylation events in a much accurate manner. In this study, we have demonstrated that phosphorylation stoichiometry of Akt phosphorylation at Thr308 and Ser473 can be measured accurately in cells. Our results indicate, for the first time, that at the basal state, only 0.92% of Thr308 and 0.62% of Ser473 of Akt were phosphorylated in human T-cells as opposed to the subjective claim of “very low” traditionally quoted by cell biologists. This result suggests that, in resting T-cells, less than 1% of Akt is activated for executing normal cellular function, while 99% of the Akt pool is inactive, presumably reserved to respond to potential extracellular stimulation. Treatment for 12 min with pervanadate, a potent tyrosine phosphatase inhibitor, provoked 39- and 18-fold increase in phosphorylation at Thr308 and Ser473 to 55% and 35%, respectively, suggesting that even under this extreme condition only about 30−55% of T-cell Akt (but not all) is activated in the phosophorylation cascade downstream to receptor tyrosine kinases. Interestingly, the level of phosphorylation at Thr308 was higher than that at Ser473 with pervanadate treatment. It is generally believed that phosphorylation of Akt by PDK-2 at Ser473 is required to fully activate Akt and stabilize its activation state.(14) Thus, our results indicate that only a maximum of 35% of Akt molecules are in a stable, fully activated, state after 12 min treatment with pervanadate in human T-cells. The method was also tested on U-87 MG cells which are known to be lacking PTEN. Inactivation of PTEN leads to accumulation of PIP3 which results in an increase in Akt phosphorylation.(31) Our result demonstrated, for the first time, that even without PTEN, the majority of Akt remains unphosphoryated at Thr308 and Ser473 and such a low level of phosphorylation is sufficient to stimulate abnormal cell proliferation contributing to tumorigenesis. For both Western blotting and the LC-MS/MS method, the decrease of phosphorylation caused by the PI3-K inhibitor was similar at Ser473 (∼60%), while at Thr308, the decrease was less pronounced using the LC-MS/MS method. This discrepancy may be linked to oxidation of the methionine residue present in the phospho-Thr308 and Thr308 peptides (Figure 3).
We encountered complications regarding the quantification of phosphorylation at Thr308 of Akt. The chymotryptic peptide containing Thr308 also contains two reactive amino acid residues: methionine and cysteine. The cysteine residue was handled by reduction and S-alkylation. However, S-alkyl cysteine is known to be susceptible to oxidation during sample processing, especially during gel electrophoresis.(32) Similarly, and more acutely, methionine oxidation occurs in vivo and/or during sample preparation and electrophoresis and methionine sulfoxide can be further oxidized irreversibly to methionine sulfone.(32) We have evaluated these effects by estimating the intraday imprecision in five independent experiments. As expected, a lower yield and higher imprecision for Thr308 and phospho-Thr308 peptides, compared to those of Ser473 and phospho-Ser473 peptides, were apparent (Table 2 and Figure 4C). For this reason, we only recommend using the Ser473 figures for absolute quantification of Akt. However, although significant variation was observed at the individual peptide level, the imprecision in the ratio of phospho-Thr308 to Thr308 was acceptable. Thus, it seems that the oxidation and phosphorylation status of Akt prior to chymotryptic digestion does not distort the ratio of the phospho-Thr308 and Thr308 peptides. It also appears that the two peptides, once generated, behave similarly with regard to methionine oxidation. From these data, we conclude that the phosphorylation stoichiometry measurements for Thr308 using this method are robust.
One potential application of this LC-MS method is for patient selection and for pharmaco-dynamic measurements for PI-3K/mTOR pathway inhibition. The major issue with current immunoassay methods is the lack of absolute quantitative capability. It is often very difficult to compare results from different studies (or from different laboratories) due to variation in methods and references used. This method could potentially provide more definitive answer as to whether or not a patient should receive PI-3K/mTOR inhibitor, and could also offer crucial information on drug dosage and inhibition of the targets. Our preliminary data using this procedure allow measurement of Akt phosphorylation status using approximately 20 mg of breast tumor tissue (A. Thompson, A. Atrih, and J. Huang, unpublished data). Although this is more than what is normally required for immunoassays, one can foresee that this issue could be improved by new generation of mass spectrometers with better sensitivity. As the MRM approach allows monitoring multiple sites (up to 100 transitions at the same time), this approach can in principle be extended to monitor multiple phosphorylation sites from multiple proteins in a single LC-MS/MS run. Once developed, this could open up a new era for quantitative proteomic analysis in systems biology by providing phosphorylation stoichiometry at the pathway level. This would be particularly useful for large-scale population studies.
In summary, we have developed a reliable LC-MS method for stoichiometric quantification of Akt phosphorylation of Thr308 and Ser473 sites. Compared to Western blot, the LC-MS based method provides similar sensitivity but significantly more in-depth information.
Abbreviations:
Akt, protein kinase B; PI3-K, phosphoinositide 3-kinases; PIP2, phosphatidylinositol biphosphate; PIP3, phosphatidylinositol trisphosphate; PH, pleckstrin homology; PDK-1, 3-phosphoinositide-dependent protein kinase; SGK, serum and glucocorticoid inducible kinase, PKC; protein kinase C; ILK, integrin-linked kinase; mTOR, the mammalian target of rapamycin; PTEN, phosphatase and tensin homologue; SHIP, SH2 domain containing inositol phosphatase; MRM multiple reaction monitoring; ERK, extracellular signal-regulated kinase; IL2, interleukin 2.
Acknowledgments
The authors would like to thank Dr. David Finlay and Professor Doreen Cantrell for providing T-cells and also advice on the culture and treatment of T-cells. Laura Spinelli and Dr. Nicolas Leslie for providing human glioblastoma cell line (U-87 MG) and also advise on the culture of the cells. We thank Douglas Lamont and Kenneth Beattie in the College of Life Sciences Fingerprints Proteomics Facility (supported by Wellcome Trust Strategic Award 083481) for access to the Q-Trap 4000 instrument. This work was supported by a Translational Medical Research Collaboration (TMRC) grant (ONC-DU-65).
Supporting Information Available
Selection of suitable antibody for immunoprecipitation of recombinant Akt; efficiency of antibody C (a.a. 466-480) in immunoprecipitation of Akt from cell lysates. This material is available free of charge via the Internet at http://pubs.acs.org.
Supplementary Material
References
- Luo J.; Manning B. D.; Cantley L. C. Targeting the PI3K-Akt pathway in human cancer: rationale and promise. Cancer Cell 2003, 4 (4), 257–62. [DOI] [PubMed] [Google Scholar]
- Vivanco I.; Sawyers C. L. The phosphatidylinositol 3-Kinase AKT pathway in human cancer. Nat. Rev. 2002, 2 (7), 489–501. [DOI] [PubMed] [Google Scholar]
- Whiteman E. L.; Cho H.; Birnbaum M. J. Role of Akt/protein kinase B in metabolism. Trends Endocrinol. Metab. 2002, 13 (10), 444–51. [DOI] [PubMed] [Google Scholar]
- Dummler B.; Hemmings B. A. Physiological roles of PKB/Akt isoforms in development and disease. Biochem. Soc. Trans. 2007, 35 (Pt 2), 231–5. [DOI] [PubMed] [Google Scholar]
- Mora A.; Komander D.; van Aalten D. M.; Alessi D. R. PDK1, the master regulator of AGC kinase signal transduction. Semin. Cell Dev. Biol. 2004, 15 (2), 161–70. [DOI] [PubMed] [Google Scholar]
- Alessi D. R.; James S. R.; Downes C. P.; Holmes A. B.; Gaffney P. R.; Reese C. B.; Cohen P. Characterization of a 3-phosphoinositide-dependent protein kinase which phosphorylates and activates protein kinase Balpha. Curr. Biol. 1997, 7 (4), 261–9. [DOI] [PubMed] [Google Scholar]
- Hawkins P. T.; Anderson K. E.; Davidson K.; Stephens L. R. Signalling through Class I PI3Ks in mammalian cells. Biochem. Soc. Trans. 2006, 34 (Pt. 5), 647–62. [DOI] [PubMed] [Google Scholar]
- Hresko R. C.; Mueckler M. mTOR.RICTOR is the Ser473 kinase for Akt/protein kinase B in 3T3-L1 adipocytes. J. Biol. Chem. 2005, 280 (49), 40406–16. [DOI] [PubMed] [Google Scholar]
- Stambolic V.; Mak T. W.; Woodgett J. R. Modulation of cellular apoptotic potential: contributions to oncogenesis. Oncogene 1999, 18 (45), 6094–103. [DOI] [PubMed] [Google Scholar]
- Liu Q.; Sasaki T.; Kozieradzki I.; Wakeham A.; Itie A.; Dumont D. J.; Penninger J. M. SHIP is a negative regulator of growth factor receptor-mediated PKB/Akt activation and myeloid cell survival. Genes Dev. 1999, 13 (7), 786–791. [DOI] [PMC free article] [PubMed] [Google Scholar]
- Stambolic V.; Woodgett J. R. Functional distinctions of protein kinase B/Akt isoforms defined by their influence on cell migration. Trends Cell Biol. 2006, 16 (9), 461–6. [DOI] [PubMed] [Google Scholar]
- Le Page C.; Koumakpayi I. H.; Alam-Fahmy M.; Mes-Masson A. M.; Saad F. Expression and localisation of Akt-1, Akt-2 and Akt-3 correlate with clinical outcome of prostate cancer patients. Br. J. Cancer 2006, 94 (12), 1906–12. [DOI] [PMC free article] [PubMed] [Google Scholar]
- Easton R. M.; Cho H.; Roovers K.; Shineman D. W.; Mizrahi M.; Forman M. S.; Lee V. M.; Szabolcs M.; de Jong R.; Oltersdorf T.; Ludwig T.; Efstratiadis A.; Birnbaum M. J. Role for Akt3/protein kinase Bgamma in attainment of normal brain size. Mol. Cell. Biol. 2005, 25 (5), 1869–78. [DOI] [PMC free article] [PubMed] [Google Scholar]
- Sarbassov D. D.; Guertin D. A.; Ali S. M.; Sabatini D. M. Phosphorylation and regulation of Akt/PKB by the rictor-mTOR complex. Science 2005, 307 (5712), 1098–101. [DOI] [PubMed] [Google Scholar]
- Samuels Y.; Wang Z.; Bardelli A.; Silliman N.; Ptak J.; Szabo S.; Yan H.; Gazdar A.; Powell S. M.; Riggins G. J.; Willson J. K.; Markowitz S.; Kinzler K. W.; Vogelstein B.; Velculescu V. E. High frequency of mutations of the PIK3CA gene in human cancers. Science 2004, 304 (5670), 554. [DOI] [PubMed] [Google Scholar]
- Carracedo A.; Pandolfi P. P. The PTEN-PI3K pathway: of feedbacks and cross-talks. Oncogene 2008, 27 (41), 5527–41. [DOI] [PubMed] [Google Scholar]
- Carpten J. D.; Faber A. L.; Horn C.; Donoho G. P.; Briggs S. L.; Robbins C. M.; Hostetter G.; Boguslawski S.; Moses T. Y.; Savage S.; Uhlik M.; Lin A.; Du J.; Qian Y. W.; Zeckner D. J.; Tucker-Kellogg G.; Touchman J.; Patel K.; Mousses S.; Bittner M.; Schevitz R.; Lai M. H.; Blanchard K. L.; Thomas J. E. A transforming mutation in the pleckstrin homology domain of AKT1 in cancer. Nature 2007, 448 (7152), 439–44. [DOI] [PubMed] [Google Scholar]
- Harrington L. S.; Findlay G. M.; Lamb R. F. Restraining PI3K: mTOR signalling goes back to the membrane. Trends Biochem. Sci. 2005, 30 (1), 35–42. [DOI] [PubMed] [Google Scholar]
- Kwon G.; Marshall C. A.; Pappan K. L.; Remedi M. S.; McDaniel M. L. Signaling elements involved in the metabolic regulation of mTOR by nutrients, incretins, and growth factors in islets. Diabetes 2004, 53 (3), S225–32. [DOI] [PubMed] [Google Scholar]
- Chalhoub N.; Baker S. J. PTEN and the PI3-Kinase pathway in cancer. Annu. Rev. Pathol. 2009, 4, 127–50. [DOI] [PMC free article] [PubMed] [Google Scholar]
- Gerber S. A.; Rush J.; Stemman O.; Kirschner M. W.; Gygi S. P. Absolute quantification of proteins and phosphoproteins from cell lysates by tandem MS. Proc. Natl. Acad. Sci. U.S.A. 2003, 100 (12), 6940–5. [DOI] [PMC free article] [PubMed] [Google Scholar]
- Ciccimaro E.; Hevko J.; Blair I. A. Analysis of phosphorylation sites on focal adhesion kinase using nanospray liquid chromatography/multiple reaction monitoring mass spectrometry. Rapid Commun. Mass Spectrom. 2006, 20 (24), 3681–92. [DOI] [PubMed] [Google Scholar]
- Ciccimaro E.; Hanks S. K.; Blair I. A. Quantification of focal adhesion kinase activation loop phosphorylation as a biomarker of Src activity. Mol. Pharmacol. 2009, 75 (3), 658–66. [DOI] [PMC free article] [PubMed] [Google Scholar]
- Mayya V.; Rezual K.; Wu L.; Fong M. B.; Han D. K. Absolute quantification of multisite phosphorylation by selective reaction monitoring mass spectrometry: determination of inhibitory phosphorylation status of cyclin-dependent kinases. Mol. Cell. Proteomics 2006, 5 (6), 1146–57. [DOI] [PubMed] [Google Scholar]
- Ballif B. A.; Roux P. P.; Gerber S. A.; MacKeigan J. P.; Blenis J.; Gygi S. P. Quantitative phosphorylation profiling of the ERK/p90 ribosomal S6 kinase-signaling cassette and its targets, the tuberous sclerosis tumor suppressors. Proc. Natl. Acad. Sci. U.S.A. 2005, 102 (3), 667–72. [DOI] [PMC free article] [PubMed] [Google Scholar]
- Cantrell D. A.; Smith K. A. Transient expression of interleukin 2 receptors. Consequences for T cell growth. J. Exp. Med. 1983, 158 (6), 1895–911. [DOI] [PMC free article] [PubMed] [Google Scholar]
- Walsh E. P.; Lamont D. J.; Beattie K. A.; Stark M. J. Novel interactions of Saccharomyces cerevisiae type 1 protein phosphatase identified by single-step affinity purification and mass spectrometry. Biochemistry 2002, 41 (7), 2409–20. [DOI] [PubMed] [Google Scholar]
- Secrist J. P.; Burns L. A.; Karnitz L.; Koretzky G. A.; Abraham R. T. Stimulatory effects of the protein tyrosine phosphatase inhibitor, pervanadate, on T-cell activation events. J. Biol. Chem. 1993, 268 (8), 5886–93. [PubMed] [Google Scholar]
- Costello P. S.; Gallagher M.; Cantrell D. A. Sustained and dynamic inositol lipid metabolism inside and outside the immunological synapse. Nat. Immunol. 2002, 3 (11), 1082–9. [DOI] [PubMed] [Google Scholar]
- Beraud C.; Henzel W. J.; Baeuerle P. A. Involvement of regulatory and catalytic subunits of phosphoinositide 3-kinase in NF-kappaB activation. Proc. Natl. Acad. Sci. U.S.A. 1999, 96 (2), 429–34. [DOI] [PMC free article] [PubMed] [Google Scholar]
- Fine B.; Hodakoski C.; Koujak S.; Su T.; Saal L. H.; Maurer M.; Hopkins B.; Keniry M.; Sulis M. L.; Mense S.; Hibshoosh H.; Parsons R. Activation of the PI3K pathway in cancer through inhibition of PTEN by exchange factor P-REX2a. Science 2009, 325 (5945), 1261–5. [DOI] [PMC free article] [PubMed] [Google Scholar]
- Froelich J. M.; Reid G. E. The origin and control of ex vivo oxidative peptide modifications prior to mass spectrometry analysis. Proteomics 2008, 8 (7), 1334–45. [DOI] [PubMed] [Google Scholar]
Associated Data
This section collects any data citations, data availability statements, or supplementary materials included in this article.