

Abstract
Background:
High-resolution CT (HRCT) scanning is part of the management of severe asthma, but its application varies between centers. We sought to describe the HRCT scan abnormalities of a large severe asthma cohort and to determine the utility of clinical features to direct the use of HRCT scanning in this group of patients.
Methods:
Subjects attending our Difficult Asthma Clinic (DAC) between February 2000 and November 2006 (n = 463) were extensively re-characterized and 185 underwent HRCT scan. The HRCT scans were analyzed qualitatively and the interobserver variability was assessed. Using logistic regression we defined clinical parameters that were associated with bronchiectasis (BE) and bronchial wall thickening (BWT) alone or in combination.
Results:
HRCT scan abnormalities were present in 80% of subjects and often coexisted with BWT (62%), BE (40%), and emphysema (8%). The interobserver agreement for BE (κ = 0.76) and BWT (κ = 0.63) was substantial. DAC patients who underwent HRCT scanning compared with those who did not were older, had longer disease duration, had poorer lung function, were receiving higher doses of corticosteroids, and had increased neutrophilic airway inflammation. The sensitivity and specificity of detecting BE clinically were 74% and 45%, respectively. FEV1/FVC ratio emerged as an important predictor for both BE and BWT but had poor discriminatory utility for subjects who did not have airway structural changes (FEV1/FVC ratio, ≥ 75%; sensitivity, 67%; specificity, 65%).
Conclusion:
HRCT scan abnormalities are common in patients with severe asthma. Nonradiologic assessments fail to reliably predict important bronchial wall changes; therefore, CT scan acquisition may be required in all patients with severe asthma.
Asthma is increasing in prevalence worldwide with an estimated 300 million affected individuals.1 Asthma affects approximately 5% of adults in the general population, of whom approximately 5% to 10% have severe and/or difficult-to-treat asthma.2 These patients with inadequately controlled severe asthma are at a particularly high risk of exacerbations, hospitalization, and death, and often have severely impaired quality of life. Although this group represents a relatively small proportion of the asthma population, they consume a disproportionately high amount of health-care resources attributed to asthma.3
High-resolution CT (HRCT) scanning plays a role in the diagnostic workup of patients with severe asthma.2 It has emerged as a useful tool to noninvasively assess airway wall changes in patients with asthma.4–7 HRCT scan studies in asthmatic subjects may reveal abnormal radiologic findings, such as bronchial wall thickening (BWT), bronchial wall dilatation, bronchiectasis (BE), mosaic lung attenuation, mucus plugging, prominent centrilobular opacities, emphysema, and atelectasis.8–12 However, the determination of which asthmatic patients should undergo HRCT scanning is uncertain and varies between specialist centers. In the current, qualitative, cross-sectional study, we describe the HRCT scan findings in a large cohort of patients with severe asthma, define the clinical characteristics of those subjects with and without BE and/or BWT, and assess the validity of these clinical parameters to guide the application of HRCT scanning in patients with severe asthma.
Materials and Methods
Subjects
We performed a cross-sectional, single-center, retrospective study based on the Difficult Asthma Clinic (DAC) at Glenfield Hospital (Leicester, UK). The diagnosis of asthma was confirmed by a physician based on medical history and one or more of the following objective criteria: maximum diurnal peak expiratory flow variability of >20% over a 2-week period; significant bronchodilator reversibility, defined as an increase in FEV1 of >200 mL after bronchodilator therapy; or a provocative concentration of methacholine causing a 20% fall in FEV1 of <8 mg/mL. Fixed airflow obstruction (FAO) was defined as a post-bronchodilator therapy FEV1 of < 80% predicted and FEV1/FVC ratio of <70%. Of 463 patients attending the DAC between February 2000 and November 2006, 185 patients underwent HRCT scans. The clinical indications for the HRCT scans were determined by the attending physician. The most common indication was a clinical suspicion of BE in 116 patients (63%). Other indications for an HRCT scan request were interstitial lung disease (15%), emphysema (12%), and miscellaneous (10%), including unresolved infection and cryptogenic organizing pneumonia. Informed consent for clinical characterization and CT scanning was obtained from all patients. The Leicestershire, Northamptonshire, and Rutland Research Ethics Committee approved this study.
Clinical Characterization
Patients attending the DAC undergo extensive recharacterization and investigations, including medical history, health status, spirometry before and after bronchodilator therapy (400 μg of inhaled albuterol), allergen skin-prick tests for common aeroallergens, blood tests for peripheral eosinophil count, total and specific IgE measurements, and Aspergillus IgG tests, and sputum induction.13
Cross-Sectional Imaging
HRCT scanning was performed (February 2000 to March 2003: Picker PQS scanner; Picker International; Cleveland, OH; March 2003 to November 2006: Sensation 16 scanner; Siemens Healthcare; Knoxville, TN). Sequential scanning was performed at 10-mm increments with 1-mm collimation from the apex of the lung to the diaphragm. The number of CT scan slices obtained varied between patients based on their body habitus. Patients were scanned while in the supine position at maximal inspiration (adequate breath holding was rehearsed prior to the CT scan), with their arms held over their head. Images were reconstructed by using a high-spatial frequency algorithm, through a 512×512 matrix, with a small field of view targeted to image-only pulmonary areas. Scanning time ranged between 30 s and 45 s with a 120-kilovolt peak and an effective tube current of 140 mA. Images were saved and reported at a window width of 1,600 Hounsfield units and a window level of −500 Hounsfield units.14
Image Evaluation
All HRCT scans were evaluated by one of the thoracic radiologists. The radiologists were unaware of the patient's inclusion in the study. BE was considered to be present when the HRCT scan showed the presence of one or more of the following: (1) an internal diameter of the bronchus greater than that of the adjacent pulmonary artery; (2) a lack of tapering of the bronchial lumen toward the periphery; or (3) visualization of bronchus within 1 cm of the pleural surface.15 Determination of presence of BWT was based on a subjective assessment. The presence of BE or BWT was recorded, but the total number of airways assessed could not be determined; as with standard HRCT scans, an airway cannot always be tracked all the way from its origin to its division, hence, the same airway may be assessed on multiple CT slices. A randomly selected subset of 50 CT scans was reported by another blinded thoracic radiologist, and an interobserver reliability analysis using the κ statistic was performed. Patients were categorized into the following groups: group A, those with neither BWT or BE (BWT−/BE−); group B, those with BE only (BWT−/BE+); group C, those with the presence of both BWT and BE (BWT+/BE+); or group D, those with BWT only (BWT+/BE−) [Fig 1].
Figure 1.

Representative images of patient categories based on the presence or absence of BWT and BE on HRCT scans as follows: (A) BWT−/BE−; (B) BWT−/BE+; (C) BWT+/BE+; and (D) BWT+/BE−.
Statistical Analysis
Statistical analysis was performed by using statistical software packages (GraphPad Prism, version 5.00 for Windows; GraphPad Software; San Diego, CA; and SPSS for Windows, release 16.0.1.2008; SPSS, Inc; Chicago, IL).
Parametric data were expressed as the mean (SEM), and nonparametric data were described as the median (interquartile range [IQR]). One-way analysis of variance with Tukey posttest correction was used for across-group comparison of parametric data. Kruskal-Wallis one-way analysis of variance with Dunn posttest correction was used for across-group comparisons of nonparametric data. χ2 tests were used to compare categorical data. The κ statistic was used for an interobserver reliability analysis. κ statistics were interpreted as indicating poor (κ, <0), slight (0<κ<0.2), fair (0.21<κ<0.4), moderate (0.41<κ<0.6), substantial (0.61<κ<0.8), and almost perfect (0.81<κ<1.0) observer agreement.16,17
Logistic regression analysis and reporting were performed as described previously.18,19 The variables were considered for multivariate logistic regression based on the following: (1) association in prior univariate analysis (p<0.2); and (2) biological plausibility. This analysis was performed for the whole DAC cohort (n = 185) and DAC patients with a smoking history of <20 pack-years (n = 123). Variables entered into the regression model were as follows: disease duration; post-bronchodilator therapy FEV1 percent predicted; post-bronchodilator therapy FEV1/FVC ratio; sputum neutrophil count (percentage); and sputum eosinophil count (percentage). The final multivariate logistic regression model was determined, using the block entry of variables, to assess factors which best predicted BE and/or BWT. The Hosmer-Lemeshow χ2 test of goodness of fit was used to test the overall fit of the logistic regression model (nonsignificant p value implying that the model adequately fits the data). The Wald statistic was used to test the significance of individual logistic regression coefficients for each independent variable. The Nagelkerke R2 (ie, pseudo-R2) was used to estimate the percentage of variance explained by the model. The measure of discriminative power of the logistic equation was reported in the form of the c-statistic. No multi-collinearity or significant interactions were found between independent variables. Conformity to a linear gradient for continuous independent variables was assessed by using the Box-Tidwell transformation. A p value of <0.05 was taken as the threshold for statistical significance.
Results
Baseline demographics and clinical characteristics of those difficult asthma patients who did undergo thoracic HRCT scanning (DAC 1) and those who did not undergo thoracic HRCT scanning (DAC 2) are shown in Table 1. In both groups, subjects had severe disease requiring therapy with a high dose of inhaled corticosteroids, long-acting bronchodilators, and, often, maintenance oral corticosteroids. Patients who underwent HRCT scanning were older, had longer disease duration, poorer lung function, were treated with a higher dose of inhaled corticosteroids and oral corticosteroids, and had increased neutrophilic airway inflammation (Table 1).
Table 1.
Baseline Clinical Characteristics of the DAC (n = 463)
| Clinical Characteristics | DAC 1(n = 185) | DAC 2(n = 278) |
|---|---|---|
| Age, yr* | 50.2 (1.1) | 40.4 (0.9) |
| Gender | ||
| Male | 73 | 97 |
| Female | 112 | 181 |
| Disease duration, yr* | 25.7 (1.4) | 21.9 (0.9) |
| Smoking status, % | ||
| Never-smoker | 59.7 | 61.9 |
| Ex-smoker | 30.1 | 24.9 |
| Current smoker | 10.2 | 13.2 |
| Smoking history, pack-yr | ||
| Ex-smoker* | 16.8 (2.1) | 10.7 (1.4) |
| Current smoker | 19.3 (3.0) | 13.7 (2.5) |
| Atopy, % | 64.7 | 67.8 |
| Severe exacerbations/yr | 2.5 (0.2) | 2.4 (0.2) |
| Pre-bronchodilator therapyFEV1, % predicted* | 66.80 (1.8) | 74.6 (1.3) |
| Pre-bronchodilator therapyFEV1/FVC ratio* | 69.3 (1.0) | 72.3 (0.7) |
| Post-bronchodilator therapyFEV1, % predicted* | 71.9 (1.8) | 80.0 (1.3) |
| Post-bronchodilator therapyFEV1/FVC ratio* | 70.7 (1.0) | 74.4 (0.7) |
| Bronchodilator response, % | 9.1 (1.0) | 8.4 (0.8) |
| Inhaled corticosteroid doseBDP, μg/24 h* | 2042 (72.4) | 1623 (51.2) |
| Long-acting β2-agonist, % | 97.1 | 92.6 |
| Oral corticosteroids, %† | 41.6 | 23 |
| Leukotriene receptorantagonist, %‡ | 37 | 27 |
| Sputum characteristics | ||
| Eosinophils, % | 1.7 (0.3–8.4) | 2.7 (0.5–9.8) |
| Neutrophils, %§ | 73.5 (44.7–88.4) | 64.2 (35.4–83.5) |
| Total cells, × 106/g§ | 3.2 (1.3–8.0) | 1.2 (0.5–2.9) |
| Total neutrophils, × 106/g§ | 1.5 (0.8–4.9) | 0.7 (0.2–1.8) |
Data are expressed as the mean (SEM) or median (IQR), unless otherwise indicated. Beclomethasone dipropionate equivalents: fluticasone, 2:1; budesonide, 1.25:1; mometasone, 1.25:1; QVAR, 2:1; ciclesonide, 2.5:1. BDP = beclomethasone dipropionate.
*p < 0.05 (unpaired t test).
†p < 0.0001 (Fisher exact test).
‡p < 0.05 (Fisher exact test).
§p < 0.05 (Mann-Whitney U test).
BWT and BE was present in 62% and 40%, respectively, of those subjects who underwent HRCT scans. Interobserver reliability for the reporting radiologists was substantial for BE (κ = 0.76) and BWT (κ = 0.63). Allergic bronchopulmonary aspergillosis (ABPA) according to the Greenberger criteria20 was present in 5% of DAC 1 patients (ABPA-central BE in 0.5% and ABPA-seropositive in 4.5%) and 2.2% of DAC 2 patients. Other radiologic findings were as follows: ground-glass shadowing (4.3%); airtrapping (7.6%); and emphysema (8.1%). HRCT scan findings were reported as normal in 20% of the cohort. Radiologic findings on HRCT scans in DAC patients who were current or ex-smokers compared with patients who never smoked were as follows: BWT, 59% vs 63% (p = 0.6), respectively; BE, 48% vs 26% (p = 0.004), respectively; and emphysema, 17% vs 3% (p = 0.002), respectively. In those patients with and without FAO the radiologic findings were as follows: BWT, 63% vs 60% (p = 0.8), respectively; BE, 50% vs 34% (p = 0.04), respectively; and emphysema, 12% vs 6% (p = 0.2), respectively. The sensitivity and specificity of detecting BE clinically, when radiologic detection was considered as the “gold standard,” were 74% and 45%, respectively.
Clinical characteristics for individual groups (group A, BWT−/BE−; group B, BWT−/BE+; group C, BWT+/BE+; and group D, BWT+/BE−) are shown in Table 2. Patients in group B were older than patients in the other groups. Disease duration was increased and post-bronchodilator therapy FEV1/FVC ratio was decreased in subjects in groups C and D compared with those in groups A and D (Table 2).
Table 2.
Clinical Characteristics of Individual Groups (n = 185)
| Clinical Characteristics | Group A(n = 47) | Group B(n = 24) | Group C(n = 50) | Group D(n = 64) |
|---|---|---|---|---|
| Age, yr | 48.7 (1.8) | 61 (2.8)* | 49.4 (2.1) | 47.1 (1.7) |
| Gender | ||||
| Male | 16 | 9 | 25 | 23 |
| Female | 31 | 15 | 25 | 41 |
| Disease duration, yr | 20.9 (2.3) | 33.0 (4.7)* | 29.5 (2.6)* | 24.0 (1.9) |
| Smoking status, % | ||||
| Never-smoker | 58 | 58 | 50 | 71 |
| Ex-smoker | 25 | 33 | 42 | 23 |
| Current smoker | 18 | 8 | 8 | 7 |
| Smoking history, pack-yr | ||||
| Ex-smoker | 14.7 (6.1) | 11.3 (1.9) | 17.4 (3.5) | 20.3 (4.3) |
| Current smoker | 20.2 (6.6) | 25.3 (0.3) | 28.5 (9.4) | 13.6 (3.9) |
| Atopy, % | 57 | 46 | 71 | 62 |
| Severe exacerbations/yr | 2.5 (0.4) | 1.9 (0.5) | 2.6 (0.6) | 2.3 (0.3) |
| Pre-bronchodilator therapy FEV1, % predicted | 72.0 (3.6) | 62.0 (6.0) | 61.5 (3.0) | 68.9 (2.8) |
| Pre-bronchodilator therapy FEV1/FVC ratio | 75.0 (1.8) | 69.1 (3.4) | 65.5 (2.1)* | 68.2 (1.5) |
| Post-bronchodilator therapy FEV1, % predicted | 77.2 (3.6) | 65.3 (6.4) | 68.8 (3.3) | 73.0 (2.9) |
| Post-bronchodilator therapy FEV1/FVC ratio | 76.3 (1.7) | 63.0 (3.5)* | 68.5 (2.2)* | 71.2 (1.3) |
| Bronchodilator response, % | 7.2 (2.1) | 12.8 (3.7) | 10.1 (2.0) | 8.3 (1.5) |
| Inhaled corticosteroid dose BDP, μg/24 h | 1,942 (138.2) | 2,480 (234.7) | 1,972 (140.9) | 2,011 (115.1) |
| Long-acting β2-agonist, % | 98 | 88 | 96 | 95 |
| Oral corticosteroids, % | 29 | 58 | 46 | 40 |
| Leukotriene receptor antagonist, % | 33 | 46 | 39 | 37 |
| Sputum characteristics | ||||
| Eosinophils, % | 0.8 (0–12.3) | 0.8 (0–6.8) | 2.6 (0.1–10.7) | 1.5 (0.3–6.3) |
| Neutrophils, % | 72.6 (33.8–90.5) | 75.4 (46.0–84.0) | 71.9 (38.9–89.5) | 71.8 (45.0–87.5) |
| Total cells, × 106 cells/g | 3.3 (1.2–7.7) | 3.6 (1.4–5.1) | 2.8 (1.3–9.4) | 3.9 (1.4–10.9) |
| Total neutrophils, × 106 cells/g | 1.2 (0.5–4.9) | 2.1 (0.9–3.4) | 1.4 (0.8–6.0) | 3.2 (0.7–6.1) |
Data are expressed as the mean (SEM) or median (IQR), unless otherwise indicated. Intergroup comparison: parametric data, one-way analysis of variance with Tukey test to compare all pairs of columns.
*p < 0.05; nonparametric data, Kruskal-Wallis test with Dunn multiple comparison test to compare all pairs of columns.
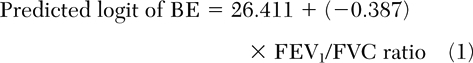
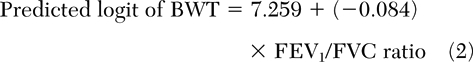
The presence of BE or BWT alone were best predicted by post-bronchodilator therapy FEV1/FVC ratio (Table 3) [equations 1 and 2].
 |
 |
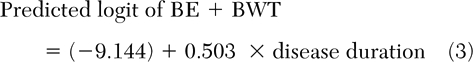
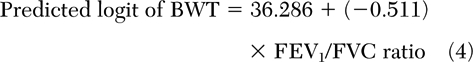
In those patients with a smoking history of <20 pack-years, BE+BWT combined was best predicted by disease duration (Table 3) [equation 3], and BWT was best predicted by post-bronchodilator therapy FEV/FVC ratio (Table 3) [equation 4].
 |
 |
We evaluated the utility of FEV1/FVC ratio in identifying DAC patients with normal airways, by calculating the area under the receiver operating characteristic (ROC) curve (a positive state is the absence of both BWT and BE) [Fig 2]. The area under the ROC curve was 0.67 (95% CI, 0.58 to 0.76; p = 0.001). FEV1/FVC ratio (≥75%) identified DAC patients with normal airways with a sensitivity of 67% and a specificity of 65% (positive likelihood ratio, 1.9; negative likelihood ratio, 0.5; positive predictive value [PPV], 39%; negative predictive value [NPV], 85%).
Table 3.
Logistic Regressions
| Predictor Variables | B (SE) | Wald χ2 Test | p Value | Odds Ratio (95% CI) |
|---|---|---|---|---|
| Group A and B patients (n = 71) [dichotomous dependent variable: BE only]* | ||||
| Disease duration | 0.02 (0.04) | 0.15 | 0.70 | 1.02 (0.94–1.10) |
| Post-bronchodilator therapy FEV1 % predicted | 0.09 (0.05) | 3.68 | 0.06 | 1.10 (0.99–1.21) |
| Post-bronchodilator therapy FEV1/FVC ratio | −0.39 (0.16) | 5.59 | 0.02 | 0.68 (0.49–0.94) |
| Sputum eosinophils, % | −0.14 (0.08) | 3.11 | 0.08 | 0.87 (0.75–1.02) |
| Sputum neutrophils, % | −0.05 (0.03) | 2.45 | 0.12 | 0.95 (0.89–1.01) |
| Group A and D patients (n = 111) [dichotomous dependent variable: BWT only]† | ||||
| Disease duration | −0.03 (0.03) | 1.46 | 0.23 | 0.97 (0.92–1.02) |
| Post-bronchodilator therapy FEV1 % predicted | 0.002 (0.01) | 0.02 | 0.89 | 1.00 (0.97–1.03) |
| Post-bronchodilator therapy FEV1/FVC ratio | −0.08 (0.03) | 6.19 | 0.01 | 0.92 (0.86–0.98) |
| Sputum eosinophils, % | −0.01 (0.02) | 0.07 | 0.79 | 0.99 (0.96–1.03) |
| Sputum neutrophils, % | 0.01 (0.01) | 1.20 | 0.27 | 1.01 (0.99–1.04) |
| DAC cohort of patients smoking < 20 pack-yr, group A and C patients (n = 84) [dichotomous dependent variables: BE and BWT]‡ | ||||
| Disease duration | 0.50 (0.23) | 4.85 | 0.03 | 1.65 (1.06–2.59) |
| Post-bronchodilator therapy FEV1 % predicted | −0.06 (0.07) | 0.85 | 0.36 | 0.94 (0.82–1.08) |
| Post-bronchodilator therapy FEV1/FVC ratio | −0.17 (0.09) | 3.44 | 0.06 | 0.84 (0.70–1.01) |
| Sputum eosinophils, % | 0.003 (0.05) | 0.004 | 0.95 | 1.00 (0.91–1.10) |
| Sputum neutrophils, % | 0.09 (0.06) | 2.41 | 0.12 | 1.09 (0.98–1.21) |
| DAC cohort of patients smoking < 20 pack-yr, group A and D patients (n = 100) [dichotomous dependent variable: BWT only]§ | ||||
| Disease duration | −0.10 (0.05) | 3.58 | 0.06 | 0.91 (0.82–1.00) |
| Post-bronchodilator therapy FEV1 % predicted | 0.07 (0.05) | 2.33 | 0.13 | 1.07 (0.98–1.17) |
| Post-bronchodilator therapy FEV1/FVC ratio | −0.51 (0.21) | 5.98 | 0.01 | 0.60 (0.40–0.90) |
| Sputum eosinophils, % | −0.02 (0.02) | 0.58 | 0.45 | 0.98 (0.94–1.03) |
| Sputum neutrophils, % | 0.06 (0.28) | 3.70 | 0.05 | 1.06 (0.99–1.12) |
*Hosmer-Lemeshow goodness-of-fit test (χ2 = 4.77; p = 0.78); Nagelkerke R2, 0.7; c-statistic, 86.3%; model accuracy in classification, 90%; improvement in classification from baseline, 24%; sensitivity, 87.5%; specificity, 91.2%; PPV, 82.3%; NPV, 93.9%.
†Hosmer-Lemeshow goodness-of-fit test (χ2 = 4.63; p = 0.79); Nagelkerke R2, 0.21; c-statistic, 70.6%; model accuracy in classification, 71.1%; improvement in classification from baseline, 9.7%; sensitivity, 86.3%; specificity, 46.9%; PPV, 72.1%; NPV, 68.2%.
‡Hosmer-Lemeshow goodness-of-fit test (χ2, 1.72; p = 0.97); Nagelkerke R2, 0.85; c-statistic, 75.1%; model accuracy in classification, 91.3%; improvement in classification from baseline, 34.8%; sensitivity, 90%; specificity, 92.3%; PPV, 90%; NPV, 92.3%.
§Hosmer-Lemeshow goodness-of-fit test (χ2, 4.61; p = 0.80); Nagelkerke R2, 0.73; c-statistic, 72.7%; model accuracy in classification, 85.9%; improvement in classification from baseline, 21.8%; sensitivity, 90.2%; specificity, 78.3%; PPV, 88.1%; NPV, 81.8%.
Figure 2.

ROC curve assessing the ability of FEV1/FVC ratio to discriminate patients with severe asthma without airway wall changes from those with airway wall changes. The area under the ROC curve was 0.67 (95% CI, 0.58 to 0.76; p = 0.001).
Discussion
We report here the largest qualitative study of HRCT scan findings in patients with severe asthma. We found that BE and BWT were common and were present in 40% and 62% of cases, respectively, whereas HRCT scans were reported as normal in only 20% of cases. Importantly, our findings may be an overestimate of CT scan abnormalities as HRCT scanning was undertaken only in those subjects in which it was considered clinically indicated. The most common indication was a clinical suspicion of BE, but this had only a 74% sensitivity and a 45% specificity to identify subjects with BE on HRCT scans. Using logistic regression, we determined which clinical parameters were associated with CT scan abnormalities. FEV1/FVC ratio was the strongest predictor for airway wall changes but was inadequate to effectively discriminate between patients with normal airways and those with BE and/or BWT. Our findings therefore support the view that CT scanning is an important investigation in the management of severe asthma, but to define fully the prevalence of CT scan abnormalities, CT scanning will need to be undertaken in all patients.
Our cohort exceeds the combined population of patients with severe asthma who were studied in previous qualitative studies.5,6,10–12,21–24 Using qualitative HRCT scan analysis, we have demonstrated that there is a high prevalence of BE and BWT in the population of patients with severe asthma. Several other authors11,12,21–25 have investigated the prevalence of BE and BWT on HRCT scan analysis of asthmatic populations. The prevalence of BE reported in asthmatic patients varies from 9% to 77%5,6,10–12,21–24 with a median of 31%, which was similar to the 40% found in our study. The wide variation in the reported prevalence of bronchiectasis is likely to be due to differences in the patient population, scanning technique, and definition of BE. The prevalence of BE reported in COPD patients6,26–28 was similar to that in asthmatic patients (range, 20% to 50%; median, 38%). There was much lower prevalence of BE in healthy asymptomatic subjects, with a range from 0% to 20%21–23,29,30 and a median of 12.5%. We found that BE, irrespective of the presence or absence of BWT, is associated with longer disease duration and poorer lung function. However, the view that BE is related to disease severity is contentious and is supported by some previous reports,10,31 but not others.21,23 It remains unclear whether BE in patients with severe asthma is a comorbidity, making the asthma “difficult” to manage, or whether it represents structural change or remodeling with natural progression of the disease.23 Longitudinal studies are required to determine whether BE is a consequence or a cause of severe asthma.
BWT was present in 62% of our severe asthma cohort, which is consistent with previous findings.6,10,24 The reported prevalence of BWT has varied between 16% and 92%,5,6,10–12,21,22,24 and this can be attributed to differences in patient population, HRCT scan window settings, and, perhaps most importantly, the lack of an objective definition of BWT. We did not find any significant difference in the prevalence of BWT between smoking and nonsmoking patients or between patients with or without FAO. Similarly, Laurent et al24 found that BWT was more frequent in asthmatic patients irrespective of smoking status when compared with healthy control subjects who smoked and did not smoke. The association of BE but not BWT with significant smoking history and FAO may represent and alteration in the remodeling process in patients with more severe and progressive disease. Emphysema was present in 8% of patients with severe asthma, which is consistent with earlier reports,6,11,12,21 and, as expected, its prevalence was higher in smokers and ex-smokers compared with nonsmokers. Interestingly, the prevalence of emphysema in smokers was 27% in a group of Italian smokers who underwent HRCT scans as part of a lung cancer screening program32 and was >50% in a study of Japanese smokers.33 The prevalence of emphysema in our patients with severe asthma who had significant smoking histories is therefore perhaps lower than predicted. Whether patients with severe asthma have an altered risk of the development of emphysema in response to smoking warrants further study.
Current difficult/refractory asthma guidelines34–37 highlight HRCT scanning as a tool for disease evaluation, but there are no well-defined criteria for HRCT scan evaluation for this disease group. The detection of bronchial wall changes, in particular BE, is important in patients with severe asthma as this may impact the management strategy. Therefore, the identification of clinical features related to HRCT scan abnormalities may provide an opportunity to appropriately target the application of HRCT scanning in patients with severe asthma. We found that the subjects who underwent HRCT scanning were older, had more severe disease in terms of treatment requirements, and had more neutrophilic inflammation. These features are likely to have influenced our clinical suspicion of BE and therefore precipitated an HRCT scan request. However, clinical suspicion of BE had a relatively poor specificity and sensitivity to identify BE defined by HRCT scanning. In keeping with earlier reports,38,39 logistic regression analysis in our study revealed disease duration and, in particular, FEV1/FVC ratio as important predictors of BWT and BE. We therefore analyzed the performance of airflow obstruction to predict these HRCT scan changes. However, FEV1/FVC ratio could not effectively discriminate between patients with severe asthma who did or did not have airway wall changes. This suggests that without a CT scan it would be impossible to predict the presence or absence of airway wall changes in this group of patients indicating that CT scan evaluation of all patients with severe asthma is probably required.
One limitation of our study is its cross-sectional design. We therefore do not have any longitudinal data to establish whether BE observed on HRCT scans in patients in the severe asthma group is progressive with disease state or is responsive to treatment. However, serial HRCT scans among asthmatic patients in a longitudinal study involving a small number of patients suggest that these changes are persistent23 and do not respond to oral steroids.11 Future studies need to further assess the relationship between airway structural changes identified by CT scan and clinical features of disease such as the frequency of exacerbations over time. Another limitation of our study is the use of qualitative methods to describe changes in BE and BWT. We used well-recognized criteria for the identification of BE. However, there is a lack of standardization for the assessment of BWT, and this was determined subjectively by an experienced radiologist. Standard HRCT scans obtained for this study are limited due to their acquisition protocol (sequential scanning with 1-mm collimation at 10-mm increments) in tracking the airways from its origin to its division. Therefore, the number of airways assessed and the ratio of abnormal to normal airways could not be determined. Despite these potential shortcomings, we are confident that our findings are robust as all the scans were reported by blinded thoracic radiologists who were unaware of patient involvement in the study and interobserver agreement was substantial. The quantitative assessment of airway wall geometry is widely used as a research tool,40,41 but its application using HRCT scans, with images at 10-mm increments, is limited due to incompatibility with most current software analysis platforms. To date, quantitative thoracic CT scanning has not been validated for clinical use, and further studies are required to determine the role of quantitative CT scan analysis in patients with airways disease.
In conclusion, we have demonstrated that bronchial structural changes, particularly BE, are prevalent in the population of patients with severe asthma. Nonradiologic assessments fail to reliably predict these airway structural changes. CT scan acquisition in all patients with severe asthma to detect BE may therefore help to alter management strategies and improve treatment outcomes.
Acknowledgments
Author contributions: Drs. Gupta, Siddiqui, Green, and Brightling contributed to the study concept and design. Dr. Gupta contributed to the acquisition of data. Drs. Gupta, Siddiqui, Haldar, Raj, Entwisle, and Brightling contributed to the analysis and interpretation of the data. Drs. Gupta, Entwisle, and Brightling contributed to the drafting of the article. Drs. Entwisle, Wardlaw, Bradding, Pavord, Brightling contributed to the critical revision of the article for important intellectual content. Drs. Gupta and Brightling contributed to the statistical analysis. Dr. Brightling obtained the funding.
Financial/nonfinancial disclosures: Dr. Brightling serves as a consultant to AstraZeneca, GlaxoSmithKline, Medimmune, and Roche. He has been sponsored by AstraZeneca, GlaxoSmithKline, and Pfizer for speaking at conferences. He has received research grants from AstraZeneca, Medimmune, and GlaxoSmithKline. He has also received in kind benefits from AstraZeneca, GlaxoSmithKline, Novartis, and Boehringer Ingelheim in the form of sponsorships to attend international meetings. Dr. Pavord has received grant support for a study of severe asthma from GlaxoSmithKline and a speaker fee from GlaxoSmithKline and AstraZeneca. Drs. Gupta, Siddiqui, Haldar, Raj, Entwisle, Wardlaw, Bradding, and Green have reported to the ACCP that no significant conflicts of interest exist with any companies/organizations whose products or services may be discussed in this article.
Abbreviations:
- ABPA
allergic bronchopulmonary aspergillosis
- BE
bronchiectasis
- BWT
bronchial wall thickening
- DAC
Difficult Asthma Clinic
- FAO
fixed airflow obstruction
- HRCT
high-resolution CT
- IQR
interquartile range
- NPV
negative predictive value
- PPV
positive predictive value
- ROC
receiver operating characteristic
Footnotes
This work was performed at Glenfield Hospital, Leicester, UK.
Reproduction of this article is prohibited without written permission from the American College of Chest Physicians (www.chestjournal.org/site/misc/reprints.xhtml).
References
- 1.Bousquet J, Clark TJH, Hurd S, et al. GINA guidelines on asthma and beyond. Allergy. 2007;62:102–112. doi: 10.1111/j.1398-9995.2006.01305.x. [DOI] [PubMed] [Google Scholar]
- 2.Wenzel S. Severe asthma in adults. Am J Respir Crit Care Med. 2005;172:149–160. doi: 10.1164/rccm.200409-1181PP. [DOI] [PubMed] [Google Scholar]
- 3.Antonicelli L, Bucca C, Neri M, et al. Asthma severity and medical resource utilisation. Eur Respir J. 2004;23:723–729. doi: 10.1183/09031936.04.00004904. [DOI] [PubMed] [Google Scholar]
- 4.Niimi A, Matsumoto H, Takemura M, et al. Clinical assessment of airway remodeling in asthma: utility of computed tomography. Clin Rev Allergy Immunol. 2004;27:45–58. doi: 10.1385/CRIAI:27:1:045. [DOI] [PubMed] [Google Scholar]
- 5.Yilmaz S, Ekici A, Ekici M, et al. High-resolution computed tomography findings in elderly patients with asthma. Eur J Radiol. 2006;59:238–243. doi: 10.1016/j.ejrad.2006.03.004. [DOI] [PubMed] [Google Scholar]
- 6.Harmanci E, Kebapci M, Metintas M, et al. High-resolution computed tomography findings are correlated with disease severity in asthma. Respiration. 2002;69:420–426. doi: 10.1159/000064018. [DOI] [PubMed] [Google Scholar]
- 7.Little SA, Sproule MW, Cowan MD, et al. High resolution computed tomographic assessment of airway wall thickness in chronic asthma: reproducibility and relationship with lung function and severity. Thorax. 2002;57:247–253. doi: 10.1136/thorax.57.3.247. [DOI] [PMC free article] [PubMed] [Google Scholar]
- 8.Park JW, Hong YK, Kim CW, et al. High-resolution computed tomography in patients with bronchial asthma: correlation with clinical features, pulmonary functions and bronchial hyperresponsiveness. J Investig Allergol Clin Immunol. 1997;7:186–192. [PubMed] [Google Scholar]
- 9.Webb WR. High-resolution computed-tomography of obstructive lung-disease. Radiol Clin North Am. 1994;32:745–757. [PubMed] [Google Scholar]
- 10.Paganin F, Seneterre E, Chanez P, et al. Computed tomography of the lungs in asthma: influence of disease severity and etiology. Am J Respir Crit Care Med. 1996;153:110–114. doi: 10.1164/ajrccm.153.1.8542102. [DOI] [PubMed] [Google Scholar]
- 11.Paganin F, Trussard V, Seneterre E, et al. Chest radiography and high-resolution computed-tomography of the lungs in asthma. Am Rev Respir Dis. 1992;146:1084–1087. doi: 10.1164/ajrccm/146.4.1084. [DOI] [PubMed] [Google Scholar]
- 12.Lynch DA, Newell JD, Tschomper BA, et al. Uncomplicated asthma in adults: comparison of CT appearance of the lungs in asthmatic and healthy-subjects. Radiology. 1993;188:829–833. doi: 10.1148/radiology.188.3.8351357. [DOI] [PubMed] [Google Scholar]
- 13.Pavord ID, Pizzichini MMM, Pizzichini E, et al. The use of induced sputum to investigate airway inflammation. Thorax. 1997;52:498–501. doi: 10.1136/thx.52.6.498. [DOI] [PMC free article] [PubMed] [Google Scholar]
- 14.Bankier AA, Fleischmann D, Mallek R, et al. Bronchial wall thickness: appropriate window settings for thin-section CT and radiologic-anatomic correlation. Radiology. 1996;199:831–836. doi: 10.1148/radiology.199.3.8638013. [DOI] [PubMed] [Google Scholar]
- 15.Hansell DM, Bankier AA, MacMahon H, et al. Fleischner Society: glossary of terms for thoracic imaging. Radiology. 2008;246:697–722. doi: 10.1148/radiol.2462070712. [DOI] [PubMed] [Google Scholar]
- 16.Landis JR, Koch GG. The measurement of observer agreement for categorical data. Biometrics. 1977;33:159–174. [PubMed] [Google Scholar]
- 17.Kundel HL, Polansky M. Measurement of observer agreement. Radiology. 2003;228:303–308. doi: 10.1148/radiol.2282011860. [DOI] [PubMed] [Google Scholar]
- 18.Moss M, Wellman DA, Cotsonis GA. An appraisal of multivariable logistic models in the pulmonary and critical care literature. Chest. 2003;123:923–928. doi: 10.1378/chest.123.3.923. [DOI] [PubMed] [Google Scholar]
- 19.Peng CYJ, Lee KL, Ingersoll GM. An introduction to logistic regression analysis and reporting. J Educ Res. 2002;96:3–14. [Google Scholar]
- 20.Greenberger PA. Allergic bronchopulmonary aspergillosis. J Allergy Clin Immunol. 2002;110:685–692. doi: 10.1067/mai.2002.130179. [DOI] [PubMed] [Google Scholar]
- 21.Grenier P, Mourey-Gerosa I, Benali K, et al. Abnormalities of the airways and lung parenchyma in asthmatics: CT observations in 50 patients and inter- and intraobserver variability. Eur Radiol. 1996;6:199–206. doi: 10.1007/BF00181147. [DOI] [PubMed] [Google Scholar]
- 22.Park CS, Muller NL, Worthy SA, et al. Airway obstruction in asthmatic and healthy individuals: inspiratory and expiratory thin-section CT findings. Radiology. 1997;203:361–367. doi: 10.1148/radiology.203.2.9114089. [DOI] [PubMed] [Google Scholar]
- 23.Takemura M, Niimi A, Minakuchi M, et al. Bronchial dilatation in asthma: relation to clinical and sputum indices. Chest. 2004;125:1352–1358. doi: 10.1378/chest.125.4.1352. [DOI] [PubMed] [Google Scholar]
- 24.Laurent F, Latrabe V, Raherison C, et al. Functional significance of air trapping detected in moderate asthma. Eur Radiol. 2000;10:1404–1410. doi: 10.1007/s003300000504. [DOI] [PubMed] [Google Scholar]
- 25.Carroll N, Elliot J, Morton A, et al. The structure of large and small airways in nonfatal and fatal asthma. Am Rev Respir Dis. 1993;147:405–410. doi: 10.1164/ajrccm/147.2.405. [DOI] [PubMed] [Google Scholar]
- 26.Patel IS, Vlahos I, Wilkinson TMA, et al. Bronchiectasis, exacerbation indices, and inflammation in chronic obstructive pulmonary disease. Am J Respir Crit Care Med. 2004;170:400–407. doi: 10.1164/rccm.200305-648OC. [DOI] [PubMed] [Google Scholar]
- 27.O'Brien C, Guest PJ, Hill SL, et al. Physiological and radiological characterisation of patients diagnosed with chronic obstructive pulmonary disease in primary care. Thorax. 2000;55:635–642. doi: 10.1136/thorax.55.8.635. [DOI] [PMC free article] [PubMed] [Google Scholar]
- 28.Gompertz S, Bayley DL, Hill SL, et al. Relationship between airway inflammation and the frequency of exacerbations in patients with smoking related COPD. Thorax. 2001;56:36–41. doi: 10.1136/thorax.56.1.36. [DOI] [PMC free article] [PubMed] [Google Scholar]
- 29.Matsuoka S, Uchiyama K, Shima H, et al. Bronchoarterial ratio and bronchial wall thickness on high-resolution CT in asymptomatic subjects: correlation with age and smoking. AJR Am J Roentgenol. 2003;180:513–518. doi: 10.2214/ajr.180.2.1800513. [DOI] [PubMed] [Google Scholar]
- 30.Kim JS, Muller NL, Park CS, et al. Bronchoarterial ratio on thin section CT: comparison between high altitude and sea level. J Comput Assist Tomogr. 1997;21:306–311. doi: 10.1097/00004728-199703000-00028. [DOI] [PubMed] [Google Scholar]
- 31.Oguzulgen IK, Kervan F, Ozis T, et al. The impact of bronchiectasis in clinical presentation of asthma. South Med J. 2007;100:468–471. doi: 10.1097/SMJ.0b013e31802fa16f. [DOI] [PubMed] [Google Scholar]
- 32.Camiciottoli G, Cavigli E, Grassi L, et al. Prevalence and correlates of pulmonary emphysema in smokers and former smokers: a densitometric study of participants in the ITALUNG trial. Eur Radiol. 2009;19:58–66. doi: 10.1007/s00330-008-1131-6. [DOI] [PubMed] [Google Scholar]
- 33.Satoh K, Kobayashi T, Misao T, et al. CT assessment of subtypes of pulmonary emphysema in smokers. Chest. 2001;120:725–729. doi: 10.1378/chest.120.3.725. [DOI] [PubMed] [Google Scholar]
- 34.American Thoracic Society. Proceedings of the ATS workshop on refractory asthma: current understanding, recommendations, and unanswered questions. Am J Respir Crit Care Med. 2000;162:2341–2351. doi: 10.1164/ajrccm.162.6.ats9-00. [DOI] [PubMed] [Google Scholar]
- 35.Bateman ED, Hurd SS, Barnes PJ, et al. Global strategy for asthma management and prevention: GINA executive summary. Eur Respir J. 2008;31:143–178. doi: 10.1183/09031936.00138707. [DOI] [PubMed] [Google Scholar]
- 36.Chung KF, Godard P, Adelroth E, et al. Difficult/therapy-resistant asthma: the need for an integrated approach to define clinical phenotypes, evaluate risk factors, understand pathophysiology and find novel therapies. Eur Respir J. 1999;13:1198–1208. doi: 10.1034/j.1399-3003.1999.13e43.x. [DOI] [PubMed] [Google Scholar]
- 37.British Thoracic Society. British guideline on the management of asthma: a national clinical guideline. Thorax. 2008;63(suppl):1–121. doi: 10.1136/thx.2008.097741. [DOI] [PubMed] [Google Scholar]
- 38.Lynch DA, Newell J, Hale V, et al. Correlation of CT findings with clinical evaluations in 261 patients with symptomatic bronchiectasis. AJR Am J Roentgenol. 1999;173:53–58. doi: 10.2214/ajr.173.1.10397099. [DOI] [PubMed] [Google Scholar]
- 39.Wongyoucheong JJ, Leahy BC, Taylor PM, et al. Airways obstruction and bronchiectasis: correlation with duration of symptoms and extent of bronchiectasis on computed-tomography. Clin Radiol. 1992;45:256–259. doi: 10.1016/s0009-9260(05)80010-8. [DOI] [PubMed] [Google Scholar]
- 40.Nakano Y, Muro S, Sakai H, et al. Computed tomographic measurements of airway dimensions and emphysema in smokers: correlation with lung function. Am J Respir Crit Care Med. 2000;162:1102–1108. doi: 10.1164/ajrccm.162.3.9907120. [DOI] [PubMed] [Google Scholar]
- 41.Niimi A, Matsumoto H, Amitani R, et al. Airway wall thickness in asthma assessed by computed tomography: relation to clinical indices. Am J Respir Crit Care Med. 2000;162:1518–1523. doi: 10.1164/ajrccm.162.4.9909044. [DOI] [PubMed] [Google Scholar]