Abstract
The loss behavior of 0.62Pb(Mg1∕3Nb2∕3)O3–0.38PbTiO3 (PMN-38%PT) ferroelectric single crystal poled along [001]c was investigated. It was found that the complex electromechanical coefficients and loss factors change dramatically at the coercive field Ec around 250 V∕mm, representing the intrinsic switching barrier. Since the energy loss is related to the domain wall motion, the imaginary parts of the electromechanical coefficients can be used to study the degree of domain wall motions in relaxor-based ferroelectric single crystals. Experimental results indicate that for this system, domain wall motion contributes significantly to the imaginary parts of electromechanical coefficients. In addition, [001]c poled PMN-38%PT single crystals have much larger mechanical loss factor compared to that of conventional single crystal like LiNbO3. This phenomenon is proved to be closely related to 90° domain wall motion in this crystal system.
INTRODUCTION
Relaxor-based ferroelectric single crystals (1−x)Pb(Mg1∕3Nb2∕3)O3–xPbTiO3 (PMN-xPT) have generated much interest due to their extremely high piezoelectric and electromechanical coupling coefficient. In [001]c-poled PMN-xPT single crystals at the morphotropic phase boundary (MPB), strain level up to 1.2% at field levels of ∼30 kV∕cm was reported, and longitudinal piezoelectric d33 and electromechanical coupling k33 coefficients could reach 2800 pC∕N and 0.94, respectively.1, 2 In addition to the high electromechanical properties, the crystals exhibit high electric quality factor QE, while low mechanical quality factor QM.
The origin of giant piezoelectricity observed in this crystal system was suggested as due to domain switching in the field induced phase transition from the rhombohedral phase to the tetragonal phase.3, 4 Some experimental methods have been used for studying the relationship between material properties and domain switching, such as: the measurements of ferroelectric hysteresis loop,5 transient reversal current,6 permittivity versus E-field and domain observation using optical microscopy.7, 8 Each method reveals a particular aspect of the domain switching process. From experimental results, it could be deduced that the real parts of the electromechanical coefficients for some ferroelectric materials increase with the remnant polarization until the crystal reaches saturation. However, the relationship between the loss properties of material and the degree of domain switching is still not completely understood, which is strongly related to domain wall activities.9
For studying the loss behavior of relaxor-based ferroelectric single crystal PMN-xPT in the poling process, the single crystal Pb(Mg1∕3Nb2∕3)O3–38%PbTiO3 (PMN-38%PT) was used in our experiment. Although this crystal exhibits a much smaller piezoelectric constant d33 than PMN-33%PT, it is a better candidate for studying the loss mechanism and domain switching phenomena since it is tetragonal at room temperature, and domains in this system can be easily manipulated by applying an electric field in different directions.10, 11 In this work, the complex electromechanical coefficients and loss factors of the PMN-38%PT crystal are measured during the poling process, and the correlation between the loss property and domain switching was discussed based on the measured results.
MEASUREMENT METHOD
The imaginary parts of electromechanical coefficients are always used to reflect the loss properties of the crystal, which can be calculated by several methods.12, 13, 14, 15 On the other hand, the energy consumed is closely related to domain wall motion, so the imaginary parts of the electromechanical coefficients can be influenced by the domain wall motion.16, 17 Following the convention, the complex coefficients d∗, sE∗, and εT∗ can be defined as18
| (1) |
| (2) |
| (3) |
where θ is the phase delay of the strain under an applied electric field or the phase delay of the electric displacement under an applied stress. δ is the phase delay of the electric displacement to an applied electric field under a constant stress condition and φ is the phase delay of the strain to an applied stress under a constant electric field condition.
From the equivalent circuit theory of piezoelectric material, the admittance spectrum near the resonance can be expressed in terms of material constants. For a k31 vibrator the admittance is given by
| (4a) |
| (4b) |
| (4c) |
where l, w, and t are the length, width, and thickness of the bar, respectively, ω is the angular frequency, C is the capacitance, ρ is the mass density of the sample, k31 is the electromechanical coupling factor, is the elastic compliance under constant electric field, is the permittivity under constant stress, and d31 is the piezoelectric strain coefficient. For convenience, we normalized admittance Y(ω) by ω so that Eq. 4a becomes
| (5a) |
where is the complex electromechanical coupling coefficient and Λ31 is the inverse of the phase velocity, defined as
| (5b) |
It is understood that the electromechanical coefficients are complex numbers, so the tangent function in Eq. 5a can be written as
| (6) |
With the aid of Eq. 6, we can rewrite Eq. 5a to give
| (7) |
| (8) |
Following the IEEE standard,12
| (9) |
where fG max is the frequency at which the normalized conductance Gω reaches maximum. Solving Eq. 7, qm can be determined by the following equation:14
| (10) |
where fBω max and fBω min are frequencies corresponding to the maximum and minimum of normalized susceptance Bω(ω). The imaginary part of Λ31 can be calculated by
| (11) |
From the value of Λ31, the complex elastic compliance can be determined by Eq. 5b. In the experiment, we obtained the complex dielectric coefficient at 1 kHz using an Agilent 4294A Precision Impedance Analyzer. Then, the measured and are put into Eq. 5a at ω=2πfG max to obtain a complex electromechanical coupling coefficient .15 Then we can obtain the complex piezoelectric strain constant from the following equation:
| (12) |
The above described method is used to determine the complex coefficients of PMN-38%PT crystal at room temperature.
EXPERIMENTAL PROCEDURE
Single crystal PMN-38%PT used in this work was grown by the modified Bridgman technique and the orientation was done using a Laue x-ray machine with an accuracy of ±0.5°. The sample was cut and polished into a rectangular parallelepiped with three pairs of parallel surfaces along [100], [010], and [001], respectively. Gold electrodes were sputtered onto the [001] and faces. The final dimensions of the sample used for the experiment were 9.92×1.63×0.45 mm3.
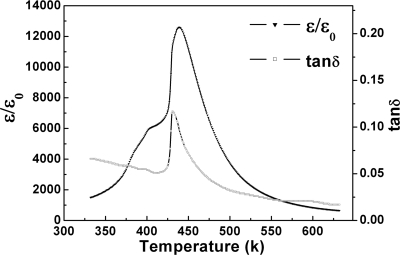
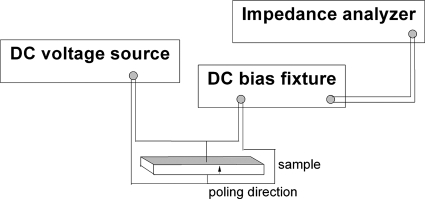
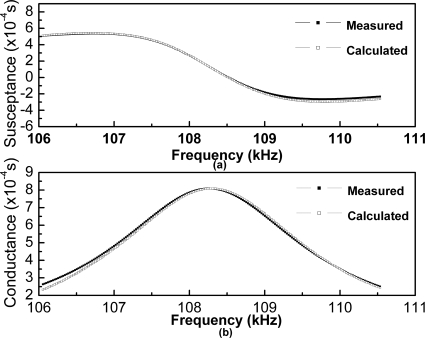
An Agilent E4980A LCR Meter is used together with a temperature controlled oven to measure the temperature dependence of dielectric coefficient and electric loss factor tan δ of a [001] oriented PMN-38%PT crystal at 1 MHz with a heating rate of 2 K∕min. The experimental results are shown in Fig. 1. The Agilent 4294A Precision Impedance Analyzer and Agilent 16065A Ext voltage Bias Fixture were used to measure the admittance spectra at a desired value. The experiment setup for the measurement of admittance spectrum is schematically shown in Fig. 2. In the experiment, the crystal was poled stepwise with increasing electric field from 0 to 400 V∕mm and this measurement process took about 5 h to complete in order to achieve a quasistatic condition. Based on the measured frequency spectrum near the resonance, we could obtain the complex electromechanical coefficients using the procedure described in Sec. 2 and Eqs. 1, 2, 3. The calculated curve and measured curve are shown in Fig. 3 and the calculated curve agrees well with the measured one.
Figure 1.
Temperature dependence of complex dielectric constant measured at 1 MHz.
Figure 2.
Schematic setup for measurement.
Figure 3.
Comparison of calculated admittance with experimental data of PMN-38%PT crystal poled at 250 V∕mm, (a) susceptance and (b) conductance.
RESULT AND DISCUSSION
Phase transition induced by electric field
There are some literatures about the dissipation factors’ dependence on temperature in piezoelectric ceramics caused by domain wall motion,17 while the contribution of the domain wall motion to loss mechanism is still not well understood in the poling process. In this paper, the complex electromechanical coefficients were measured during the poling process, and the domain wall motion contributions to the loss property of the crystal were studied.
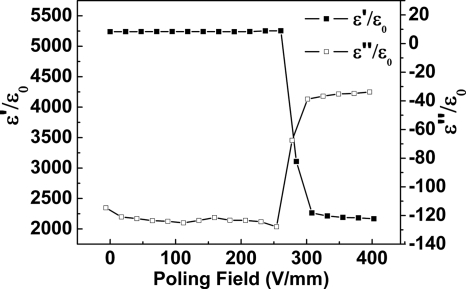
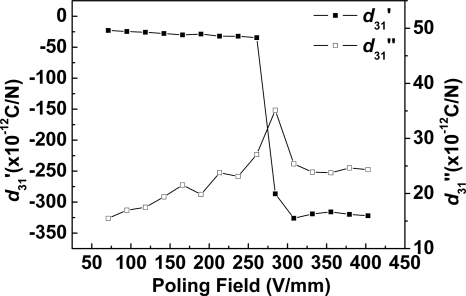
Figures 456 show the complex electromechanical coefficients of the PMN-38%PT single crystal at different degree of poling obtained from a length extensional k31 bar. Figure 4 show the complex dielectric coefficient versus poling field measured using the impedance analyzer and dc bias fixture. In the experiment, the real part of the dielectric coefficient decreases from 5250 to 2250, while the imaginary part ε″ changes from −110 to −30 after the sample was poled into saturation.
Figure 4.
Measured complex dielectric coefficient of PMN-38%PT vs the poling field level at room temperature.
Figure 5.
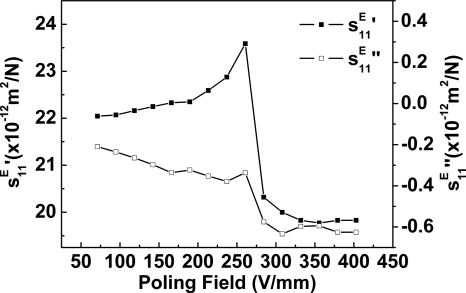
Measured complex elastic compliance of PMN-38%PT vs poling field level at room temperature.
Figure 6.
Measured complex piezoelectric coefficient of PMN-38%PT vs poling field level at room temperature.
Because the domain switching often produces much larger dielectric response, the dielectric coefficient of the unpoled tetragonal multidomain PMN-38%PT single crystal is rather high.4, 11 The dielectric value show little change until the poling field increases to the coercive field Ec around 250 V∕mm, which reflects the switching energy barrier.11 Further increase of the field level will cause the real part of dielectric coefficient to decrease drastically, implying that the domains are switched quickly under higher field, as shown in the Fig. 4.
Figures 56 show the relationship between the elastic compliance, piezoelectric coefficient and the poling field. When the poling field is less than 60 V∕mm, almost no resonance peak was found, which means that no other domains were switched under such a low field level. When the poling field level reaches 60 V∕mm, the resonance peaks started to appear in the admittance spectra, indicating that domains start to be switched to the field direction. For the real part of piezoelectric coefficient, a drastic change was found at Ec, which is similar to that of dielectric coefficient. The peak of the imaginary part can be found at a critical field 280 V∕mm, which indicates that the coupling loss due to the domain wall motion reaches maximum at this field level.16 The real part of the elastic compliance increases with the poling field and gradually reaches a maximum value 23.7×10⁻¹² m2∕N at Ec, indicating that the material becomes softer since the switching of domains also can be viewed as a first order “phase transition.”
The contribution of domain wall to loss factor
To delineate the loss behavior in the poling process, the role of domains in the single crystal must be considered. There are two types of domains in tetragonal ferroelectric crystal: the 180° ferroelectric domain and 90° ferroelectric domain. The strain tensors are the same on the two sides of a 180° domain wall, so that 180° domain wall movements generally contribute only to the electric loss.19 The 90° domain walls refer to walls between variants which differ in both polarization vector and strain tensor. Both 180° and 90° domain walls generally form to reduce the effects of depolarization fields, whereas only 90° domain walls may minimize the elastic energy. Thus, the electric loss is originated from both 180° and 90° domain wall motions, depending on the direction of the poling field, but the mechanical loss is caused only by 90° domain wall motions. The developing of internal stress due to an electric field is observed experimentally two decades ago.19, 20
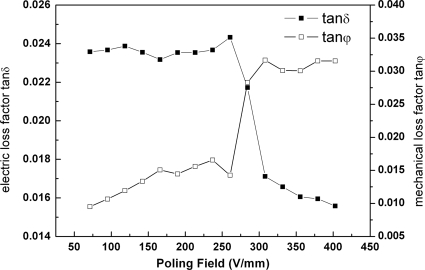
For PMN-38%PT with tetragonal perovskite structure, the relationship between the mechanical loss factor, electric loss factor and the poling field are shown in Figs. 7. When the poling field level increases, a drastic change of the loss factors can be found at Ec, which is similar to that of the real parts of complex electromechanical coefficients. The electric loss factor decrease from 2.2% to 1.5%, while the mechanical loss factor increases with the poling field and gradually reaches a maximum value 3.17% at about 400 V∕mm due to 90° domain wall motion, which is related to internal stress due to domain switching induced by poling field. From the results of experiment, the mechanical and electric loss behavior of PMN-38%PT were found to be dependent on the domain configurations, and originated from 180° and 90° domain wall motions.
Figure 7.
Measured electric loss factor and mechanical loss factor of PMN-38%PT vs poling field level at room temperature.
CONCLUSIONS
The imaginary parts of the electromechanical coefficients are the representations of the energy losses in piezoelectric materials, and very important in many applications where losses cannot be ignored. Because the energy loss is closely related to the domain wall motion in the poling process, the imaginary parts of the electromechanical coefficients may be used to indicate the degree of domain wall motions in the material. In this work, the complex electromechanical coefficients and loss factors of the PMN-38%PT single crystal are measured during poling process. It is found that an elastic phase transition happens at Ec where domains are switched to the direction of poling field very quickly and the mechanical loss increases dramatically. Our results indicate that the loss behavior of this crystal is dependent on the domain configuration, and the dielectric and mechanical losses are originated from different domain wall motions. In PMN-xPT, various field induced phase transition can occur at relatively low fields, depending upon chemical composition and field orientation.
ACKNOWLEDGMENTS
This research was supported in part by the NSFC under Grant Nos. 50602009 and 50972034, Program of the Ministry of Education of China for New Century Excellent Talents in University under Grant No. NCET-06-0345, Postdoctoral Science Research Developmental Foundation of Heilongjiang Province under Grant No. LBH-Q06068, SRF for ROCS, SEM, and NIH under Grant No. P41-EB21820.
References
- Park S. E. and Shrout T. R., J. Appl. Phys. 82, 1804 (1997). 10.1063/1.365983 [DOI] [Google Scholar]
- Zhang R., Jiang B., and Cao W., J. Appl. Phys. 90, 3471 (2001). 10.1063/1.1390494 [DOI] [Google Scholar]
- Bellaiche L., Garcia A., and Vanderbilt D., Phys. Rev. Lett. 84, 5427 (2000). 10.1103/PhysRevLett.84.5427 [DOI] [PubMed] [Google Scholar]
- Fu H. and Cohen R. E., Nature (London) 403, 281 (2001). [DOI] [PubMed] [Google Scholar]
- Viehland D. and Chen Y. H., J. Appl. Phys. 88, 6696 (2000). 10.1063/1.1325001 [DOI] [Google Scholar]
- Lente M. H. and Eiras J. A., J. Appl. Phys. 89, 5093 (2001). 10.1063/1.1333742 [DOI] [Google Scholar]
- Viehland D. and Li F., J. Appl. Phys. 92, 7690 (2002). 10.1063/1.1524016 [DOI] [Google Scholar]
- Tu C. S. and Shih I. C., Appl. Phys. Lett. 83, 1833 (2003). 10.1063/1.1602558 [DOI] [Google Scholar]
- Herbiet R., Robels U., Dederichs H., and Arlt G., Ferroelectrics 98, 107 (1989). 10.1080/00150198908217575 [DOI] [Google Scholar]
- Shaoping L., Cao W., Newnham R. E., and Cross L. E., Ferroelectrics 139, 25 (1993). 10.1080/00150199308017725 [DOI] [Google Scholar]
- Yin J. H. and Cao W., Appl. Phys. Lett. 80, 1043 (2002). 10.1063/1.1448385 [DOI] [Google Scholar]
- ANSI/IEEE Std 176–1987, IEEE Standard on Piezoelectricity.
- Sherrit S., Wiederick H. D., Mukherjee B. K., and Prasad S. E., Ferroelectrics 134, 65 (1992). 10.1080/00150199208015566 [DOI] [Google Scholar]
- Du X. H., Wang Q. M., and Uchino K., IEEE Trans. Ultrason. Ferroelectr. Freq. Control 50, 312 (2003). 10.1109/TUFFC.2003.1193625 [DOI] [PubMed] [Google Scholar]
- Smits J. G., IEEE Trans. Sonics Ultrason. 23, 393 (1976). [Google Scholar]
- Robels U., Herbiet R., and Arlt G., Ferroelectrics 93, 95 (1989). 10.1080/00150198908017329 [DOI] [Google Scholar]
- Gerthsen P., Hardtl K. H., and Schmidt N. A., J. Appl. Phys. 51, 1131 (1980). 10.1063/1.327722 [DOI] [Google Scholar]
- Uchino K. and Hirose S., IEEE Trans. Ultrason. Ferroelectr. Freq. Control 48, 307 (2001). 10.1109/58.896144 [DOI] [PubMed] [Google Scholar]
- Kamel T. M. and de With G., J. Appl. Phys. 102, 044118 (2007). 10.1063/1.2767188 [DOI] [Google Scholar]
- Li S., Bhalla S., Newnham R. E., Cross L. E., and Huang C., J. Mater. Sci. 29, 1290 (1994). 10.1007/BF00975077 [DOI] [Google Scholar]


