Abstract
Purpose: To develop a population-based model of surface segmentation uncertainties for uncertainty-weighted surface-based deformable registrations.
Methods: The contours of the prostate, the bladder, and the rectum were manually delineated by five observers on fan beam CT images of four prostate cancer patients. First, patient-specific representations of structure segmentation uncertainties were derived by determining the interobserver variability (i.e., standard deviation) of the structure boundary delineation. This was achieved by (1) generating an average structure surface mesh from the structure contours drawn by different observers, and (2) calculating three-dimensional standard deviation surface meshes (SDSMs) based on the perpendicular distances from the individual boundary surface meshes to the average surface mesh computed above. Then an average structure surface mesh was constructed to be the reference mesh for the population-based model. The average structure meshes of the other patients were deformably registered to the reference mesh. The calculated deformable vector fields were used to map the patient-specific SDSMs to the reference mesh to obtain the registered SDSMs. Finally, the population-based SDSM was derived by taking the average of the registered SDSMs in quadrature.
Results: Population-based structure surface statistical models of the prostate, the bladder, and the rectum were created by mapping the patient-specific SDSMs to the population surface model. Graphical visualization indicates that the boundary uncertainties are dependent on anatomical location.
Conclusions: The authors have developed and demonstrated a general method for objectively constructing surface maps of uncertainties derived from topologically complex structure boundary segmentations from multiple observers. The computed boundary uncertainties have significant spatial variations. They can be used as weighting factors for surface-based probabilistic deformable registration.
Keywords: segmentation uncertainty, surface-based registration, uncertainty model, population model, deformable registration
INTRODUCTION
Surface-based deformable image registration (DIR) algorithms compute the three-dimensional (3D) displacement vector field by matching corresponding structure surfaces that are delineated automatically or manually.1 The object boundary uncertainty introduced by observers is one of the major sources of the registration uncertainty. For example, in prostate cancer treatment, the boundary of a structure of interest (SOI) (e.g., bladder, prostate, or rectum) is delineated manually or semiautomatically by a physician on computed tomography (CT) images. Because of the poor soft tissue contrast for CT imaging, large uncertainties can exist on the structure boundaries, e.g., near the seminal vesicles and apex of the prostate.2 We hypothesize that surface delineation uncertainties will have a significant nonuniform distribution over the surface of a SOI that is dependent on anatomical location and that surface-based DIR will have errors that are spatially distributed in the same way as the surface uncertainties. We therefore propose to use models of surface uncertainty to weight the DIR cost function in such a way that regions of large uncertainty have reduced influence on the registration process. To enable this, we have developed a procedure to make population-based models of the surface uncertainty for each structure that will be used in deformable registration.
Remeijer et al.2 proposed to use polar maps for objectively quantifying uncertainties of structure boundaries that were delineated from multiple observers. However, their method requires the shape of the SOI to be approximately spherical or cylindrical. Topologically more complex structures such as the rectum cannot be parametrized correctly using this method. In this paper, we present a more general method that can be used to describe topologically more complex surfaces. This model can then be used to map the weighting factors to an individual CT for an uncertainty-weighted probabilistic deformable registration algorithm.
An important issue in the construction of a population-based surface segmentation uncertainty model is how to compute the population-averaged (root) structure surface. In recent years, extensive studies have been carried out in the context of the brain atlas construction. Guimond et al.3 used an iterative method of registration to obtain an atlas representing the average of the population. Lorenzen et al.4 improved this framework to cope with transformations including large deformations. Bhatia et al.5 found the unbiased average of the population by simultaneously registering all subjects in a population to a common reference frame. Others have relied on the selection of a reference image from the population that minimized the sum of distances6 or the bending energy.7 All these methods require deformable registration procedures. In this paper, we used a simple method to build the average population structure that does not require a deformable registration algorithm. The simplification can be justified by the following reasons. First, for our application, the accurate anatomical alignment is difficult. The images acquired using CT in this study have much lower soft tissue contrast compared to the brain images acquired using magnetic resonance imaging (MRI). The structure surfaces, especially for the prostate, do not have clearly defined anatomical features. In contrast, anatomical features, such as gray matter, white matter, lobes, and gyri, can be clearly identified in the MRI images of the brain. Second, accurate anatomical alignment is not required for our study. The average population surface is only used as the base surface map to carry the surface segmentation uncertainty information. The model will be used as the weighting factors to drive a probabilistic deformable registration. The location of the average surface is not as critical as those for brain atlases which are used for automated segmentation.
METHODS AND MATERIALS
Patient data
The fan beam computed tomography (FBCT) images of four prostate cancer patients undergoing primary external beam radiotherapy were used in this IRB-approved study. The tumors of the patients were all confined to the prostate and their clinical stages according to the TNM classification were as follows: T1cN0M0, two patients; T2aN0M0, one patient; and T3aN0M0, one patient.8 The FBCTs of the pelvis were acquired with continuous 1.5 mm slices on a 16 slice scanner with a 60 cm field of view (140 kV, 350 mA s, Brilliance Big Bore, Philips Medical Systems, The Netherlands). A 512×512 matrix size was used in the transverse plane. All imaging was performed without intravenous contrast. Patients were instructed to have a comfortably full bladder and to empty their bowels prior to imaging. No specific dietary measures were recommended.
Structure delineation
The prostate, bladder, and rectum were delineated independently by five medically experienced personnel using commercially available treatment planning software (PINNACLE version 8.1, Philips Medical Systems, Milpitas, CA). Contouring of FBCT images was performed independently without referring to other observers’ contours.
A detailed contouring protocol was used which instructed the observers on the anatomical position of the three structures in the pelvis. In particular, it included a description of the topographical anatomy of the prostate relative to bony anatomy and other soft tissue structures, e.g., the pelvic diaphragm and the penile bulb. Observers were instructed to use the default pelvis window settings for contouring (window width 50, window level 75). Observers were asked to include only the prostate itself without seminal vesicles, neurovascular bundles, venous plexus, or levator muscles. For the rectum, the upper border was uniformly defined as the lower edge of the sacro-iliacal joints and the lower border as the lower edge of the ischial tuberosities. The whole rectal wall was required to be included, but no sphincter muscles. All parts of the bladder wall were to be included. Observers were asked to include areas affected by partial volume effects.
Computation of the patient-specific average structure surface mesh
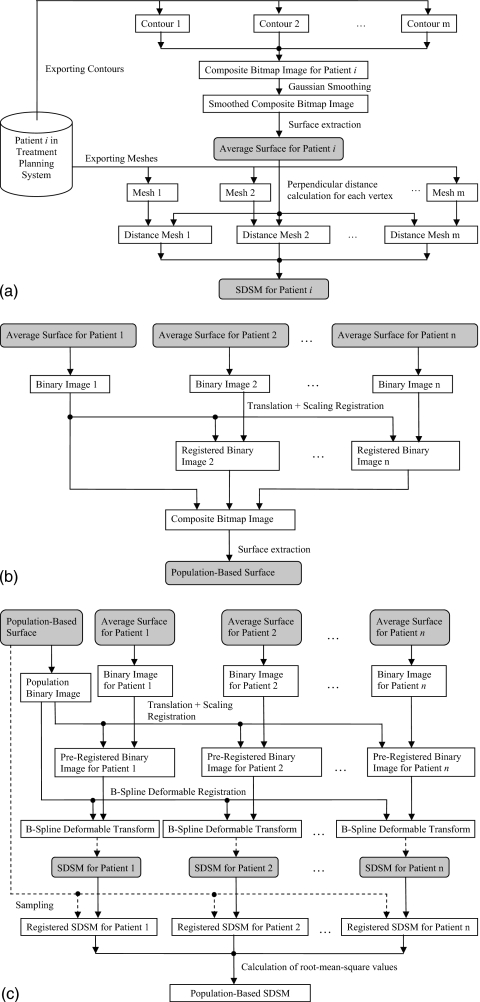
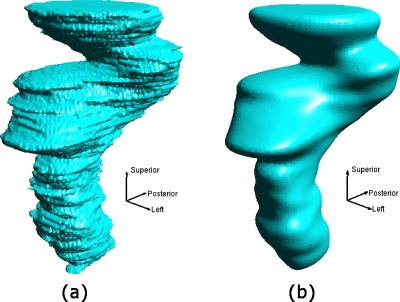
The sequence of procedures involved in this section is shown schematically in the top half of the Fig. 1a. To calculate the patient-specific average (i.e., average per patient) structure surface mesh, an isocoverage voting approach similar to that used by Deurloo et al.9 was adopted. First, a binary image that represented the coverage of the structure was generated from the contour for each segmented structure boundary surface. Any voxels inside the structure surface had the value 1 and any voxels outside had the value 0. Each voxel was a 1 mm3 cube. Then a composite image was created by adding the binary images that represent the same structure. The average boundary was determined by finding the 50% isosurface of the composite image using the marching tetrahedron algorithm.10 The output average surface from this algorithm was represented by a triangle surface mesh. Since the structure surfaces can be very irregular with sharp edges and spikes, a 3D Gaussian smoothing filter was applied to the composite image before running the marching tetrahedron algorithm. The effect of the smoothing filter is shown in Figs. 2a, 2b for a rectum surface with and without the Gaussian smoothing, respectively.
Figure 1.
Flowchart of the procedures involved in the calculation of the population-based SDSM. (a) Procedures for the calculation of a patient-specific SDSM. (b) Procedures for the calculation of the population-based surface. (c) Procedures involved in the calculation of the population-based SDSM.
Figure 2.
Patient-specific average surfaces that were extracted from the composite bitmap image (a) without and (b) with Gaussian smoothing.
Computation of the patient-specific structure boundary standard deviation surface meshes (SDSMs)
The patient-specific SDSM is a boundary surface mesh that carries the standard deviations (SDs) of the individual structure delineations from the patient-specific average surface. The calculation of the SDSM depends on the perpendicular distances from the patient-specific average surface to each individual surface. The SDSM was calculated by taking the following steps: (1) As shown in the bottom half of the Fig. 1a, the individual surface meshes were exported from the treatment planning system as triangle meshes. (2) The direction vectors, which are defined on each vertex on the average surface mesh, were calculated by taking the average of the normal vectors of the triangles that share the vertex. (3) For each direction vector on the average surface, the distances from the average surface (i.e., the base of the direction vector) to the intercept point with the individual surface were calculated. Note that the distance takes a negative value if the intercept point is located in the negative direction of the vector. (4) The SDs of these distances were computed and saved as vertex values of the patient-specific structure boundary SDSM.
Computation of the population-based root structure boundary surface
As shown in Fig. 1b, to create a population-based root structure boundary surface, the simple isocoverage voting approach as described in Sec. 2C was used. But before the calculation of the composite bitmap image, the structures from different patients had to be brought to a common frame, e.g., an affine transformation could be used. However, unlike the problem of atlas construction using brain images in neuroscience,3, 4, 5, 6, 7 the images of the structures in our study have very low contrast and they do not have well defined anatomical features (e.g., lobes, white matter, and gray matter for the brain). This makes it difficult to constrain a six-degree-of-freedom rigid registration. For example, the registration of the average surfaces between patient 1 and patient 2 (i.e., the first two images in column 6 in Fig. 3) could result in a rotation of nearly 90° along the axis perpendicular to the paper. To avoid such unrealistic results, the affine transformation was limited to translation plus uniform scaling (TUS).
Figure 3.
Intermediate structures that were generated when calculating the population-based model for the prostate.
Before the registration using the TUS transform was carried out, the patient-specific average surface meshes were converted into binary images whose voxel values take “1” if inside a mesh and “0” otherwise. The binary images had volumes with physical sizes about 40% larger than the largest SOI for all patients in all dimensions. Each voxel was a 1 mm3 cube. The sum of square difference was used as the similarity measure and the Insight ToolKit (ITK) (www.itk.org) regular step gradient descent (RSGS) optimizer was used for the registration. The RSGS optimizer advanced parameters in the direction of the gradient and a bipartition scheme was used to compute the step size. The linear interpolation method was used to estimate the value of the data on noninteger coordinates.
Computation of the population-based structure boundary SDSM
As shown in Fig. 1c, in the first step, the population-based surface mesh and the patient-specific average surface meshes were converted into binary images using the same method as described in the Sec. 2E. However, the slice plane dimension was fixed to 64×64 in order to reduce the computation time of the subsequent deformable registrations. The voxel size was computed according to the size of the SOI. Then the patient-specific binary images were preregistered to the population binary image using the TUS transform. Again, rotations were deliberately excluded from the preregistration stage for the same reason as described in the Sec. 2E.
In the second step, the preregistered binary images for each patient were deformably registered to the population binary root image using a B-Spline deformable registration algorithm.11 The mean square difference was used as the similarity measure and the ITK regular step gradient descent algorithm was used as the optimization method. A 5×5×5 array of internal control points were uniformly distributed within the image volume. The deformable registration step effectively accounts for any rotations that were present but ignored in the preliminary rigid registration.
In the third step, the B-Spline deformable transform calculated from the deformable registration was used to deform the SDSMs of each patient to produce registered SDSMs. The linear interpolation method was used to estimate the value of the data on noninteger coordinates in both the preregistration and the deformable registration.
In the next step the normal vectors from each vertex on the population-based surface mesh were used to sample the registered SDSMs of each patient. The SD values of the interception points between the sampling normal vector and the mesh surface of the registered SDSM were computed using the linear interpolation method.
Finally, for each vertex on the population-based surface mesh, the root mean square of all the sampled SD values of its corresponding normal vector was computed to give the SD value (i.e., the vertex value) of the population-based SDSM.
Statistical significance of the delineation variability at each point on the surface of the average structure
At the completion of the above analysis we had population-based SDSMs for each organ, consisting of spatially varying standard deviations σ(x) distributed over the organ surface. We wanted to know where this variation was statistically significant—i.e., where the local σ(x) was significantly larger than the average. We used the chi-squared statistic (χ2) to make this determination. For a set of N organ delineations at a point x, we calculated the reduced χ2
| (1) |
where di(x) is the ith local delineation, σ(x) is the average delineation at x, σ is the SD of the parent population of surface delineations, and ν=N−1 is the number of degrees of freedom in the reduced χ2. (For our study, ν=19 for the prostate and the bladder; ν=14 for the rectum.) We took σ=⟨σ(x)⟩ averaged over all points on the structure’s surface to be the SD of the parent distribution. The distribution then tells us the probability that any particular set of N organ delineations {di(x)} at the point x with SD greater or equal to σ(x) could have come from a parent distribution with SD σ. This identified those areas of the surface where the delineation uncertainty is significantly larger than the average.
RESULTS
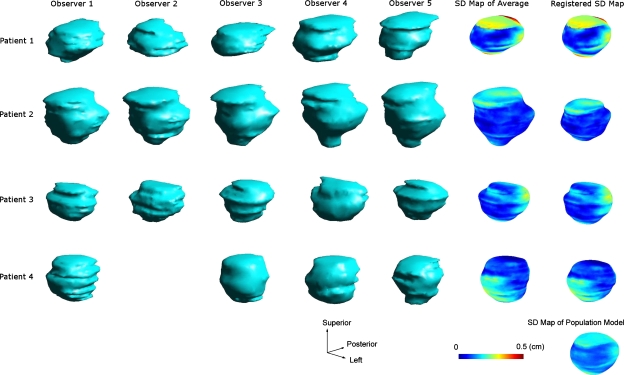
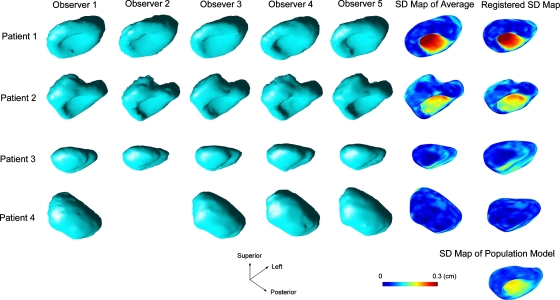
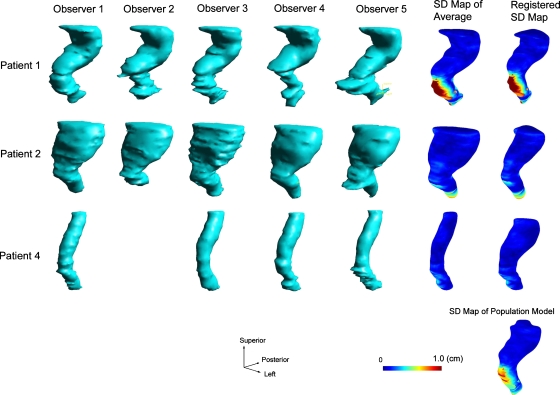
Figures 345 shows a number of intermediate structures that were generated when calculating the population models for the prostate, the bladder, and the rectum, respectively. The structures on each row belong to a particular patient. For the database we used in the study, the rectum boundary delineations were not available for patient 3. The structure at the bottom-right corner is the computed population model. The first five columns are the volumetric rendering of the individual meshes that were delineated by different observes and exported from the treatment planning system. Unfortunately, observer 2, who is no longer available for this study, did not delineate any structures for patient 4. The structures in the sixth column are the computed patient-specific average surfaces with color-coded SD maps. The structures in the last column, except for the very bottom one, show the registered SDSMs after being deformably registered with the population-based structure boundary surface.
Figure 4.
Intermediate structures that were generated when calculating the population-based model for the bladder.
Figure 5.
Intermediate structures that were generated when calculating the population-based model for the rectum.
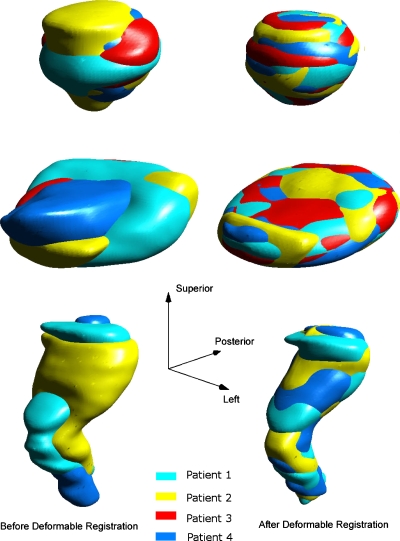
Figure 6 shows the overlapped structure surfaces before and after deformable registrations. The top, middle, and the bottom rows are the prostate, the bladder, and the rectum, respectively. The structure surfaces before deformable registrations are shown in the left column and the surfaces after deformable registrations in the right column. The agreement among surfaces can be seen to be greatly improved after the registration. This was confirmed by comparing the perpendicular distances between the population surface and the structure surface before and after the deformable registration. As shown in Table 1, after the registration, the SDs of the distances had been reduced by at least an order of magnitude for the prostate and the bladder with the mean values being very close to zero. The improvement for rectum was relatively smaller but the results were still good considering the large shape differences before the registrations.
Figure 6.
The overlapped structure surfaces before and after deformable registrations. The top, middle, and the bottom rows are the prostate, the bladder, and the rectum, respectively. The structure surfaces after translational and scaling registrations but before deformable registrations are shown in the left column and the surfaces after deformable registrations in the right column.
Table 1.
Surface-to-surface perpendicular distances before and after deformable registrations. DR, deformable registration; SD, standard deviation.
| Before DR | After DR | ||||||||
|---|---|---|---|---|---|---|---|---|---|
| Patient number | 1 | 2 | 3 | 4 | 1 | 2 | 3 | 4 | |
| Prostate | Mean | −0.021 | 0.073 | −0.038 | −0.006 | 0.000 | −0.001 | 0.000 | −0.001 |
| SD | 0.031 | 0.025 | 0.024 | 0.013 | 0.001 | 0.002 | 0.001 | 0.001 | |
| Bladder | Mean | −0.001 | −0.137 | −0.211 | −0.091 | −0.007 | −0.010 | −0.004 | −0.009 |
| SD | 0.121 | 0.148 | 0.094 | 0.421 | 0.005 | 0.013 | 0.006 | 0.006 | |
| Rectum | Mean | 0.008 | 0.135 | −0.542 | −0.008 | −0.021 | −0.042 | ||
| SD | 0.073 | 0.410 | 0.856 | 0.010 | 0.018 | 0.059 | |||
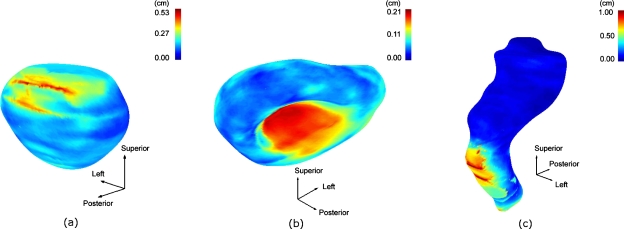
Figures 7a, 7b, 7c show the population-averaged structure boundary surfaces with their color-coded SD maps for the prostate, the bladder, and the rectum, respectively. In the figures, the color scale from blue to red corresponds to SDs ranging from 0 to 0.53 cm, 0 to 0.21 cm, and 0 to 1.0 cm for the prostate, the bladder, and the rectum, respectively. The largest boundary uncertainties were observed in the superior-posterior and inferior regions, the inferior region, and inferior-anterior and inferior regions for the prostate, the bladder, and the rectum, respectively. In these regions the χ2 test outlined in Sec. 2G shows a probability p<0.001 that the observed uncertainties are statistically comparable to the average uncertainties, from which we conclude that the local variations in these regions are statistically significant.
Figure 7.
The population-averaged structure boundary surface and the standard deviation maps for the prostate, the bladder, and the rectum, respectively.
DISCUSSION
Unlike the polar angle approach to mapping surface segmentation variability proposed by Remeijer et al.,2 our method works for a wide range of complex topologies with cylindrical, convex, and concave surfaces. The interobserver distance maps were converted to spatially dependent SDs of the individually contoured SOIs from the average structure surface. The distribution of SDs on the surface of the average SOI represents the population-based contouring uncertainty as a function of location.
We found distinct anatomical regions of each organ surface where the local uncertainties were significantly larger than the average contouring uncertainty. This supports our hypothesis that user-delineated surfaces used for surface-based deformable registration have anatomically correlated variations in accuracy that should be accommodated in the registration process. We propose to use the uncertainty maps as a weighting factor in a probabilistic model-based deformable registration process. A simple 3D visualization program was developed using OpenGL to interactively view 3D structure surfaces and SD surface maps.
An important issue in creating the population-based model is the determination of the deformable transformation that matches the corresponding regions among different patients. Deurloo et al.9 used a surface morphing algorithm. This method requires a user to interactively define the matching point between the source surface and the target surface. In a study to quantify the deformation of the prostate and seminal vesicles during the course of the treatment, van der Wielen et al.12 used a point-based deformable registration algorithm in creating the population-based SD model. The B-Spline deformable registration we adopted is easy to implement and produced good results that were confirmed by visual inspection and surface distance calculations. The comparison of the performance of these deformable matching methods is difficult since there is no standard available and no attempt was made by the other authors in describing the quality of the matching. The deformable registration we adopted took less than 5 min to finish when using an Intel Core 2 Extreme 3 GHz PC.
As shown in Fig. 1a, the average surface of a patient was generated by applying a surface extraction algorithm (i.e., the marching tetrahedron algorithm used in this paper) to the smoothed composite image. The number of vertices produced by the marching tetrahedron algorithm is controlled by a user-given grid size. The smaller the grid size, the less the voxelization artifacts, and the better the surface details preserved. However, smaller grid size would result in a larger number of vertices, which would greatly increase the computation complexity. The complexity of the perpendicular distance calculation algorithm we used is proportional to the square of the number of vertices. Owing to these reasons, a compromise was made by the setting the grid size to 1 mm, which results in 27 087, 83 463, and 78 523 vertices for the patient 1 for the prostate, the bladder, and the rectum, respectively. The computation of one patient-specific SDSM took 1.6, 6.7, and 5.9 min for the prostate, the bladder, and the rectum, respectively.
SUMMARY
We developed simple and useful tools to quantify and visualize structure boundary delineation uncertainty as a function of position on the 3D structure surface. The computed boundary uncertainties can be used as weighting factors for a surface-based probabilistic deformable registration.
ACKNOWLEDGMENTS
This work was supported in part by NIH Grant No. P01CA116602.
References
- Kaus M. R., Brock K. K., Pekar V., Dawson L. A., Nichol A. M., and Jaffray D. A., “Assessment of a model-based deformable image registration approach for radiation therapy planning,” Int. J. Radiat. Oncol., Biol., Phys. 68, 572–580 (2007). 10.1016/j.ijrobp.2007.01.056 [DOI] [PubMed] [Google Scholar]
- Remeijer P., Rasch C., Lebesque J. V., and van Herk M., “A general methodology for three-dimensional analysis of variation in target volume delineation,” Med. Phys. 26, 931–940 (1999). 10.1118/1.598485 [DOI] [PubMed] [Google Scholar]
- Guimond A., Meunier J., and Thirion J. P., “Average brain models: A convergence study,” Comput. Vis. Image Underst. 77, 192–210 (2000). 10.1006/cviu.1999.0815 [DOI] [Google Scholar]
- Lorenzen P., Davis B., and Joshi S., “Unbiased atlas formation via large deformations metric mapping,” in Proceedings of the Eighth International Conference on Medical Image Computing and Computer-Assisted Intervention—MICCAI 2005, LNCS 3750 (Springer-Verlag, Berlin, 2005), pp. 411–418. [DOI] [PubMed]
- Bhatia K. K., Hajnal J. V., Puri B. K., Edwards A. D., and Rueckert D., “Consistent groupwise non-rigid registration for atlas construction,” in Proceedings of the Second IEEE International Symposium on Biomedical Imaging: Macro to Nano, 2004, IEEE Cat No. 04EX821,Vol. 1, p. 908.
- Marsland S., Twining C. J., and Taylor C. J., “Groupwise nonrigid registration using polyharmonic clamped-plate splines,” in Proceedings of the Sixth International Medical Image Computing and Computer-Assisted Intervention—MICCAI 2003, Part II, 2003, LNCS, Vol. 2879 (Springer-Verlag, Berlin, 2003), pp. 771–779. [Google Scholar]
- Park H., Bland P. H., A. O.HeroIII, and Meyer C. R., “Least biased target selection in probabilistic atlas construction,” in Proceedings of the Eighth International Medical Image Computing and Computer-Assisted Intervention—MICCAI 2005, Part II, 2005, LNCS, Vol. 3750 (Springer-Verlag, Berlin, 2005), pp. 419–426. 10.1007/11566489_52 [DOI] [PubMed] [Google Scholar]
- Sobin L. H., TNM Classification of Malignant Tumours, 7th ed. (Wiley-Blackwell, New York, 2009). [Google Scholar]
- Deurloo K. E., Steenbakkers R. J., Zijp L. J., de Bois J. A., Nowak P. J., Rasch C. R., and van Herk M., “Quantification of shape variation of prostate and seminal vesicles during external beam radiotherapy,” Int. J. Radiat. Oncol., Biol., Phys. 61, 228–238 (2005). 10.1016/j.ijrobp.2004.09.023 [DOI] [PubMed] [Google Scholar]
- Gueziec A. and Hummel R., “Exploiting triangulated surface extraction using tetrahedral decomposition,” IEEE Trans. Vis. Comput. Graph. 1, 328–342 (1995). 10.1109/2945.485620 [DOI] [Google Scholar]
- Kybic J. and Unser M., “Fast parametric elastic image registration,” IEEE Trans. Med. Imaging 12, 1427–1442 (2003). [DOI] [PubMed] [Google Scholar]
- van der Wielen G. J., Mutanga T. F., Incrocci L., Kirkels W. J., Vasquez Osorio E. M., Hoogeman M. S., Heijmen B. J., and de Boer H. C., “Deformation of prostate and seminal vesicles relative to intraprostatic fiducial markers,” Int. J. Radiat. Oncol., Biol., Phys. 72, 1604–1611 (2008). [DOI] [PubMed] [Google Scholar]


