

Abstract
Animals may forage using different currencies depending on whether time minimization or energy maximization is more pertinent at the time. Assessment of net energy acquisition requires detailed information on instantaneous activity-specific power use, which varies according to animal performance, being influenced, for example, by speed and prey loading, and which has not been measured before in wild animals. We used a new proxy for instantaneous energy expenditure (overall dynamic body acceleration), to quantify foraging effort in a model species, the imperial shag Phalacrocorax atriceps, during diving. Power costs varied nonlinearly with depth exploited owing to depth-related buoyancy. Consequently, solutions for maximizing the gross rate of gain and energetic efficiency differed for dives to any given depth. Dive effort in free-ranging imperial shags measured during the breeding season was consistent with a strategy to maximize the gross rate of energy gain. We suggest that the divergence of time and energy costs with dive depth has implications for the measurement of dive efficiency across diverse diving taxa.
Keywords: time–energy budget, energy expenditure, foraging strategy, central place foraging, acceleration, currency
1. Introduction
Our ability to examine whether organisms forage effectively is reliant on knowledge of the currency used for making decisions. Time and energy are fundamental currencies related to fitness (cf. Lemon 1991) and there is evidence from models and experimental manipulations that organisms forage using both ‘time-based’ currencies, where the rate of energy gain is maximized, and/or ‘energy-based’ currencies, where the net energetic efficiency is maximized (sensu. Schoener 1971; Kacelnik 1984; Ydenberg & Hurd 1998). The lack of precise data on activity-specific energy expenditure (Butler et al. 2004) has meant that foraging models have often had to assume that energetic costs scale proportionately with time (Kacelnik 1984; Kramer 1988; Wilson & Quintana 2004; but see Pyke 1981). This convenience fails to account for the variation in animal performance even though performance parameters, such as travelling speed and prey loading, have a profound effect on energy expenditure (Pennycuik 1975; Lovvorn & Jones 1991; Feuerbacher et al. 2003). As such, models based on maximizing net energetic efficiency may be flawed, with the extent of the flaw being modulated by the variation in activity-specific energy expenditures exhibited during foraging.
Foraging theory has benefitted greatly from using central place foragers as models (cf. Orians & Pearson 1979), as the characteristic movements from a central place to the foraging patch facilitate the division of foraging costs into those of travel to and from the foraging patch (primarily functions of distance, speed and load) and those of prey searching, capture and handling in the patch (Orians & Pearson 1979). Diving organisms are particularly well-defined central place foragers because they locate food beneath the water surface but return to a central place, the surface, in order to breathe. Virtually all air-breathing divers, including seals, cetaceans, birds and turtles, exemplify a predatory group in which ‘energy’ costs do not scale linearly with ‘time’ costs because the effort required to swim varies with water depth (Wilson et al. 1992; Williams et al. 2000). These animals therefore experience a change in the costs of travel with distance from the central place. A similar scenario occurs in terrestrial systems where animals return with greater prey loads from more distant prey patches (Orians & Pearson 1979). Such relationships may change predictions of the optimal allocation of time and effort to the foraging cycle (cf. Houston & Carbone 1992; Hedenstrom & Alerstam 1995) where time and energy costs differ substantially.
Overall dynamic body acceleration (ODBA), which reflects body motion, has recently been found to correlate linearly with the rate of oxygen consumption in a number of species (Wilson et al. 2006; Fahlman et al. 2008; Halsey et al. 2009; Green et al. 2009). This follows because energy is required for mechanical work, and activity can account for a large proportion of the variation in metabolic costs, accounting, for instance, for 76 per cent of the variation in field metabolic rate (above standard metabolism) in mammals up to 2 kg (Karasov 1992). We used ODBA, measured by an animal-attached logger, to quantify the relationship between dive effort and dive depth for each of the dive phases in the imperial shag Phalacrocorax atriceps. Imperial shags are model organisms with which to examine central place foraging strategies in the wild, as, being benthic foragers, time in the foraging patch is readily identifiable from depth profiles as periods of little depth change (Wanless et al. 1992).
Our study sought to quantify the costs of the different phases of foraging dives and examine how these costs varied in relation to the distance of the patch (the bottom) from the central place (the surface). The derived time and effort costs were used to model foraging strategies that would maximize the (time-based) rate or the (energy-based) efficiency of foraging in imperial shags. Where travel costs are taken as a linear function of time alone, the solutions for maximizing efficiency in relation to time and energy are very similar (Houston & Carbone 1992). We hypothesized that the outcomes of the two currencies may differ once depth-related costs are accounted for, and further, that imperial shags are more likely to maximize the gross rate of energy gain, as the duration of the foraging trip, in which birds have to acquire resources to feed themselves and provision offspring, is limited by day length, chick-rearing shifts and feeding schedules (cf. Ydenberg & Hurd 1998).
2. Methods
(a). Device deployment
A total of 15 male imperial shags were equipped with experimental Daily Diary units in Argentina (Wilson et al. 2008). All units recorded triaxial acceleration, hydrostatic pressure, temperature and geomagnetic orientation with 22 bit resolution at frequencies of 6–9 Hz, though only triaxial acceleration and depth data are used in this analysis. The units were streamlined to minimize the drag and had maximum dimensions of 70 × 40 × 10 mm, a maximum mass of 36 g in water and 68 g in air, representing no more than 2.5 per cent of mean body mass (Svagelj & Quintana 2007).
Birds were equipped during the austral summers of 2005, 2006 and 2007 in breeding colonies at Punta Léon (43°04′ S, 64°2′ W) (n = 12 individuals) and Bahia Bustamante (45°10′ S, 66°30′ W) (n = 3 individuals), Chubut, Argentina. Shags were equipped when brooding one to three small chicks. Birds were slowly removed from the nest using a custom-made crook and devices were attached using Tesa tape. The birds were then returned to the nest and left to forage for a single trip before the device was removed.
(b). Derivation of overall dynamic body acceleration
ODBA is a single integrated measure of body motion (Wilson et al. 2006), defined as
| 2.1 |
where D is the dynamic component of acceleration arising from body motion in each of the three spatial axes corresponding to surge, heave and sway. The total acceleration values recorded in each axis (T) are the product of both static and dynamic components, with static values (S) representing body posture with respect to gravity (Yoda et al. 2001). In order to derive values of D, the total acceleration data in each channel were smoothed over a period of 3 s (Shepard et al. 2008). The smoothed values for any time period were then subtracted from the total acceleration over the same interval and converted into positive units to yield the dynamic values, so that
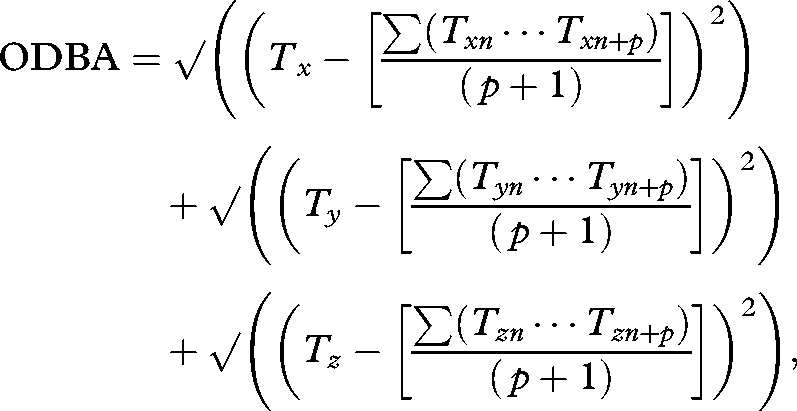 |
2.2 |
where p is the number of points over which the data are smoothed. All acceleration values are given in units of gravity (g).
ODBA has been found to correlate well and linearly with energy expenditure, as measured by the rate of oxygen consumption, particularly for locomotion including walking (Halsey et al. 2009) (n = 10 species), diving (Fahlman et al. 2008) (n = 1 species), swimming (A. Gleiss 2008, unpublished data) (n = 1 species) and other behaviours such as eating (Green et al. 2009) (n = 1 species).
(c). Dive selection
Only dives with a clear distinction between descent, bottom and ascent phases were selected as these were likely to represent foraging dives. Birds performed from 15 to 91 of these dives per foraging trip and random numbers were generated to select 15 dives from each bird. The maximum depth reached during the dive was used to define dive depth as there was little variance in depth during the bottom phase.
During pre-dive pauses, dynamic acceleration was likely to result from both active movement and wave motion at the surface so that ODBA values for this time are likely to overestimate bird effort. A resting ODBA was therefore estimated from periods of low activity when birds were in the colony and used to calculate a mean instantaneous ODBA value across individuals as a proxy for effort expended during the pre-dive pause. Finally, in assessing the relationships between the pre-dive pause and maximum depth, pauses over 1000 s were removed following Quintana et al. (2007).
Analyses were conducted in Snoop (Gareth Thomas, Freeware), Minitab (Minitab Inc. State College, USA), Microsoft Excel (Microsoft UK, Reading, UK) and three-dimensional contour plots were plotted in Surfer Plot (Golden Software, Golden, USA).
3. Results
Both dive duration and the ODBA integrated over the whole dive increased as curvilinear functions of maximum depth (figure 1). However, while dive ODBA and dive duration predicted each other well at depths of less than 30 m, dive duration overestimated dive ODBA for deeper dives (figure 1). These curves are the product of the following relationships for each of the dive phases.
Figure 1.

Dive duration (total time, shown in black) and dive ODBA (total ODBA, shown in white) as a function of dive depth. Solid lines represent polynomial trend lines for both series.
Both descent duration (figure 2a(i) y = 0.814x − 0.313, r2 = 0.98, d.f. = 516, F = 23892, p < 0.001) and ascent duration (figure 2a(ii) y = 0.745x – 0.203, r2 = 0.94, d.f. = 516, F = 8350, p < 0.001) increased linearly as a function of dive depth, whereas the duration of the bottom phase increased curvilinearly (figure 2a(iii) y = −0.0224x2 + 3.0168x + 10.221, r2 = 0.66, d.f. = 516, F = 488, p < 0.001).
Figure 2.

(a) The relationship between maximum depth reached during a dive and duration of (i) the dive descent, (ii) ascent, and (iii) the bottom phase; and (b) the relationship between maximum depth reached during a dive and total ODBA during (i) the dive descent (ii) ascent, and (iii) the bottom phase.
The total ODBA for the descent increased with maximum depth (figure 2b(i) y = −0.018x2 + 2.952x – 0.468, r2 = 0.90, d.f. = 237, F = 1095, p < 0.001) as did the total ODBA for the ascent, though with a slope less than half that of the descent ODBA (figure 2b(ii) y = 0.6306x + 1.5964, r2 = 0.68, d.f. = 237, F = 233, p < 0.001). The mean instantaneous ODBA at any given depth during the descent decreased with increasing depth and did not vary as a function of maximum dive depth (figure 3), indicating that the cost for the whole descent was a function of maximum depth alone.
Figure 3.

Mean instantaneous ODBA at 5 m intervals during the dive descent. Dives were grouped according to maximum depth in 10 m depth bins. Diamond, 10 m; open square, 20 m; open triangle, 30 m; cross, 40 m; plus, 50 m; open circle, 60 m.
The total ODBA during the bottom phase increased with dive depth (figure 2b(iii) y = 55.398 ln(x) − 22.01, r2 = 0.34, d.f. = 237, F = 61, p < 0.001). ODBA during the bottom phase was a function of prey searching, prey pursuit and handling. In order to model dive efficiency as a function of available search time and effort alone, the ODBA arising from prey searching was estimated as follows: examination of the ODBA during the bottom phase indicated a relatively constant baseline value (assumed to represent prey searching), from which periodic increases in ODBA occurred (possible prey pursuits). In order to define a cut-off point between baseline and peak values, the frequency of ODBA values was calculated across the bottom phases from all dives and binned according to maximum depth with 5 m bins. Here, the modal ODBA showed a general decrease with increasing depth, as predicted by buoyancy changes with depth. The frequency distributions were all strongly skewed to the left, and the 75 per cent quartile was taken as the cut-off point between search and pursuit values, assuming that the tail beyond this point represented increases in effort above the baseline associated with prey pursuit. Power requirements (mean ODBA per unit time) were calculated for periods with ODBA values less than the 75 per cent quartile for each 5 m depth bin and were found to decrease with depth according to y = 0.0005x2 − 0.0511x + 2.6173 (r2 = 0.62, d.f. = 141, F = 114, p < 0.001).
The pre-dive pause duration (hereafter ‘pause duration’) increased as an accelerating function of the total ODBA expended during the dive (figure 4). Owing to the relatively high variance typical of the relationship between surface pause duration and dive duration (Wanless et al. 1992), or in this case dive ODBA, a trend line was fitted to the mean pause durations for dive ODBA values binned in 50 g bin widths (figure 4; y = 20.68e0.0083x, r2 = 0.73).
Figure 4.

Surface pause duration as a function of dive ODBA. The trend line was derived taking the average surface pause duration for dive ODBA values grouped in increasing 50 g bins (filled circles).
4. Discussion
While the case of buoyancy is particular to diving species, costs of travel vary across diverse organisms with travel speed (Hedenstrom & Alerstam 1995; Feuerbacher et al. 2003) and load (Pennycuik 1975). In volant birds, the selection of travel speed has received much attention, as it can provide an indication of whether individuals aim to minimize the time spent travelling, the energy consumed per unit time, or the energy per unit distance (see Henningsson et al. (in press) and references therein). For example, swifts have recently been shown to alter their relative speed, and behavioural currency, between their spring and autumn migrations in response to the variable fitness consequences associated with an early arrival from the respective journeys (Henningsson et al. in press).
Like migration, the problem of how air breathers can best exploit underwater resources has been a source of intrigue for biologists for decades (Dewar 1924). However, owing to the difficulties associated with measuring energy expenditure over these fine scales, estimates of efficiency over the dive cycle have, to date, been based on the allocation of time alone (e.g. Kramer 1988; Wilson & Quintana 2004). This approach has been widely used to measure foraging efficiency and how it varies through time, and across individuals of different age and sex (e.g. Daunt et al. 2007), even though the most appropriate currency may also vary under such circumstances.
(a). Quantifying dive effort
For diving animals, the mechanical costs of swimming are primarily determined by their buoyancy and the speed-related drag acting on their bodies (Lovvorn & Jones 1991; Wilson et al. 1992). The decreasing ODBA values with increasing depth during the descent (cf. Wilson et al. 2006) and bottom phases (cf. Watanuki et al. 2005) are consistent with pressure-related changes in buoyancy, as birds experience a reduction in upthrust owing to the compression of their body air as they descend in the water column. The particular situation noted by various authors for penguins, where birds inhale a greater volume for deeper dives (e.g. Sato et al. 2002), which confers greater dive capacity via greater body oxygen stores without incurring much extra buoyancy (except during the descent), does not seem to apply to imperial shags. Here, birds appear to descend with a constant respiratory air volume, as instantaneous ODBA at any particular depth during the descent did not change with maximum dive depth (figure 3). Regulating the volume of air in the respiratory system may not incur much of an advantage in this species, which transports a higher volume of air to depth in its plumage (Quintana et al. 2007). Importantly, therefore, the buoyancy costs can be described by a single relationship with respect to maximum dive depth.
The changing buoyancy costs with dive depth produced a strong curvilinear relationship between the energy costs summed over the whole dive and dive depth. Thus, while dive duration increased with depth, as found elsewhere (e.g. Wanless et al. 1992), the increase in dive effort was not proportional to the increase in dive duration (figure 1). Consequently, we may expect predictions of dive efficiency to vary where they are based on (i) the duration of the dive cycle and (ii) the mechanical power requirements of the dive. This was tested as follows.
(b). Model construction
In diving animals, solutions for optimizing time in the foraging patch (t) are complex, as the period of recovery at the surface (s) required following each dive, to allow the bird to reacquire body oxygen stores and eliminate CO2 (Boutilier et al. 2001), necessitates both a time and energy investment. The precise allocation of time or energy to each phase of a dive (including the surface pause) will affect the rate and efficiency of energy gain because many phases of the dive are interdependent (Houston & Carbone 1992).
Models were constructed to identify the allocation of time and effort within the dive that would maximize the dive efficiency with respect to two different currencies. First, the gross rate, R, of energy gain
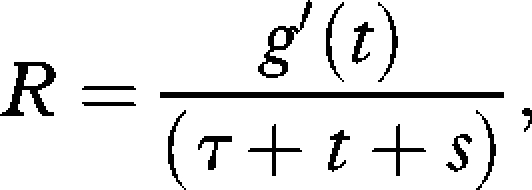 |
4.1 |
where g′ is the rate of energy gain over time t in the foraging patch (the bottom phase of the dive), and τ is the travel time (the sum of the descent and ascent phases to any given depth). In both currencies the rate of energetic gain is assumed to be proportional to the patch time, so g′(t) becomes t. The second currency considered is the energetic efficiency (E), defined as the ratio of energy gained to energy expended
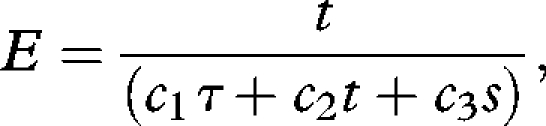 |
4.2 |
where c1 is the energetic cost of travel, c2, that of foraging and c3 the energetic cost of surface pause.
The rate and efficiency of energy gain are both calculated considering each dive cycle as a discreet departure from the central place (the surface). For a dive to any given depth we can vary the amount of effort (ODBA) that the model bird has available to it, K. The effort available in the patch is then
| 4.3 |
where c1τ is the sum of the ODBA for the descent and ascent to any given depth (see §3, figure 1) and the patch time is
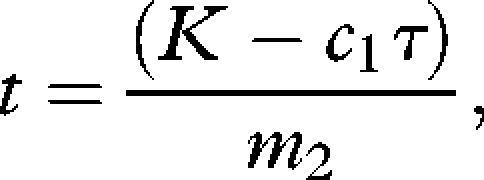 |
4.4 |
where m2 is the instantaneous ODBA during the bottom phase for any given depth (see §3). K is also used to derive the surface pause duration (based on the empirical relationship described in §3, figure 4), which is multiplied by a constant to find c3s (see §2). Implicit in the models are the assumptions that K is equal to the energy expended within the dive (Hansen & Ricklefs 2004) and that birds rely on aerobic respiration. Values of K are based on the range of ODBA values for dives in free-living imperial shags.
(c). Model predictions
In the model outputs, the maximal gross rate of gain decreased with increasing dive depth, while the maximal energetic efficiency peaked at 40–42 m (figure 5). For any given depth, there was an optimal value of ODBA within the dive (equating to surface time). These optima varied between the two currencies, with the rate of gain being maximized with lower values of ODBA at all depths (figure 6a). While a strategy to optimize the energetic efficiency provided much greater bottom duration (or effort) per dive cycle (figure 6b), this was at the expense of an increasing surface time (figure 6c; cf. Wanless et al. 1992).
Figure 5.

(a) The energetic efficiency (efficiency) and (b) gross rate of energy gain (rate of gain) were modelled for a range of dive ODBA values across dive depths. Model outputs were plotted on a three-dimensional surface using a local second-order polynomial.
Figure 6.

(a) The dive ODBA values that would maximize the efficiency (line with open circles) and the rate of gain (line with filled circles) are given in relation to dive depth, along with the data from the individual birds (given as separate series). The duration of the (b) bottom phase and (c) surface pause are given for efficiency- and rate-optimizing model predictions.
Of the two currencies considered here, values of dive ODBA recorded in free-ranging shags were more consistent with predictions that would maximize the gross rate of energy gain (figure 6a). Here we note that optima are presented for two currencies only, of which other permutations exist (Kacelnik 1984). In an exploration of currencies based on theoretical values of energy expenditure during feeding, Ydenberg & Hurd (1998) found that a rate-maximizing strategy performed best when time was limiting. In the present study, imperial shags are likely to be limited by the need for both males and females to forage during daylight hours while the other guards the nest. These conditions are specific to the breeding season and it may be that, subsequently, when the time available for foraging increases and energy requirements decrease, a currency based on energetic efficiency confers a greater advantage (Schoener 1971; Ydenberg & Hurd 1998).
(d). Model sensitivity
The model assumes that ODBA can be used as a proxy for the mechanical power requirements of swimming. While this relationship has not been calibrated in cormorants, instantaneous ODBA was previously found to correlate linearly with the predicted upthrust experienced by imperial shags during the dive descent (Wilson et al. 2006, fig. 4b). The rate of oxygen consumption was also linearly related to ODBA for great cormorants (Phalacrocorax carbo) walking on a treadmill (Wilson et al. 2006). As cormorants and shags are foot-propelled divers, many of the same muscle groups will be involved in walking and swimming.
We also note that model estimates of the rate and efficiency of energy gain will be sensitive to the power term in the relationship of surface pause interval to K. While there is evidence in the present and previous studies that pause duration increases as an increasing function of dive duration (and here K), accurate definition of this term is compromised by the range of potential roles of the dive pause, including post-dive recovery, pre-dive preparation (Boutilier et al. 2001) and prey handling. Furthermore, birds may not dive in steady state (cf. Wilson & Quintana 2004). Estimates of the energetic efficiency will also be affected by the surface metabolic rate (m3) (cf. Houston & Carbone 1992). The question of exactly when, during the dive cycle, birds pay for mechanical work is complex, as the processes of oxygen intake and increased heart rate, both normally linked in time to physical work, become dissociated over the dive cycle. A resting value of ODBA was taken as the estimate of surface effort owing to (i) actual measurements of surface motion representing wave action rather than body motion; (ii) the relationship of both CO2 accumulation and O2 depletion to mechanical work performed during the dive (Elliott et al. 2008); and (iii) the characteristic inactivity of shags during the surface pause (E. L. C. Shepard 2006, 2007, personal observation).
5. Conclusions
In this study, we have considered dive costs as a function of mechanical power requirements. A consequence of the variation in power requirements with dive depth is that solutions for optimizing the rate of energy gain (in terms of the allocation of time and effort over the dive cycle) are likely to differ from those that would optimize the overall energetic efficiency. The degree to which time and energy costs diverge with depth will be a function of (i) the buoyancy of the study animal and (ii) the depth range used.
Buoyancy-mediated changes in power requirements are likely to be particularly pertinent for diving in birds, which dive with a greater volume of compressible air in their respiratory spaces than other vertebrate divers, and have additional air trapped within their plumage (Hansen & Ricklefs 2004). However, as air spaces become compressed, body density plays an increasingly important role in determining buoyancy (Lovvorn & Jones 1991), thus mediating a change in mechanical power requirements with depth for a range of air-breathing divers, including deep-diving species (Williams et al. 2000).
Time and energy costs may further diverge as a result of physiological mechanisms that have evolved in air-breathing divers in response to the constraints on time and energy spent underwater. For instance, diving metabolic rate may vary with dive depth and duration where mechanisms such as bradycardia and regional hypothermia are employed (e.g. Thompson & Fedak 1993). Although ODBA cannot address these non-mechanical issues, it appears uniquely placed as a method of measuring the variation in locomotion-related power requirements at fine scale. As such, it is likely to provide insight into the allocation of effort in different ecological situations, both within and between individuals, and thereby the currencies employed over a range of spatial and temporal scales.
Acknowledgements
Procedures were approved by ethics committees at the University of Swansea, UK, and the National Research Council of Argentina.
E.L.C.S. is funded by an NERC studentship (award number NER/S/A/2005/13416A). Device development was supported by a Rolex Award for Enterprise, awarded to R.P.W. We also thank the Organismo Provincial de Turismo, Chubut, Argentina, for the permits to work in Punta Leon, and the Centro Patagónico (Conicet) for institutional support. We are also grateful to the Wildlife Conservation Society for funding awarded to F.Q. for fieldwork. The manuscript benefited from comments by G. C. Hays and was greatly improved by the contributions of two anonymous referees.
References
- Boutilier R. G., Reed J. Z., Fedak M. A.2001Unsteady-state gas exchange and storage in diving marine mammals: the harbor porpoise and gray seal. Am. J. Physiol. Reg. I. 281, 490–494 [DOI] [PubMed] [Google Scholar]
- Butler P. J., Green J. A., Boyd I. L., Speakman J. R.2004Measuring metabolic rate in the field: the pros and cons of the doubly labelled water and heart rate methods. Funct. Ecol. 18, 168–183 (doi:10.1111/j.0269-8463.2004.00821.x) [Google Scholar]
- Daunt F., Wanless S., Harris M. P., Money L., Monaghan P.2007Older and wiser: improvements in breeding success are linked to better foraging performance in European shags. Funct. Ecol. 21, 561–567 (doi:10.1111/j.1365-2435.2007.01260.x) [Google Scholar]
- Dewar J. M.1924The bird as a diver London, UK: Witherby [Google Scholar]
- Elliott K. H., Davoren G. K., Gaston A. J.2008Increasing energy expenditure for a deep-diving bird alters time allocation during the dive cycle. Anim. Behav. 75, 1311–1317 (doi:10.1016/j.anbehav.2007.10.026) [Google Scholar]
- Fahlman A., Wilson R. P., Svärd C., Rosen D. A. S., Trites A. W.2008Activity and diving metabolism correlate in Steller sea lion Eumetopias jubatus. Aquat. Biol. 2, 75–84 (doi:10.3354/ab00039) [Google Scholar]
- Feuerbacher E., Fewell J. H., Roberts S. P., Smith E. F., Harrison J. F.2003Effects of load type (pollen or nectar) and load mass on hovering metabolic rate and mechanical power output in the honey bee Apis mellifera. J. Exp. Biol. 206, 1855–1865 (doi:10.1242/jeb.00347) [DOI] [PubMed] [Google Scholar]
- Green J. A., Halsey L. G., Wilson R. P., Frappell P. B.2009Estimating energy expenditure of animals using the accelerometry technique: activity, inactivity and comparison with the heart-rate technique. J. Exp. Biol. 212, 471–482 (doi:10.1242/jeb.026377) [DOI] [PubMed] [Google Scholar]
- Halsey L. G., Shepard E. L. C., Gomez Laich A., Quintana F., Green J. A., Wilson R. P.2009The relationship between oxygen consumption and body motion in a range of species. Comp. Biochem. Physiol. A 152, 197–202 (doi:org/10.1016/j.cbpa.2008.09.021) [DOI] [PubMed] [Google Scholar]
- Hansen E. S., Ricklefs R. E.2004Foraging by deep-diving birds is not constrained by an aerobic diving limit: a model of avian depth-dependent diving metabolic rate. Am. Nat. 163, 358–374 (doi:10.1086/381943) [DOI] [PubMed] [Google Scholar]
- Hedenstrom A., Alerstam T.1995Optimal flight speed of birds. Phil. Trans. R. Soc. Lond. B 348, 471–487 (doi:10.1098/rstb.1995.0082) [Google Scholar]
- Henningsson P., Karlsson H., Bäckman J., Alerstam T., Hedenstrom A.In press Flight speeds of swifts (Apus apus): seasonal differences smaller than expected. Proc. R. Soc. B (doi:10.1098/rspb.2009.0195) [DOI] [PMC free article] [PubMed] [Google Scholar]
- Houston A. I., Carbone C.1992The optimal allocation of time during the diving cycle. Behav. Ecol. 3, 255–265 (doi:10.1093/beheco/3.3.255) [Google Scholar]
- Kacelnik A.1984Central place foraging in starlings (Sturnus-vulgaris). 1. Patch residence time. J. Anim. Ecol. 53, 283–299 (doi:10.2307/4357) [Google Scholar]
- Karasov W. H.1992Daily energy-expenditure and the cost of activity in mammals. Am. Zool. 32, 238–248 [DOI] [PubMed] [Google Scholar]
- Kramer D. L.1988The behavioral ecology of air breathing by aquatic animals. Can. J. Zool. 66, 89–94 (doi:10.1139/z88-012) [Google Scholar]
- Lemon W. C.1991Fitness consequences of foraging behavior in the zebra finch. Nature 352, 153–155 (doi:10.1038/352153a0) [Google Scholar]
- Lovvorn J. R., Jones D. R.1991Body-mass, volume, and buoyancy of some aquatic birds, and their relation to locomotor strategies. Can. J. Zool. 69, 2888–2892 (doi:10.1139/z91-407) [Google Scholar]
- Orians G. H., Pearson N. E.1979On the theory of central place foraging. In Analysis of ecological systems (eds Horn D. J., Mitchell R. D., Stairs G. R.), pp. 155–177 Columbus, OH: Ohio State University Press [Google Scholar]
- Pennycuik C. J.1975Mechanics of flight. In Avian biology, vol. 5 (eds Farner D. S., King J. R., Parks K. C.), pp. 1–75 New York, NY: Academic Press [Google Scholar]
- Pyke G. H.1981Optimal travel speeds of animals. Am. Nat. 118, 475–487 (doi:10.1086/283842) [Google Scholar]
- Quintana F., Wilson R. P., Yorio P.2007Dive depth and plumage air in wettable birds: the extraordinary case of the Imperial cormorant. Mar. Ecol. Prog. Ser. 334, 299–310 (doi:10.3354/meps334299) [Google Scholar]
- Sato K., Naito Y., Kato A., Niizuma Y., Watanuki Y., Charrassin J. B., Bost C. A., Handrich Y., Le Maho Y.2002Buoyancy and maximal diving depth in penguins: do they control inhaling air volume? J. Exp. Biol. 205, 1189–1197 [DOI] [PubMed] [Google Scholar]
- Schoener T. W.1971Theory of feeding strategies. Annu. Rev. Ecol. Syst. 2, 369–404 (doi:10.1146/annurev.es.02.110171.002101) [Google Scholar]
- Shepard E. L. C., Wilson R. P., Halsey L. G., Quintana F., Gómez Laich A., Gleiss A., Liebsch N., Myers A. E., Norman B.2008Towards a robust measure of body motion: over what period should acceleration be smoothed to derive the dynamic component? Aquat. Biol. 4, 235–241 (doi:10.3354/ab00104) [Google Scholar]
- Svagelj W., Quintana F.2007Sexual size dimorphism and sex determination by morphometric measurements in breeding Imperial shags (Phalacrocorax atriceps). Waterbirds 30, 97–102 (doi:10.1675/1524-4695(2007)030[0097:SSDASD]2.0.CO;2) [Google Scholar]
- Thompson D., Fedak M. A.1993Cardiac responses of gray seals during diving at sea. J. Exp. Biol. 174, 139–164 [DOI] [PubMed] [Google Scholar]
- Wanless S., Harris M. P., Morris J. A.1992Diving behavior and diet of the blue-eyed shag at South-Georgia. Polar Biol. 12, 713–719 (doi:org/10.1007/BF00238872) [Google Scholar]
- Watanuki Y., Takahashi A., Daunt F., Wanless S., Harris M., Sato K., Naito Y.2005Regulation of stroke and glide in a foot-propelled avian diver. J. Exp. Biol. 208, 2207–2216 (doi:10.1242/jeb.01639) [DOI] [PubMed] [Google Scholar]
- Williams T. M., Davis R. W., Fuiman L. A., Francis J., Le Boeuf B. L., Horning M., Calambokidis J., Croll D. A.2000Sink or swim: strategies for cost-efficient diving by marine mammals. Science 288, 133–136 (doi:10.1126/science.288.5463.133) [DOI] [PubMed] [Google Scholar]
- Wilson R. P., Quintana F.2004Surface pauses in relation to dive duration in Imperial cormorants; how much time for a breather? J. Exp. Biol. 207, 1789–1796 (doi:10.1242/jeb.00967) [DOI] [PubMed] [Google Scholar]
- Wilson R. P., Hustler K., Ryan P. G., Burger A. E., Nöldecke E. C.1992Diving birds in cold water: do Archimedes and Boyle determine energetic costs? Am. Nat. 140, 179–200 (doi:10.1086/285409) [Google Scholar]
- Wilson R. P., White C. R., Quintana F., Halsey L. G., Liebsch N., Martin G. R., Butler P. J.2006Moving towards acceleration for estimates of activity-specific metabolic rate in free-living animals: the case of the cormorant. J. Anim. Ecol. 75, 1081–1090 (doi:10.1111/j.1365-2656.2006.01127.x) [DOI] [PubMed] [Google Scholar]
- Wilson R. P., Shepard E. L. C., Liebsch N.2008Prying into intimate details of animal lives; use of a daily diary on animals. Endang. Spec. Res. 4, 123–137 (doi:10.3354/esr00064) [Google Scholar]
- Ydenberg R., Hurd P.1998Simple models of feeding with time and energy constraints. Behav. Ecol. 9, 49–53 (doi:10.1093/beheco/9.1.49) [Google Scholar]
- Yoda K., Naito Y., Sato K., Takahashi A., Nishikawa J., Ropert-Coudert Y., Kurita M., Le Maho Y.2001A new technique for monitoring the behaviour of free-ranging Adelie penguins. J. Exp. Biol. 204, 685–690 [DOI] [PubMed] [Google Scholar]