Abstract
We have studied the metabolic gene–function network in yeast and digital organisms evolved in the artificial life platform Avida. The gene–function network is a bipartite network in which a link exists between a gene and a function (pathway) if that function depends on that gene, and can also be viewed as a decomposition of the more traditional functional gene networks, where two genes are linked if they share any function. We show that the gene–function network exhibits two distinct degree distributions: the gene degree distribution is scale-free while the pathway distribution is exponential. This is true for both yeast and digital organisms, which suggests that this is a general property of evolving systems, and we propose that the scale-free gene degree distribution is due to pathway duplication, i.e. the development of a new pathway where the original function is still retained. Pathway duplication would serve as preferential attachment for the genes, and the experiments with Avida revealed precisely this; genes involved in many pathways are more likely to increase their connectivity. Measuring the overlap between different pathways, in terms of the genes that constitute them, showed that pathway duplication also is a likely mechanism in yeast evolution. This analysis sheds new light on the evolution of genes and functionality, and suggests that function duplication could be an important mechanism in evolution.
Keywords: digital evolution, gene function relationship, metabolic network
1. Introduction
The use of networks in cell biology has been a crucial tool in understanding the complex interactions in living matter (Barabási & Oltvai 2004; Albert 2005; Koonin et al. 2006), and since the advent of high-throughput techniques, such as genome sequencing, microarrays and proteomics, this approach has become necessary in order to organize the vast amount of data being produced. The picture that has emerged reveals highly interconnected structures on several organizational levels within the cell, and that these are in turn connected to produce the complex behaviour of living cells (Hartwell et al. 1999; Jordan et al. 2000; Kitano 2002, 2004).
New techniques have, in the last decade, made it possible to map out the large-scale structure of protein interaction networks in a large number of organisms including viruses (McCraith et al. 2000), bacteria (Rain et al. 2001) and eukaryotes (Gavin et al. 2002; Giot et al. 2003; Li et al. 2004). Although they suffer from being incomplete and containing false positives, they still reveal a structure common across all organisms that have been analysed. The most striking feature is that protein interaction networks are very heterogeneous and exhibit a scale-free degree distribution (Jeong et al. 2001; Wagner 2001). This means that the probability of finding a node that is connected to k other nodes (i.e. has degree k) scales as P(k)∝k −γ. This is in contrast with the classical model of complex networks introduced by Erdős & Rényi (1960) and Bollobas (1985), which exhibits a Poisson degree distribution with an exponential decay P(k)∝exp(−βk) for k larger than the average degree. In terms of structure, the scale-free distribution implies that the networks are characterized by a small number of highly connected hub proteins and a large number of proteins with few interaction partners. Furthermore, they also display the so-called ‘small-world effect’, which means that they are highly clustered and exhibit a small average path length (Wagner 2001). These observed features are believed to stem from the fact that the protein networks grow through gene duplication and divergence (Ohno 1970; Prince & Pickett 2002; Wapinski et al. 2007).
On a different level of cellular organization, transcriptional networks have been constructed for Escherichia coli (Shen-Orr et al. 2002) and Saccharomyces cerevisiae (Guelzim et al. 2002). These networks also exhibit a scale-free out-degree distribution (number of outgoing links), while the in-degree (number of incoming links) follows an exponential decay, reflecting the asymmetric nature of gene regulation. As with protein networks, the growth of the transcriptional network is driven by gene duplication, where regulatory interactions can either be conserved or lost during divergence (Teichmann & Babu 2004).
A more general type of network that has been considered are functional gene networks (Troyanskaya et al. 2003; Lee et al. 2004; Franke et al. 2006), in which two genes are connected if they are functionally linked. In order to construct functional networks, data collected from various sources, such as DNA microarray experiments, protein interactions and comparative genomics, are integrated to generate a single network using statistical methods. These networks cover a large number of different types of interactions such as metabolic coupling, genetic regulation and protein interaction, and give a comprehensive overview of the functional association between different genes.
An example of such a network is YeastNet (Lee et al. 2007), which describes the functional association between genes in S. cerevisiae. This network integrates 10 different data sources and is probabilistic, in the sense that each link in the network is associated with the probability of describing an actual functional relationship. Owing to its integrative nature, it has an extensive coverage incorporating 102 803 linkages among 5483 yeast proteins (95% of the validated proteome). A similar approach has also been used to construct a functional gene network for Caenorhabditis elegans (Lee et al. 2008). In this network, node degree correlates with essentiality, and the network could also be used to make tissue-specific predictions identifying genes associated with loss-of-function phenotypes. Similar to the other networks discussed, this functional gene network exhibits a scale-free degree distribution, although with an exponential cut-off for large k. In an effort to assign functional attributes to unannotated proteins in yeast, a gene functional network was also used (Chen & Xu 2004). The prediction of biological function was done both locally, using ‘guilt by association’, and on a global scale in the network by using a Boltzmann machine. With this approach, they were able to assign function to 1802 out of 2280 unannotated proteins in yeast.
Functional gene networks have provided useful information about the functional association of genes, but little attention has been paid to the actual structure of these networks. Although these networks are probabilistic in nature, in some instances more reliable information is available, and therefore allows for a more in-depth study of their structure. One example is the metabolism of S. cerevisiae in which the underlying gene–function relationship has to a large extent been established. Using these data, we have performed a detailed analysis of the large-scale structure of gene–function dependence from a network perspective. In order to test the generality of the results, we have also analysed networks obtained from the artificial life platform Avida (Adami 1998). In these in silico experiments, we have the capability to monitor the evolution of gene–function dependency, and from this we draw conclusions about the dynamics of yeast evolution.
2. Results
2.1. Gene–function relationship in the yeast metabolism
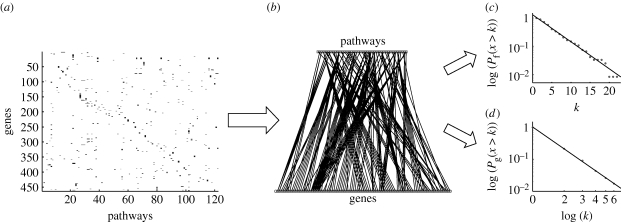
The yeast biochemical pathways dataset was downloaded from the Saccharomyces genome database (http://www.yeastgenome.org/, 9 October 2007; Christie et al. 2004). In this dataset, computationally predicted metabolic pathways were manually reviewed and curated to ensure accuracy. Known pathways that were missed by the prediction were manually added to improve the coverage. This dataset incorporates 463 genes involved in 122 pathways (i.e. functions). From this information, we constructed a functional genomic array (FGA; Lenski et al. 2003), which is a useful way of representing information from such a database. It is an N×M binary matrix, where N is the number of genes and M is the number of pathways in the dataset. The entry at position (i, j) is 1 if gene number i is involved in pathway number j and 0 otherwise. The FGA constructed from the data can be seen in figure 1 a. It gives a graphical representation of the gene–function dependency and reveals that the relationship is highly heterogeneous, where many genes are involved in a small number of pathways while only a small fraction take part in many pathways. The converse seems also to be true; most pathways involve only a few genes, while a minority depend on a large number of genes.
Figure 1.
The processing of the yeast biochemical pathways dataset. (a) First, the data were translated into a functional genomic array (FGA). Each row represents a gene and each column a pathway (or function). A gene is coloured black in a pathway column if the gene is involved in that pathway and grey if not. (b) The FGA can also be interpreted as the adjacency matrix of a bipartite graph which also visualizes the gene–function dependency (as the full graph consists of 463+122=585 nodes and 643 edges, only a subset is shown). From this graph, we can extract cumulative degree distributions for (c) the pathways/functions and (d) the genes. This reveals that the two distributions scale in two different ways, the pathway distribution is exponential while the gene distribution is scale-free.
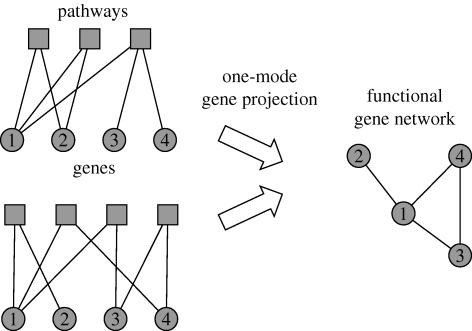
This is even more evident if we interpret the FGA as an adjacency matrix and draw the corresponding graph (shown partially in figure 1 b). This is a bipartite graph as the edges connect members of two disjoint sets (genes and pathways), and can be viewed as a decomposition of the functional gene network because the adjacency matrix of the corresponding functional gene (i.e. gene–gene) network can be recovered by multiplying the FGA with its transpose. The bipartite network separates the contribution of genes and functions in the connectivity of the functional gene network, and clearly contains more information than its one-mode projection (Newman et al. 2001; figure 2). It should be noted that the gene–function network is similar to actor collaboration graphs where one set of nodes corresponds to the actors and the other to the movies they act in (Ramasco et al. 2004), and also to graphs representing the genotype–phenotype map, although those graphs make use of higher order phenotypic traits rather than functions within the cell (Hansen 2006). In this context, we can identify some genes having pleiotropic effects and these genes probably have a significant impact on the overall metabolism. But instead of focusing our attention on these highly connected genes, we proceeded to analyse the overall structure of the bipartite graph.
Figure 2.
One-mode projection of the gene–function network. A gene–function network can be turned into a functional gene network through a one-mode projection, which connects two genes if they are next-nearest neighbours in the gene–function network. This process is not one-to-one as is evident from the two examples given, and the functional gene network therefore contains less information as it disregards which pathways two adjacent genes share. The gene–function network can be viewed as a decomposition of a functional gene network because the latter can be constructed by multiplying the adjacency matrix of the gene–function network with its transpose. This bipartite network separates the gene and function connectivity into two separate distributions, and therefore gives a more detailed description of gene functional association.
From this graph, we can extract the degree distributions for the genes and the pathways, i.e. calculating the probability p g(k) of finding a gene that is involved in k pathways, and the probability p f(k) of finding a pathway (function) which depends on k genes. If we assume, as a comparative null model, that the links between genes and pathways in this graph are random and occur with a given probability p between every gene and pathway, then the degree distributions p g(k) and p f(k) would follow binomial distributions with the average degree of the genes being pN f, and correspondingly pN g for the pathways, where N f,g is the number of genes/pathways in the network. From this, it follows that both degree distributions would decay exponentially for k larger than the average degree (see appendix A). This will serve as a null model with which we can compare the actual degree distributions obtained from yeast and the digital organisms.
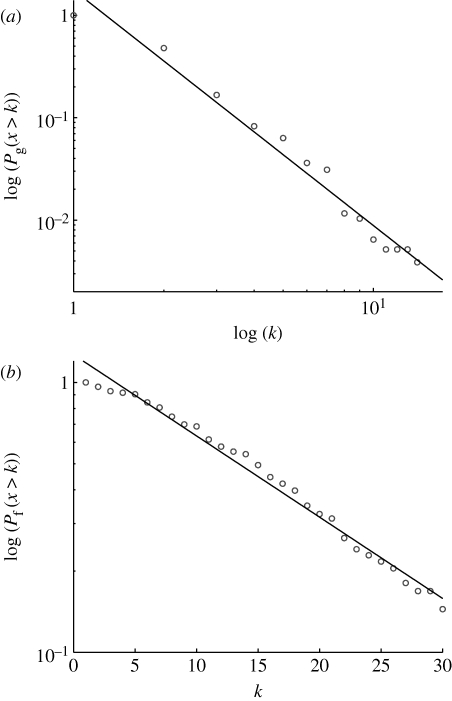
In order to avoid some of the inherent noisiness of the data, we analysed cumulative distributions P(x>k) instead of frequency functions (Tanaka et al. 2005). The results are shown in figure 1 c,d, and both distributions are, as expected, decreasing functions of the degree, but more specifically they decay in two distinct ways. The pathway degree distribution shows a linear decrease in a semi-log plot (correlation coefficient ρ=−0.991), implying that it follows an exponential distribution p f(k)∼exp(−βk), with β=0.22. The gene degree distribution on the other hand exhibits a linear decay in a log–log plot (ρ=−0.9997), which implies that it follows a scale-free or power-law distribution p g(k)∼k −γ, with γ=3.27. The functional gene network obtained from the one-mode projection has an average clustering coefficient of 〈C〉=0.96 (see appendix A), which suggests a high degree of potential modularity (Ravasz et al. 2002; see also figure S1 in the electronic supplementary material). In order to ensure that the observed structures were not an artefact of the Saccharomyces genome database, we performed an identical analysis on yeast data from the Kyoto Encyclopedia of Genes and Genomes (KEGG) database. The KEGG pathway dataset was downloaded from the KEGG (http://www.genome.jp/kegg/, 12 October 2007), and only metabolic pathways were included for this study. In this dataset, all pathways were computationally predicted. It covers 775 genes involved in 83 pathways. From this dataset, the gene/pathway degree distributions were extracted in precisely the same way as for the Saccharomyces genome database (SGD) dataset. Similar to that data, the gene degree distribution (figure 3 a) is scale-free p g(k)∼k −γ (with γ=3.30, ρ=−0.987), and the pathway degree distribution (figure 3 b) is exponential p f(k)∼exp(−βk) (with β=0.07, ρ=−0.993). The average clustering coefficient for the corresponding functional gene network was 〈C〉=0.88, which again suggests a high degree of potential modularity. These results show that the gene–function network deviates from the proposed null model, which exhibits exponential degree distributions for both genes and pathways, and this has some interesting implications for the growth dynamics and evolution of the yeast gene–function network.
Figure 3.
The degree distributions from the gene–function graph generated from the KEGG dataset. Similar to the SGD dataset, (a) the gene degree distribution is scale-free and (b) the pathway degree distribution is exponential.
From the work of Barabási & Albert (1999), it is known that using the two mechanisms, growth and preferential attachment, a random scale-free network can be formed. If only new edges and no new nodes are added to the network, the degree distribution soon reaches a state where all nodes are connected. On the other hand, if new nodes are added, but connected to existing nodes without any preference, then the network exhibits a Poisson degree distribution. The yeast metabolic network is the product of an evolutionary process, which implies that new genes and pathways have been added to the network through some growth process. This suggests that there are two different types of growth dynamics occurring within the gene–function network. On one hand, the genes seem to acquire connections to pathways through a mechanism that preferentially attaches genes with a high degree, while on the other hand, the pathways seem to acquire links to genes essentially independent of their own degree.
2.2. Experiments in digital evolution
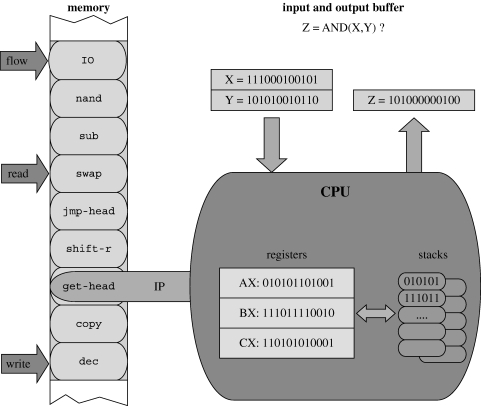
In order to test this hypothesis, we have performed experiments using the artificial life platform Avida (Adami 1998, 2006). Avida is a platform for studying the evolution of digital organisms in a virtual environment, and has, for instance, been used to investigate the evolutionary origin of complex features (Lenski et al. 2003), adaptive radiation (Chow et al. 2004) and genetic interactions (Lenski et al. 1999). The organisms in Avida reside on a square lattice, each lattice point containing a CPU that executes the genome of the organism. The genome consists of a circular sequence of machine code instructions, such as add and if-n-equ, which modify the state of the CPU in a predefined manner (see figure 4 which is a common illustration; Lenski et al. (2003); Adami (2006); and also table S1 in the electronic supplementary material). These instructions allow for self-replication, but can also be used to perform basic computational functions for which the organisms are rewarded by obtaining more CPU time (see table S2 in the electronic supplementary material). The increase in CPU time can be viewed as an increase in energy production as it allows for a faster execution of the genome, and therefore the computation of these functions corresponds to a digital metabolism. The instructions and functions constitute two distinct operational levels within the organism, where the combined actions of certain instructions give rise to a given function. The instructions of the organism can therefore be thought of as genes, which when executed/expressed perform a given cellular function, whereas the computational functions can be likened to metabolic pathways where the metabolites pass through a number of discrete steps and the end product is a chemical compound beneficial for the cell. The copying of instructions is subject to mutations (i.e. changes to the genotype), which may alter the rate of reproduction and the metabolism of the organism. Most mutations to an organism are neutral or deleterious and only a small fraction increases the reproductive success of the organism (Lenski et al. 1999). The success of a given genotype depends on what other genotypes are present in the environment, and this means that the fitness in Avida is implicitly defined and not a predefined function of the genotype.
Figure 4.
The virtual CPU in which the digital organisms are executed. The CPU consists of a memory that holds the genome of the organism and an instruction pointer (IP), which indicates the next instruction to be executed. The execution of an instruction alters the state of two stacks and three registers (AX, BX and CX), which can hold arbitrary 32-bit integers. A summary of all instructions and their action on the CPU is shown in table S1 in the electronic supplementary material. Connected to the CPU is one input and output buffer, which the organism uses to receive and return information and is used in the computation of the rewarded functions (summarized in table S2 in the electronic supplementary material). In addition to the IP, the CPU also holds a read-head, a write-head and a flow-head, which specify positions in the memory. When a copy command is executed, it copies an instruction from the read- to the write-head, and the flow-head specifies the new location of the IP when a mov-head instruction is executed. For further information on the Avida system, please consult Adami (1998) and the online documentation (http://devolab.cse.msu.edu/software/avida/doc/).
Each run was started with an ancestral genotype that had only the capability to self-replicate. After approximately 7500 ancestral generations, the dominant (i.e. most abundant) genotype was extracted and its lineage was tracked back all the way to the ancestral genotype. All the genotypes in the lineage were also saved as they provide crucial information about the evolutionary trajectory of the system. Firstly, we calculated the FGA for the dominant genotype. This was done by changing each instruction of the genome of this genotype one at a time into a null instruction. Each modified version of the genotype was then executed in a test CPU and the functions it could perform were recorded. In real cells, this would correspond to knocking out one gene at a time and recording the phenotypic effects this has. This procedure gives us information about which genes each function depends on, and from this the FGA can be created in exactly the same way as for the yeast data. From the FGA, the cumulative degree distributions were extracted for both the instructions and the functions. The results were averaged over 120 runs with different random seeds and the outcome can be seen in figure 5.
Figure 5.
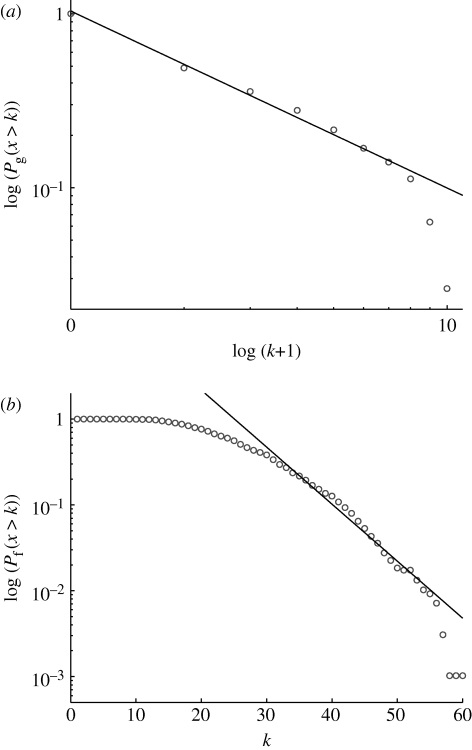
The gene (instruction) and function cumulative degree distributions calculated from the digital organisms. (a) The gene degree distribution exhibits a scale-free decay with a cut-off for large k and (b) the function degree distribution that decays exponentially for k larger than the mean degree 〈 k 〉≈26. Note that the gene distribution in (a) is shifted in order to allow for the inclusion of instructions with 0 degrees.
Similar to the gene degree distribution from the yeast data, we observe a scale-free distribution for the genes in Avida (γ=2.0, with ρ=−0.996), although in this case with a cut-off for high k. This cut-off (which in a non-cumulative plot corresponds to a flattening out of the curve) is due to a few essential instructions, which when knocked-out kill the organism. This means that the execution of all functions will depend on these crucial instructions, as we consider a non-viable organism incapable of performing any functions. The instructions involved in execution flow (e.g. jumps and loops in the genome) indeed have an above average connectivity (data not shown), and these contribute to the large fraction of high-degree instruction nodes in the network.
The cumulative degree distribution for the functions in Avida exhibits an exponential decay (β=0.15 with ρ=−0.993) for k larger than the average degree 〈k〉≈26. The reason for the behaviour for small k is that the rewarded functions require a minimal number of instructions (i.e. genes) to be performed, and consequently functions with a low degree are absent. The average clustering coefficient of the projected networks was 〈C〉=0.91±0.03, similar to the value obtained from the yeast metabolism. Again, we observe that the degree distributions of the network deviate from the null model, which suggests that the evolutionary dynamics of the network is governed by a different mechanism.
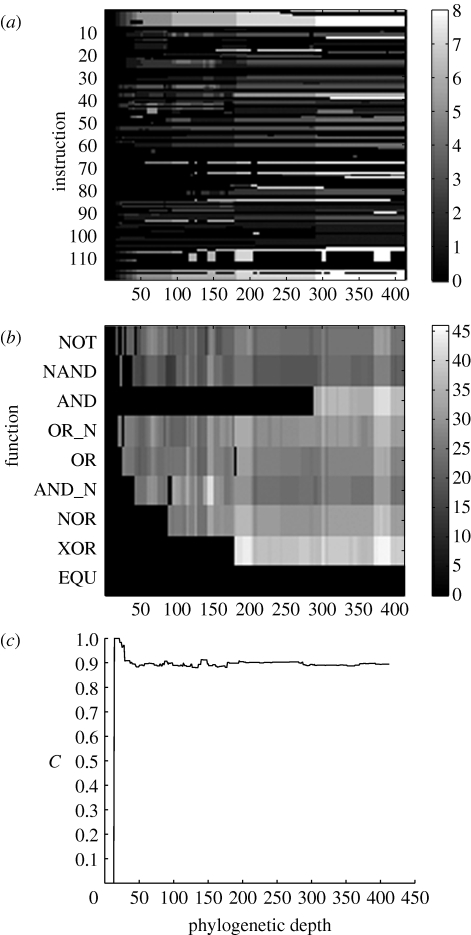
In order to further investigate the evolutionary dynamics in Avida, we made use of the fact that we can access the entire lineage of the dominant genotypes. We calculated the FGA of every organism in the lineages of the dominant genotypes and aligned them to form three-dimensional arrays (one for each lineage), where the position (i, j, k) is 1 if instruction number i was involved in function j in ancestor k in the lineage and 0 otherwise, where k is the phylogenetic depth from the initial ancestor (Lenski et al. 2003; see video in the electronic supplementary material). In order to visualize these arrays, we can project them down by summing them along the function or instruction dimension. These reduced (two-dimensional) arrays show the time development of the instruction and function degree (figure 6). From the example shown, we can observe that instructions that became involved in functions at an early stage are the ones that in the end have the highest degree (figure 6 a). The function degree distribution seems to behave in a qualitatively different way, where the degree seems to fluctuate and no increase is discernible (figure 6 b). The time-dependent FGA also allows us to track the evolution of the average clustering coefficient (of the corresponding gene–gene network) in each lineage (figure 6 c, and figure S2 in the electronic supplementary material), and reveals that, apart from an initial increase, the cluster coefficient is essentially constant during evolution (see appendix A). This is in agreement with a study of Ravasz et al. (2002), which showed that the clustering coefficient of metabolic networks is independent of network size.
Figure 6.
The evolution of the gene–function relationship for one lineage of digital organisms. (a) The FGA is summed along the function dimension showing how many functions each instruction (or gene) is involved in as a function of the phylogenetic depth in the lineage. (b) The FGA has been summed along the instruction dimension instead, showing how many instructions each function depends on. (c) The average clustering coefficient increases sharply when the first functions are acquired, but then remains essentially constant with only small fluctuations around the average.
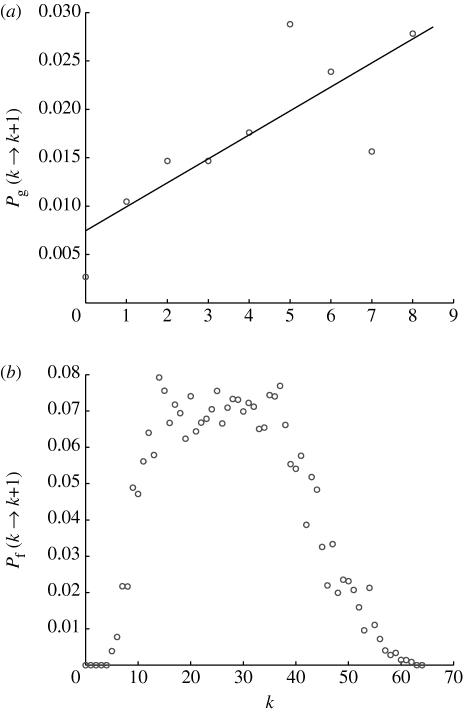
In order to quantify the changes in function/gene degree, we estimated the rate at which an instruction or function increases its degree depending on its current degree. In other words, we measured the preference function by which instructions and functions receive new links (see appendix A). The results show that, for the genes, the preference function might be approximated by an increasing linear function of the degree (ρ=0.80; figure 7 a). This agrees with the notion that instructions with high degree are more likely to become involved in new functions, and this linear form is precisely what is used in the Barabási–Alberts model to achieve a scale-free distribution. The preference function for the functions has a more complicated shape with a sharp increase for low k, a plateau for intermediate k and finally a drop-off for higher values (figure 7 b). Although there is a linear preference for low k, most functions actually emerge with a degree already in the flat region of the preference function (the average initial degree was 〈k 0〉≈27), which implies that the acquisition of new genes is essentially independent of degree and is even inhibited for larger k.
Figure 7.
The preference function for the Avida instruction and function degree dynamics. (a) The rate at which the instructions increase their degree might be approximated by a linear function of the degree, while for the functions (b) the preference function seems to be constant for intermediate k, while exhibiting a cut-off for small and large k.
3. Discussion
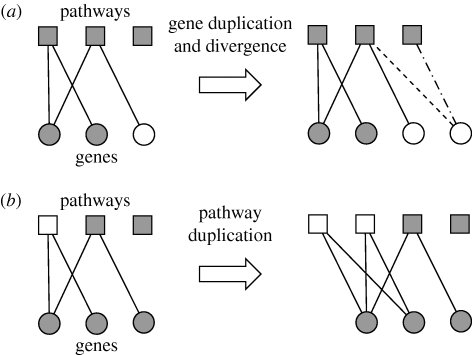
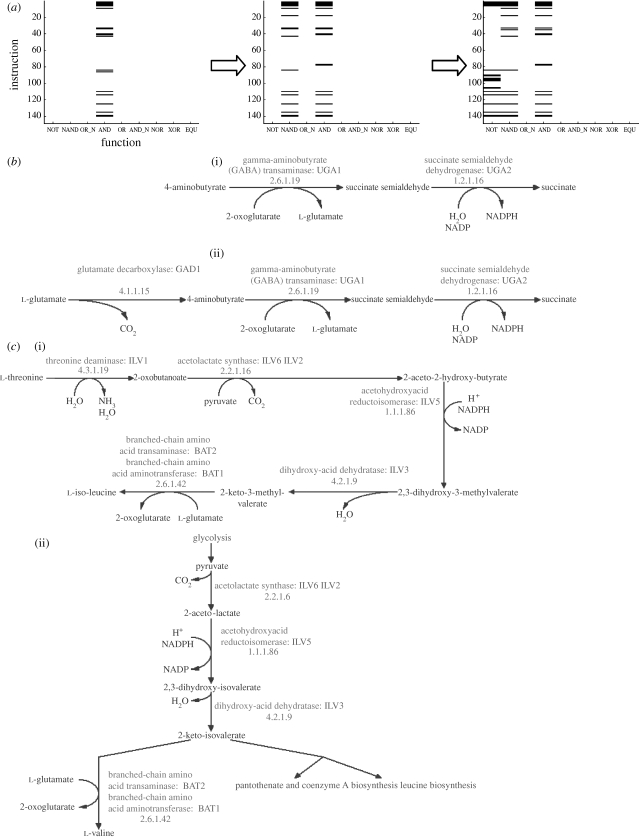
The results from the experiments with Avida agree with the results from the yeast study, where the gene–function network in the digital organisms also exhibits two distinct degree distributions; the function degree decays exponentially while the instruction degree follows a power-law distribution. Furthermore, we could show that the instructions nodes acquired new links according to a preferential attachment process, while the functions in essence were subject to random degree-independent dynamics. The preferential attachment of the instructions, and therefore the scale-free degree distribution, can be explained by invoking a process whereby an entire function becomes duplicated and extended, through a mutation, into a novel function carrying out a different computation. We can think of the new function emerging as a result of duplicating one of the function nodes in the bipartite network together with all its links (figure 8 a). If this is the case then an instruction with a high degree will be more likely to be connected to the duplicated function and consequently will be more likely to increase its connectivity. This corresponds precisely to the increasing preference function measured in Avida (figure 7 a), and is in agreement with previous studies in Avida which showed that existing functions often serve as building blocks for novel functions (Lenski et al. 2003; Gerlee & Lundh 2008). An explicit example of this process is displayed in figure 9 a, which shows the FGA within one lineage of digital organism at three crucial times in the evolutionary history. From this figure, it can clearly be seen how the instructions previously involved in the AND function also contribute to the computation of the NAND function and subsequently to the NOT function. In the network setting, this corresponds to the NAND node being an almost perfect copy (with respect to links) of the AND node, and the NOT node in turn being a copy of the NAND node, although with the loss and addition of several links. A convenient way of describing this is to say that the NAND and NOT functions were formed by duplication plus modification of existing function nodes.
Figure 8.
The growth dynamics of the gene–function network. (a) When a gene is duplicated (shown in white), it increases the degree of the pathways it is connected to, but subsequent divergence (loss and gain of functionality) rewires the gene–function network (the lost functionality is shown as a dashed line and the gained as a dot-dashed line). Through gene duplication, pathways that involve many genes are more likely to increase their degree, but the exponential pathway degree distribution suggests that the rate of gene divergence overshadows this preferential attachment effect. (b) When a pathway is duplicated (shown in white), it increases the degree of the genes involved in it. This implies that genes that are involved in many pathways are more likely to increase their degree, and this is supported by the scale-free gene degree distribution found in both yeast and digital organisms.
Figure 9.
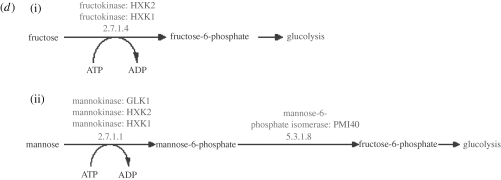
Examples of pathway duplication in (a) Avida and (b–d) yeast. (a) The evolution of the FGA within one lineage of digital organisms. These FGAs show that the instructions first involved in the AND function also contribute to the NAND function and the NOT function. With respect to the instructions that constitute them, it seems that the two subsequent functions are partial copies of the AND function, or in other words that the AND function has been duplicated to form the two other functions. (b–d) Three pairs of pathways which suggest a similar type of function duplication in yeast (downloaded from http://www.yeastgenome.org/, 18 October 2008; Christie et al. 2004). (b)(i) 4-Aminobutyrate degradation and (ii) glutamate degradation I; (c)(i) isoleucine biosynthesis and (ii) valine biosynthesis; (d)(i) fructose degradation and (ii) mannose degradation. In all these examples, the larger pathway was probably formed through the addition of one or two genes.
The function connectivity on the other hand is driven by an essentially uniform preference function (figure 7 b), which suggests that the link dynamics are more akin to the null model, which, in agreement with the Avida function degree distribution, exhibits an exponential decay (for degrees larger than the average). Although this random mechanism to some extent can explain the observed dynamics and structure, there are probably other elements that affect the evolution of the function connectivity. For example, functions that depend on many instructions are more likely to be affected by deleterious mutations, and are therefore selected against. There is also a minimal number of instructions needed to encode the Boolean functions, which sets a lower bound on the number of instructions each function depends on.
The scale-free gene degree distribution in the yeast gene–function network suggests that the process by which genes become incorporated into new pathways is subject to a similar duplication process as in the case of digital organisms. The emergence of new functions and pathways is still not well understood, but evidence suggests that metabolic pathways have evolved through the reuse of existing pathways together with the recruitment of new enzymes, denoted as ‘pathway duplication’ (Jensen 1976; Schmidt et al. 2003). This refers to the development of a new metabolic function, while the original pathway is still retained. This mechanism has also been suggested for the evolution of signalling pathways (Fryxell 1996; Caffrey et al. 1999).
Naturally, the emergence of novel pathways is triggered by genome-level changes, such as gene duplication, but the effect of these events might manifest themselves at a higher level of organization, giving rise to a phenomenon similar to the function duplication observed in Avida. A pathway is by definition a conceptual entity, created in order to categorize the vast number of chemical reactions that take place within a living cell. Although this is the case, we can still gain insight by comparing different pathways and try to describe how they relate to one another, and the concept of pathway duplication is precisely such a tool.
If pathway duplication is an active mechanism in yeast evolution then we would expect to observe overlap between some pathways with respect to the genes that constitute them. This was tested by measuring the number of pathways in the yeast dataset whose genes were completely contained within any other pathway, and comparing it with a randomly rewired version of the network with the same degree distributions (Maslov & Sneppen 2002; appendix A). In the original network, this was true for 35 out of the 122 pathways, which was significantly higher than the average of 14 in the rewired networks (Z=131, P<10−16 in a one-tailed Z-test). It should be noted that the overlap does not occur because some of the pathways in the dataset represent a different level of organization, such as superpathways (all pathways with the prefix ‘super-’ were removed in this study).
The relevance of the observed overlap of course requires a more detailed study of the pathways in question, and we shall here give three examples. The ‘4-aminobutyrate degradation’ pathway is completely contained within ‘glutamate degradation I’ (figure 9 b), the reason being that 4-aminobutyrate is an intermediate in glutamate degradation. This might seem to be an artificially created overlap, but 4-aminobutyrate can also accumulate through permease-mediated uptake (Ramos et al. 1985), which means that the two pathways actually represent different functionalities and qualify as separate units. A possible explanation for this overlapping structure is that the glutamate degradation I pathway evolved as a duplication and extension of 4-aminobutyrate degradation, mediated by the appearance of the GAD1 gene. Another example is given by the ‘valine biosynthesis’ and ‘isoleucine biosynthesis’ pathways (figure 9 c), which differ with respect to only one gene, ILV1, but exhibit different functionalities. This structure suggests that the ability to synthesize isoleucine evolved through duplication of the valine pathway with the addition of only one enzyme. A final example is given by the pathways ‘fructose degradation’ and ‘mannose degradation’ (figure 9 d). The genes involved in fructose degradation are completely contained within the ones taking part in mannose degradation, suggesting the presence of a duplication event.
However, it should be noted that our criterion of complete containment is quite strict, and two pathways would fail to show any connection if the duplicated copy acquires only one new enzyme. Another possibility that we do not take into account is divergence on the gene level, where two pathways have the same evolutionary origin, but contain paralogous enzymes (Fryxell 1996). Our method therefore most likely misses many potential duplications, and the exact relationship between different pathways requires a more thorough investigation, of which the work presented here is only the starting point.
It has been established that, in real cells, gene duplication is the main mechanism by which new genes are created (Ohno 1970; Prince & Pickett 2002; Wapinski et al. 2007). The lack of selection pressure on the newly created copy means that it can mutate and lose some of its functionality and also gain new functionality (figure 8 a). Both genome-wide experimental studies (Wagner 2001) and theoretical work on the yeast protein interaction network (Pastor-Satorras et al. 2003) have shown that the rate of gene divergence in yeast is considerable. This is in agreement with our observation that the pathway degree distribution is exponential, because if the rate of gene divergence is low (a duplicated gene maintains most of its previous functionality), a large fraction of the functions the parent gene was involved in will have their degree increased. By this mechanism, pathways that depend on many genes would have a higher chance of increasing their degree, or in other words pathways gain new links through a preferential growth process, and this would lead to a scale-free pathway degree distribution. Instead, our results suggest that duplicated genes become involved in new functions in a more random fashion, independent of their degree.
This observation points to the fact that although we observe similar degree distributions for the functions/pathways in the case of Avida and yeast, the underlying dynamics are different. In Avida there is no such thing as ‘instruction duplication’, but the instructions receive links in a uniform manner and this is what unites the two systems. More importantly, our analysis suggests that in both yeast and Avida the pathways/functions are subject to duplication dynamics, by which the organism can construct new pathways from existing building blocks. This presents an accessible way for the cell to acquire novel pathways, which in turn could make its metabolism more efficient. Precisely which pathways are selected for naturally depends on the environment in which the organism lives, which in the case of Avida we can control by changing the rewarded Boolean functions or the parameters that define the digital world, but in the case of yeast we know little about. Inferring the impact of selective forces on the observed features therefore becomes very difficult, although for Avida we can make some specific observations. For example, it is known that the mutation rate affects the structure of the gene–function network, and that a higher mutation rate results in an instruction degree distribution with a smaller slope γ (Gerlee & Lundh 2008). It is also known that highly connected instructions reduce the total number of instructions that are needed for encoding the functions, which increases copying fidelity and decreases replication time (Edlund & Adami 2004; Gerlee & Lundh 2005). This selective pressure also contributes to the decreased link attachment rate for functions with high degree. Functions that depend on many instructions are more likely to be affected by deleterious mutations, and are therefore less likely to be preserved in the population. This probably applies to yeast evolution as well, where overly complex pathways that depend on many metabolites and involve many enzymes would be negatively selected for.
4. Conclusion
In this paper, we have presented a new method of analysing gene–function dependency, which allows for a different perspective of the evolution of cellular functions. The main finding is that pathway duplication is an important mechanism in the emergence of novel metabolic pathways, both in digital organisms from the Avida platform and in yeast. This is supported by direct evidence from experiments in Avida, where the entire evolutionary history of the system can be accessed and analysed, and from the current state of the yeast metabolic gene–function network, which reveals significant overlap between different pathways.
The gene–pathway relationship is, however, just one example of how this graph theoretic approach can be used. In essence, it can be applied to any hierarchical system where the functionality at one level depends on components at a lower level of organization. One could, for example, consider a whole sequence of connected bipartite graphs describing the dependency between each level. For example, protein complexes, signalling pathways and transcriptional modules can all be described within this framework. This hierarchical network approach could therefore be helpful in understanding the organization of cellular functions and the evolution of modularity.
Acknowledgments
The authors would like to thank P. Gennemark, O. Sandberg, J. McNamara and R. Wheeler for their valuable comments. The work of P.G. and A.R.A.A. was supported by the National Cancer Institute, grant no. U54 CA 113007.
Appendix A: Materials and methods
A.1 Yeast data
The null model for the gene–function network assumes that each pair of gene and pathway in the network are linked with a given probability p. If we assume that we have N g genes and N f pathways in the network, the probability of finding a gene that is linked to k pathways is binomially distributed with
 |
A1 |
and the converse of finding a pathway that depends on k genes is given by
 |
A2 |
The link probability p can be estimated from the data as p=N e/(N g N f), where N e is the total number of edges in the real network. These distributions can, when N≥100 and Np≤10 (which is the case for the yeast data), be approximated by Poisson distributions
 |
A3 |
with parameter λ=pN f,g. The Poisson distribution in turn decays approximately exponentially with
 |
A4 |
when  , for which the genes corresponds to
  and for the pathways
  . In conclusion, we have that the suggested null model of the bipartite gene–function network should exhibit an exponential decay in both degree distributions.
From the yeast biochemical pathways dataset, the gene degree distribution (probability density function) was estimated by counting the number of genes with degree k (denoted by n
k) and dividing it by the total number of genes, i.e. p
g(k)=n
k/N
g, where N
g is the total number of genes. An identical procedure was applied to retrieve the function degree distribution p
f(k). From these, the cumulative distribution functions (CDFs)  were calculated. A linear regression, after a semi-log/log–log transformation, was then performed on the CDFs in order to estimate the parameter β/γ. In the case of a scale-free CDF with parameter γ, the corresponding degree distribution is scale-free with parameter γ+1, while for an exponential distribution the CDF and the degree distribution coincide. The clustering coefficient for node i in the one-mode network (figure 2) is defined as C
i=2n/(k
i(k
i−1)), where n is the number of links between the k
i neighbours of node i, and the average clustering coefficient 〈C〉 is obtained by averaging C
i over all nodes in the network. Note that for nodes with only one link the clustering coefficient is undefined, and these are therefore disregarded in the calculation of the average.
The randomly rewired version of the network was constructed by iterated degree preserving rewiring of the original network (Maslov & Sneppen 2002). At each iteration, two edges i→j and k→l were chosen at random and rewired so that i connects to l, and vice versa. If any of these two edges already existed, the rewiring was aborted and two new edges were chosen. The pathway overlap in the original network was compared with 1000 of these random networks each being subject to 105 rewiring iterations.
A.2 Avida
All experiments were performed with Avida v. 2.6 using the default settings. The mutations that occur in Avida are either copy mutations or insert/delete mutations. Copy mutations randomly change the copied instruction into a randomly chosen instruction (i.e. point mutation) and occurred at a rate of 0.005 per instruction copied. The other type of mutation randomly inserts or deletes instructions and occurred at a rate of 0.05 per genome copied. The ancestral genotype used in all experiments was 100 instructions long and only had the capability to self-replicate. Self-replication only requires 15 instructions and the rest were copies of a single instruction (nop-C) that does not modify the CPU when executed. The functions performed by the organisms are basic Boolean functions, such as NOT, OR and XOR, performed on 32-bit binary strings (Lenski et al. 2003; see table S2 in the electronic supplementary material). The binary strings are supplied to the organisms from an input buffer and after manipulation they are returned to an output buffer. If the output agrees with any of the rewarded functions, the organism gains energy and is executed at a higher rate. The basic unit for computation is the NAND instruction, with which the organisms can perform bitwise NOT–AND operations on the strings from the input buffer. As the NAND gate is a universal logical gate, it can be used to construct any of the rewarded functions, and the amount of CPU time gained for each function is 2n, where n is the minimum number of NAND instructions needed to perform the function. Each experiment terminated after 50 000 updates (approx. 7500 ancestral generations), after which the most abundant genotype together with its entire lineage were saved. The functional genomic arrays (FGAs) of the organisms were then calculated using the MAP_TASKS command (with the alignment flag) in Avida's analyse mode. The alignment flag was used in order to make it possible to compare genomes of varying length. The FGAs of the dominant genotypes were used to calculate the function and gene (i.e. instruction) degree distributions in exactly the same way as for the yeast biochemical pathways dataset. The time-dependent FGAs (one for each lineage) were created by aligning all the FGAs from the organisms in the lineage in the order of phylogenetic depth. These were then summed along either the instruction or function dimension to produce the plots shown in figure 6. This gives us two matrices for each lineage, F and G, which show the time evolution of the function/gene degree. The size of F is 9×n, where 9 corresponds to the number of rewarded functions and n is the total number of ancestors in the lineage. The size of G is m×n, where m is the length of the longest genome in the lineage and n again is the total number of organisms in the lineage. In order to calculate the rates p f(k→k+1) and p g(k→k+1), we calculated the difference matrix in the time dimension, i.e. ΔF t,j=F t+1,j−F t,i (correspondingly for G). We then measured the degree of the corresponding function (gene) in the positions, where ΔF t,j=1. For each k, we calculated the total number of such changes in degree and divided it by the total occurrence of that degree in the function matrix F. This gives an estimate of the rate at which functions/genes with degree k increases their degree to k+1. The change in clustering coefficient was assessed by measuring the root-mean-square deviation from the average for t∈[50,t max], where t max is the number of ancestors in the lineage, and 50 is chosen so as to avoid the initial increase in the clustering coefficient. This measure was averaged over all lineages and the result was 〈C r.m.s.〉=0.01, which suggests that the average clustering coefficient is stationary during evolution of digital organisms.
References
- Adami C.1998Introduction to artificial life New York, NY:Springer [Google Scholar]
- Adami C.2006Digital genetics: unravelling the genetic basis of evolution. Nat. Rev. Genet. 7, 109–118. 10.1038/nrg1771 [DOI] [PubMed] [Google Scholar]
- Albert R.2005Scale-free networks in cell biology. J. Cell. Sci. 118, 4947–4957. 10.1242/jcs.02714 [DOI] [PubMed] [Google Scholar]
- Barabási A.-L., Albert R.1999Emergence of scaling in random networks. Science. 286, 509–512. 10.1126/science.286.5439.509 [DOI] [PubMed] [Google Scholar]
- Barabási A.-L., Oltvai Z.2004Network biology: understanding the cell's functional organization. Nat. Rev. Genet. 5, 101–113. 10.1038/nrg1272 [DOI] [PubMed] [Google Scholar]
- Bollobas B.1985Random graphs London, UK:Academic Press [Google Scholar]
- Caffrey D. R., O'Neill L. A., Shields D. C.1999The evolution of the MAP kinase pathways: coduplication of interacting proteins leads to new signaling cascades. J. Mol. Evol. 49, 567–582. 10.1007/PL00006578 [DOI] [PubMed] [Google Scholar]
- Chen Y., Xu D.2004Global protein function annotation through mining genome–scale data in yeast Saccharomyces cerevisiae. Nucleic Acids Res. 32, 6414–6424. 10.1093/nar/gkh978 [DOI] [PMC free article] [PubMed] [Google Scholar]
- Chow S. S., Wilke C. O., Ofria C., Lenski R. E., Adami C.2004Adaptive radiation from resource competition in digital organisms. Science. 305, 84–86. 10.1126/science.1096307 [DOI] [PubMed] [Google Scholar]
- Christie K. R., et al. 2004Saccharomyces genome database (SGD) provides tools to identify and analyze sequences from Saccharomyces cerevisiae and related sequences from other organisms. Nucleic Acids Res. 32, D311–D314. 10.1093/nar/gkh033 [DOI] [PMC free article] [PubMed] [Google Scholar]
- Edlund J., Adami C.2004Evolution of robustness in digital organisms. Artif. Life. 10, 167–179. 10.1162/106454604773563595 [DOI] [PubMed] [Google Scholar]
- Erdős P., Rényi A.1960On the evolution of random graphs. Publ. Math. Inst. Hung. Acad. Sci. 5, 17–61. [Google Scholar]
- Franke L., Bakel H., Fokkens L., de Jong E. D., Egmont-Petersen M., Wijmenga C.2006Reconstruction of a functional human gene network, with an application for prioritizing positional candidate genes. Am. J. Hum. Genet. 78, 1011–1025. 10.1086/504300 [DOI] [PMC free article] [PubMed] [Google Scholar]
- Fryxell K. J.1996The coevolution of gene family trees. Trends Genet. 12, 364–369. 10.1016/S0168-9525(96)80020-5 [DOI] [PubMed] [Google Scholar]
- Gavin A., et al. 2002Functional organization of the yeast proteome by systematic analysis of protein complexes. Nature. 415, 141–147. 10.1038/415141a [DOI] [PubMed] [Google Scholar]
- Gerlee P., Lundh T.2005The genetic coding style of digital organisms. Adv. Artif. Life. 3630, 854–863. 10.1007/11553090_86 [DOI] [PubMed] [Google Scholar]
- Gerlee P., Lundh T.2008The emergence of overlapping scale-free genetic architecture in digital organisms. Artif. Life. 14, 265–275. 10.1162/artl.2008.14.3.14303 [DOI] [PubMed] [Google Scholar]
- Giot L., et al. 2003A protein interaction map of Drosophila melanogaster. Science. 302, 1727–1736. 10.1126/science.1090289 [DOI] [PubMed] [Google Scholar]
- Guelzim N., Bottani S., Bourgine P., Kepes F.2002Topological and causal structure of the yeast transcriptional regulatory network. Nat. Genet. 31, 60–63. 10.1038/ng873 [DOI] [PubMed] [Google Scholar]
- Hansen T. F.2006The evolution of genetic architecture. Annu. Rev. Ecol. Evol. Syst. 37, 123–157. 10.1146/annurev.ecolsys.37.091305.110224 [DOI] [Google Scholar]
- Hartwell L. H., Hopfield J. J., Leibler S., Murray A. W.1999From molecular to modular cell biology. Nature. 402, Suppl.C47–C52. 10.1038/35011540 [DOI] [PubMed] [Google Scholar]
- Jensen R. A.1976Enzyme recruitment in evolution of new function. Annu. Rev. Microbiol. 30, 409–425. 10.1146/annurev.mi.30.100176.002205 [DOI] [PubMed] [Google Scholar]
- Jeong H., Mason S. P., Barabási A. L., Oltvai Z. N.2001Lethality and centrality in protein networks. Nature. 411, 41–42. 10.1038/35075138 [DOI] [PubMed] [Google Scholar]
- Jordan J., Landau E., Iyengar R.2000Signaling networks: the origins of cellular multitasking. Cell. 103, 193–200. 10.1016/S0092-8674(00)00112-4 [DOI] [PMC free article] [PubMed] [Google Scholar]
- Kitano H.2002Computational systems biology. Nature. 420, 206–210. 10.1038/nature01254 [DOI] [PubMed] [Google Scholar]
- Kitano H.2004Biological robustness. Nat. Rev. Genet. 5, 826–837. 10.1038/nrg1471 [DOI] [PubMed] [Google Scholar]
- Koonin E., Wolf Y., Karev G.2006Power-laws, scale-free networks and genome biology Berlin, Germany:Springer [Google Scholar]
- Lee I., Date S. V., Adai A. T., Marcotte E. M.2004A probabilistic functional network of yeast genes. Science. 306, 1555–1558. 10.1126/science.1099511 [DOI] [PubMed] [Google Scholar]
- Lee I., Li Z., Marcotte E. M.2007An improved, bias-reduced probabilistic functional gene network of baker's yeast, Saccharomyces cerevisiae. PLoS ONE. 2, e988. 10.1371/journal.pone.0000988 [DOI] [PMC free article] [PubMed] [Google Scholar]
- Lee I., Lehner B., Crombie C., Wong W., Fraser A. G., Marcotte E. M.2008A single gene network accurately predicts phenotypic effects of gene perturbation in Caenorhabditis elegans. Nat. Genet. 40, 181–188. 10.1038/ng.2007.70 [DOI] [PubMed] [Google Scholar]
- Lenski R., Ofria C., Collier T., Adami C.1999Genome complexity, robustness and genetic interactions in digital organisms. Nature. 400, 661–664. 10.1038/23245 [DOI] [PubMed] [Google Scholar]
- Lenski R., Ofria C., Pennock R., Adami C.2003The evolutionary origin of complex features. Nature. 423, 139–144. 10.1038/nature01568 [DOI] [PubMed] [Google Scholar]
- Li S., et al. 2004A map of the interactome network of the metazoan C. elegans. Science. 303, 540–543. 10.1126/science.1091403 [DOI] [PMC free article] [PubMed] [Google Scholar]
- Maslov S., Sneppen K.2002Specificity and stability in topology of protein networks. Science. 296, 910–913. 10.1126/science.1065103 [DOI] [PubMed] [Google Scholar]
- McCraith S., Holtzman T., Moss B., Fields S.2000Genome-wide analysis of vaccinia virus protein–protein interactions. Proc. Natl Acad. Sci. USA. 97, 4879–4884. 10.1073/pnas.080078197 [DOI] [PMC free article] [PubMed] [Google Scholar]
- Newman M. E. J., Strogatz S. H., Watts D. J.2001Random graphs with arbitrary degree distributions and their applications. Phys. Rev. E. 64, 026118. 10.1103/PhysRevE.64.026118 [DOI] [PubMed] [Google Scholar]
- Ohno S.1970Evolution by gene duplication Berlin, Germany:Springer [Google Scholar]
- Pastor-Satorras R., Smith E., Sole R.2003Evolving protein interaction networks through gene duplication. J. Theor. Biol. 222, 199–210. 10.1016/S0022-5193(03)00028-6 [DOI] [PubMed] [Google Scholar]
- Prince V., Pickett F.2002Splitting pairs: the diverging fates of duplicated genes. Nat. Rev. Genet. 3, 827–837. 10.1038/nrg928 [DOI] [PubMed] [Google Scholar]
- Rain J. C., et al. 2001The protein–protein interaction map of Helicobacter pylori. Nature. 409, 211–215. 10.1038/35051615 [DOI] [PubMed] [Google Scholar]
- Ramasco J., Dorogovtsev S., Pastor-Satorras R.2004Self-organization of collaboration networks. Phys. Rev. E. 70, 036106. 10.1103/PhysRevE.70.036106 [DOI] [PubMed] [Google Scholar]
- Ramos F., el Guezzar M., Grenson M., Wiame J.1985Mutations affecting the enzymes involved in the utilization of 4-aminobutyric acid as nitrogen source by the yeast Saccharomyces cerevisiae. Eur. J. Biochem. 149, 401–404. 10.1111/j.1432-1033.1985.tb08939.x [DOI] [PubMed] [Google Scholar]
- Ravasz E., Somera A. L., Mongru D. A., Oltvai Z. N., Barabási A.-L.2002Hierarchical organization of modularity in metabolic networks. Science. 297, 1551–1555. 10.1126/science.1073374 [DOI] [PubMed] [Google Scholar]
- Schmidt S., Sunyaev S., Bork P., Dandekar T.2003Metabolites: a helping hand for pathway evolution?. Trends Biochem. Sci. 28, 336–341. 10.1016/S0968-0004(03)00114-2 [DOI] [PubMed] [Google Scholar]
- Shen-Orr S., Milo R., Mangan S., Alon U.2002Network motifs in the transcriptional regulation network of Escherichia coli. Nat. Genet. 31, 64–68. 10.1038/ng881 [DOI] [PubMed] [Google Scholar]
- Tanaka R., Yi T.-M., Doyle J.2005Some protein interaction data do not exhibit power law statistics. FEBS Lett. 579, 5140–5144. 10.1016/j.febslet.2005.08.024 [DOI] [PubMed] [Google Scholar]
- Teichmann S. A., Babu M. M.2004Gene regulatory network growth by duplication. Nat. Genet. 36, 492–496. 10.1038/ng1340 [DOI] [PubMed] [Google Scholar]
- Troyanskaya O. G., Dolinski K., Owen A. B., Altman R. B., Botstein D.2003A Bayesian framework for combining heterogeneous data sources for gene function prediction (in Saccharomyces cerevisiae). Proc. Natl Acad. Sci. USA. 100, 8348–8353. 10.1073/pnas.0832373100 [DOI] [PMC free article] [PubMed] [Google Scholar]
- Wagner A.2001The yeast protein interaction network evolves rapidly and contains few redundant duplicate genes. Mol. Biol. Evol. 18, 1283–1292. [DOI] [PubMed] [Google Scholar]
- Wapinski I., Pfeffer A., Friedman N., Regev A.2007Natural history and evolutionary principles of gene duplication in fungi. Nature. 449, 54–61. 10.1038/nature06107 [DOI] [PubMed] [Google Scholar]


