Abstract
The search for general mechanisms of community assembly is a major focus of community ecology. The common practice so far has been to examine alternative assembly theories using dichotomist approaches of the form neutrality versus niche, or compensatory dynamics versus environmental forcing. In reality, all these mechanisms will be operating, albeit with different strengths. While there have been different approaches to community structure and dynamics, including neutrality and niche differentiation, less work has gone into separating out the temporal variation in species abundances into relative contributions from different components. Here we use a refined statistical machinery to decompose temporal fluctuations in species abundances into contributions from environmental stochasticity and inter-/intraspecific interactions, to see which ones dominate. We apply the methodology to community data from a range of taxa. Our results show that communities are largely driven by environmental fluctuations, and that member populations are, to different extents, regulated through intraspecific interactions, the effects of interspecific interactions remaining broadly minor. By decomposing the temporal variation in this way, we have been able to show directly what has been previously inferred indirectly: compensatory dynamics are in fact largely outweighed by environmental forcing, and the latter tends to synchronize the population dynamics.
Keywords: community drivers, compensatory dynamics, density dependence, environmental stochasticity, neutrality, niche
1. Introduction
All natural populations fluctuate in abundance due to environmental stochasticity, demographic stochasticity and density-dependent regulation (Lande et al. 2003; Wilson & Lundberg 2006). Some form of density dependence seems inevitable (Cooper 2003), but deciding how strongly density dependence affects a population's dynamics can ultimately only be done with empirical studies. Species also exist as part of communities, so between-species interactions may be important as well (Bower 1962; Murdock 1994; Shorrocks & Sevenster 1995; Miyashita 2001; Viljugrein et al. 2005).
A major focus of community ecology is to identify the assembly rules that shape species assemblages, as well as any exogenous factors that the rules act with to create and maintain a community. The common practice so far has been to examine alternative assembly theories using dichotomist approaches of the form neutrality versus niche (e.g. Fargione et al. 2003) or compensatory dynamics versus environmental forcing (Houlahan et al. 2007). But in reality all these forces will be operating (e.g. Chave et al. 2002), albeit with different strengths.
While there have been different approaches to community structure and dynamics, encompassing neutral mechanisms (Caswell 1976; Bell 2000; Hubbell 2001) and niche differentiation (Gause 1934; Hutchinson 1957; Armstrong & McGehee 1980), less work has gone into separating out the temporal variation in species abundances into contributions from different factors.
Neutral models assume that all individuals of interacting species at a single trophic level are ecologically equivalent. In reality, ecological communities are shaped by several factors: individuals interact with conspecifics and with individuals of other species, and species respond to abiotic influences (e.g. Enquist et al. 2002). These factors act in concert with demographic stochasticity to generate population fluctuations in both time and space (Ylikarjula 2000), fluctuations that neutral theory is unable to replicate (Mutshinda et al. 2008). Consequently, a central problem for understanding community dynamics is to determine how strong (relatively) these different factors are. Here we decompose temporal fluctuations in species abundances into contributions from different factors—namely environmental stochasticity and intra-/interspecific interactions—to find which ones dominate the dynamics.
2. Material and methods
(a). Description of data
We used community time series from a range of taxa: moths, fishes, macrocrustaceans, birds and rodents. For all of the datasets, the sampling methods were consistent over time and the data are recorded as counts of individuals. The moth data consist of yearly totals of light-trapping counts of 12 common noctuid moths from the Rothamsted Insect Survey in the UK (Woiwod & Harrington 1994). The data span a 40-year period (1964 to 2003) and come from the Geescroft I station, in a small piece of woodland on Rothamsted Farm in Hertfordshire, UK (Woiwod & Gould 2008). The fish and crustacean data both come from Hinkley Point in the Bristol Channel, UK and were collected between 1981 and 2001 (the methods are described further in Henderson & Holmes 1990). The data contain the nine and seven most common fish and crustacean species, respectively. The bird data consist of yearly abundances of five species at Hubbard Brook Experimental Forest, an area of land in central New Hampshire, USA that functions as an outdoor laboratory for ecological studies. The data cover a 16-year period, 1969–1984 (Holmes et al. 1986). The rodent data come from trapping webs throughout the Sevilleta National Wildlife Refuge in central New Mexico, USA over the period 1989–2003. At each site, three sampling webs were sampled for three consecutive nights (Friggens 2006). This replicated feature allows us to estimate the sampling variation.
Species that were not regularly observed (i.e. that only had abundances of zero or one individual) were left out of all of the datasets. It is also assumed that each yearly sample was collected using the same effort and method, so that the time series reflect real temporal change in abundance at one locality. Species' scientific names, common names, taxa and sampling periods, as well as mean population densities and standard deviations, are given in table S1 in the electronic supplementary material.
(b). Model specification
The underlying model assumed for the abundance of species i at time t, Ni,t, is a discrete-time stochastic Gompertz model (e.g. Saitoh et al. 1997; Ives et al. 2003; Jacobson et al. 2004; Dennis et al. 2006), including the effects of interactions with other species. That is,
 |
2.1 |
where ri and ki are respectively the intrinsic growth rate and the natural logarithm of the carrying capacity of species i; αi,j is the coefficient of interaction between species i and j, replicating the per capita effect of species j on the growth of species i from time (t−1) to time t; with all intraspecific coefficients, αi,i, set to 1. Environmental noise enters the dynamics through the zero-mean Gaussian random shocks ei,t. If we denote by ni,t the natural logarithm of Ni,t, then, on the natural logarithmic scale, equation (2.1) reads as follows:
 |
2.2 |
The community model can be compactly written in matrix form as
| 2.3 |
where nt is the vector of log-abundances of all the S species at time t, R is an S×S diagonal matrix with intrinsic growth rates ri on the diagonal, 1S is the S-dimensional vector with all elements equal to 1 and  . Thus, elements on the leading diagonal of A are inverse carrying capacities, and off-diagonal terms are the interaction coefficients between species, scaled by the carrying capacity of the focal species (i.e. species i for Ai,j).
  is the vector of zero-mean environmental disturbances with one element by population, which are assumed to be serially independent and multivariate normally distributed, with a covariance matrix denoted by C (e.g. Ives et al. 2003; Ripa & Ives 2003). The off-diagonal terms of the ‘environmental covariance matrix’ C represent the common responses of different species to the environment. Subsequently,
  quantifies the correlation between the responses of species i and j to environmental fluctuations.
We would expect many off-diagonal terms of A to be at or close to zero (i.e. there would be no interaction between the species), owing to the documented predominance of weak interspecific interactions (e.g. Kokkoris et al. 1999; Turnbull et al. 2005). Therefore we used stochastic search variable selection (SSVS; George & McCulloch 1993) to identify the set of non-zero interactions.
SSVS is based on letting regression coefficients to be in two states: either they are close to zero, and hence have no significant effect on the model, or they are estimated freely. This is done by modelling a binary indicator gi,j for i≠j, and assuming  , with gi,j=1 when species j is included in the dynamics of species i and gi,j=0 otherwise. This controls the (prior) variance of the interaction coefficient αi,j: αi,j is assumed to be normally distributed with mean 0 and variance τi,j, and we let
  . The non-negative numbers q1 and q2 are selected so that the prior distribution of αi,j is wide under inclusion of species j in the dynamics of species i and forced to be close to zero if species j is excluded (i.e. q2 should be large and q1 small). If inclusion of species j in the dynamics of species i is not supported by the data, the prior with variance q1 will tend to be selected more often than the prior with variance q2, and vice versa. For the purposes of our analysis, we took q1=0.01, q2=10, and set the prior probability of a non-zero interspecies interaction (i.e. p) to 0.2. We used Bayes factors (BFs) to evaluate the amount of evidence in the data in favour of any particular interspecific interaction. Since
  , the BF is the factor by which the data change the prior odds of including versus not including a particular interspecific interaction into posterior odds. A BF that is larger than 1 suggests that the event is more probable than previously thought, and vice versa.
It follows from equation (2.3) that the variance–covariance matrix, V, of temporal fluctuations in species abundances can be decomposed (e.g. Ripa & Ives 2003) as
 |
2.4 |
where  ; that is,
  and
and  .
.
Consequently, the temporal variances of individual species abundances (diagonal elements of V) can be decomposed into the contributions  ,
,  and ci,i, from intraspecific interactions, interspecific interactions and environmental forcing, respectively.
Population abundance time series are often fraught with sampling errors (e.g. Clark & Bjørnstad 2004). In a state-space framework, ni,t is related to its observed counterpart, xi,t, through a sampling model. Here we assume that
 |
2.5 |
where si,t is the standard error of xi,t as an estimate of ni,t.
(c). Model fitting
The model was fitted to the data with a Bayesian approach (Gelman et al. 2003; McCarthy 2007) using Markov chain Monte Carlo (MCMC) methods (Gilks et al. 1996) through the Bayesian freeware OpenBUGS (Thomas et al. 2006). We placed on C an inverse Wishart prior  with scale matrix w and the smallest possible number of degrees of freedom (i.e.
  ) as an attempt to impose non-informativeness. The elements of W were set as wi,i=1 and wi,j≠i=0. All intrinsic growth rates ri were assigned independent
  priors, where I(.) denotes the indicator function. The log-carrying capacities, ki, were assigned
  priors, with suitably selected hyper-parameters li and ui to constrain ki to the range of the data for identifiability.
We used the replicated feature of the rodent dataset to derive estimates of sampling errors si,t=si as 0.223 for Dipodomys ordii, 0.141 for Dipodomys spectabilis and 0.36 for Perognathus flavus. We used the model with and without sampling error to fit the rodent data, but the results were similar. Given the larger sample sizes and longer observational periods for the other datasets used here, we expected the amount of sampling variation to be similar or less. Hence, we fitted the ‘process-error-only’ version of the model to all these datasets.
For each dataset, we ran 60 000 iterations of three MCMC with a burn-in period of 15 000 iterations, and thinned the chains to every 25th observation. The results were broadly robust to changes in the range of hyper-parameters. We checked the model adequacy by comparing posterior predictive distributions of future data to the data that have actually occurred (Rubin 1984). For all datasets analysed, the data were consistent under the posterior predictive distributions, as exemplified by fig. S1 in the electronic supplementary material, where the rodent dataset is used for illustration, suggesting that our model adequately describes the data.
3. Results
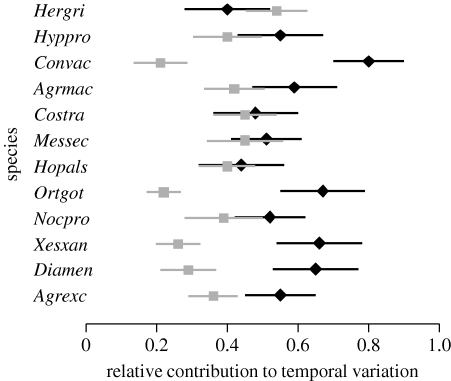
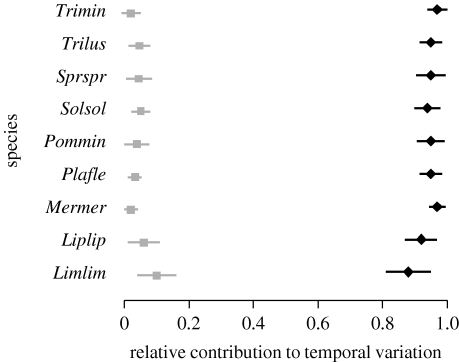
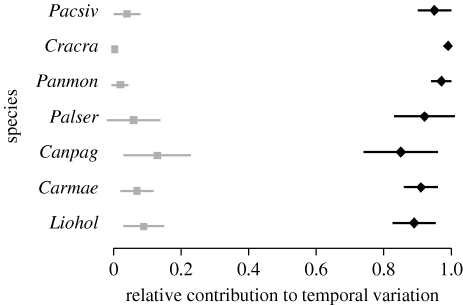
In all of the datasets, the dynamics were largely dominated by environmental stochasticity, which accounted for between 40 and 95 per cent of the temporal variances in individual species' abundances (figures 1–3; figs S2–S3 in the electronic supplementary material). Much of the remaining variation was due to intraspecific interactions, explaining between 11 and 54 per cent of variation in individual moth species, between 2 and 10 per cent in fish species, between 6 and 15 per cent in macrocrustaceans, between 1 and 17 per cent in birds, and between 11 and 37 per cent in rodents. Interspecific interactions were found to be broadly weak: they explained less than 10 per cent of the temporal variation, and the BFs for the individual interaction coefficients to be non-zero were generally between 0.002 and 1.25.
Figure 1.
Error bars (posterior mean±1 s.d.) for the proportions of temporal variation attributable to environmental forcing (black diamonds) and to intraspecific interactions (grey boxes) in the dynamics of individual moth species.
Figure 2.
Error bars (posterior mean±1 s.d.) for the proportions of temporal variation attributable to environmental forcing (black diamonds) and to intraspecific interactions (grey boxes) in the dynamics of individual fish species.
Figure 3.
Error bars (posterior mean±1 s.d.) for the proportions of temporal variation attributable to environmental forcing (black diamonds) and to intraspecific interactions (grey boxes) in the dynamics of individual crustacean species.
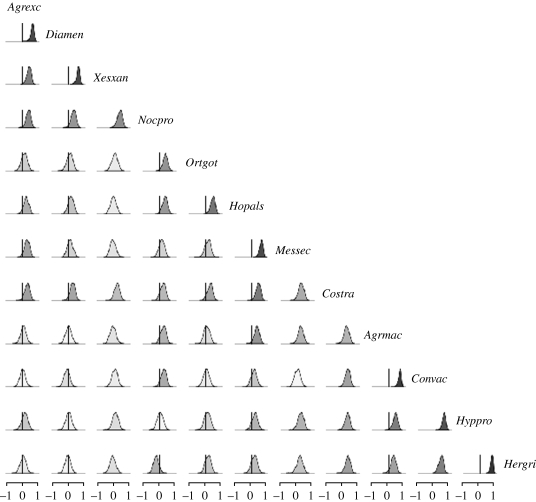
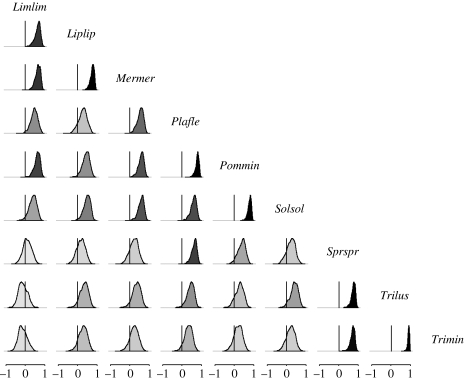
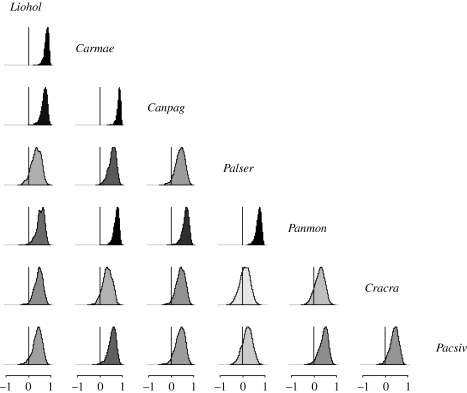
The environmental correlations were, on average, either zero or positive for most of the datasets examined (figures 4–6), with posterior means lying between 0.00 and 0.70. However, some negative correlations were detected in the bird and the rodent communities (see figs S4–S5 in the electronic supplementary material).
Figure 4.
Posterior densities of environmental correlations for the moth data; darker shading corresponds to a correlation with a posterior mean further from 0.
Figure 5.
Posterior densities of environmental correlations for the fish data; darker shading corresponds to a correlation with a posterior mean further from 0.
Figure 6.
Posterior densities of environmental correlations for the crustacean data; darker shading corresponds to a correlation with a posterior mean further from 0.
Incorporation of sampling variation into the model for the rodent data did not change inference, as sampling variation only accounted for less than 9 per cent of the total variance (fig. S3 in the electronic supplementary material).
4. Discussion
Our results show directly that environmental stochasticity is a major driver of biodiversity patterns, as previously only inferred from indirect analyses (e.g. Steele 1985; Lawton 1988; Dornelas et al. 2006; Angela et al. 2007; Houlahan et al. 2007).
Our results also support the suggestions of Angela et al. (2007), Houlahan et al. (2007) and Loreau & de Mazancourt (2008), among others, that environmental forcing broadly dominates compensatory dynamics in driving temporal fluctuations in species abundance, and that the pervasive positive correlations in species abundances are presumably environment-induced.
Ripa & Ives (2003) have looked at the dynamics of communities with correlated environments. When the interactions between species are negligible (i.e. αi,j≅0, as we found), it follows from equation (2.4) that  , i,j=1, …, S and the correlation, φi,j, between the densities of species i and j is related to the environmental correlation, ρi,j, through
 |
4.1 |
(eqn (5) in Ripa & Ives 2003), where
 |
and bi,i is defined as in equation (2.4).
When species have similar dynamics (i.e. when  ), the correlation between population densities is the same as the correlation in environmental noise, and is lower when the dynamics of the species are different. We found that the dynamics are fairly different, with the term θi,j in equation (4.1) ranging between 0.70 and 1. Hence, even when there are no direct interactions between species, the correlation between population densities is not a good estimate of the environmental correlation. Houlahan et al. (2007) found that correlations between population densities tended to be positive. If our results can be extrapolated to their study (i.e. we can assume that species' interactions are negligible, and variation between species' dynamics is large), we can conclude that the correlations they report broadly underestimate the correlations in species' responses to the environment.
Here we ascribed any unexplained variance as environmental. Clearly, a better approach would be to model the effect of the key environmental drivers (e.g. Ives 1995; Saether et al. 2000). However, this would require a larger effort, as the drivers are almost certainly different in the different communities, and indeed for different species in each community. Thus, we have concentrated on finding out how general our results are across different communities.
If the residual variance is not environmental variation, what could it be? For most of the datasets, it will include some sampling variation. However, we expect this to be relatively small for two reasons. Our direct evidence is that the results from the rodent dataset, where we could estimate the sampling variability, are consistent with the other results: the environmental variation still explains 57 to 87 per cent of the variation versus 0.1 to 9 per cent for sampling error (fig. S3 in the electronic supplementary material). Indirectly, we would expect the amount of sampling variation to be similar or less for other datasets we used, as their sample sizes are larger and the data span longer observation periods. However, even if the sampling variation was significantly larger, our conclusions would still hold.
The environmental variance may also be inflated by some interspecific interactions. Not all species in the community were included in the analysis, so there may be strong interactions with unseen species. Indeed, it would seem odd if there were no such interactions. In particular, species at different trophic levels (e.g. predators, parasitoids or host plants for the moths) would be expected to have an effect. Similarly, we might expect competition with other species that share a common host resource. The variation in the dynamics induced by these missing interactions will appear in our model as environmental fluctuations. Of course, it could also be argued that they genuinely are environmental effects, as they are part of the biotic environment of the community.
Our finding that environmental variation rather than interspecific competition dominates the dynamics in a diverse range of communities has important implications for the way we see the communities. The communities are not very stable, with the abundances able to bounce around as the environment buffets them. There is still some density dependence, which keeps the populations in check within some bounds, but these are generous.
We found little evidence for interspecific interactions affecting the temporal variation. This contrasts with studies using manipulative experiments (i.e. exclusions; e.g. Brown & Davidson 1997). This may partly be because manipulative experimental studies tend to overestimate the strength of interspecific interaction (but see Turnbull et al. 2005). It may also be because manipulative studies typically ask slightly different questions. They are usually carried out by excluding species and seeing the effect this has on the community (e.g. Heske et al. 1994; Brown & Davidson 1997). However, this is a test of the effect of interspecific competition on demarcating species' niches (e.g. their geographical range limits). Our study examines species within their realized niches, where the strength of interspecific competition typically fades out, and its role in driving year-to-year fluctuations in species abundances remains minor. If we are to understand what drives the dynamics in natural systems, we need to use observations of natural systems.
Here we have been able to decompose the temporal variation in species abundances into contributions from environmental fluctuations and intra- and interspecific competition, making the evaluation of the relative strengths of each component possible. This requires both sophisticated statistical machinery and, of equal importance, high quality community data collected over long periods of time.
Acknowledgments
We wish to thank the associate editor, two anonymous reviewers and Rampal Etienne for their constructive comments on the manuscript. We are grateful to Pisces Conservation Ltd for making the Hinkley fish and crustacean data available, and to the Sevilleta Long Term Research Project for the rodent data. The bird data were obtained by scientists of the Hubbard Brook Ecosystem Study. Rothamsted Research is grant-aided by the UK Biotechnology and Biological Sciences Research Council. The Academy of Finland (project no. 205371) provided funding for this research to C.M.M. and R.B.O.
References
- Angela D.K., Yannerell A., Rusak J.A., Tripett E.W., McMahon K.D.2007Synchrony in aquatic microbial community dynamics. ISME J 1, 38–47 (doi:10.1038/ismej.2007.6) [DOI] [PubMed] [Google Scholar]
- Armstrong R.A., McGehee R.1980Competitive exclusion. Am. Nat 115, 151–170 (doi:10.1086/283553) [Google Scholar]
- Bell G.2000Distribution of abundance in neutral communities. Am. Nat 155, 606–617 (doi:10.1086/303345) [DOI] [PubMed] [Google Scholar]
- Bower L.P.1962Evidence for interspecific competition in natural populations of the monarch and queen butterflies, Danaus plexippus and D. gilippus berenice in south central Florida. Ecology 43, 549–552 (doi:10.2307/1933390) [Google Scholar]
- Brown J.H., Davidson D.W.1997Competition between seed-eating rodents and ants in desert ecosystems. Science 196, 880–882 (doi:10.1126/science.196.4292.880) [DOI] [PubMed] [Google Scholar]
- Caswell H.1976Community structure: a neutral model analysis. Ecol. Monogr 46, 327–354 (doi:10.2307/1942257) [Google Scholar]
- Chave J., Muller-Landau H.C., Levin S.A.2002Comparing classical community models: theoretical consequences for patterns of diversity. Am. Nat 159, 1–23 (doi:10.1086/324112) [DOI] [PubMed] [Google Scholar]
- Clark J.S., Bjørnstad O.N.2004Population time series: process variability, observation errors, missing values, lags and hidden states. Ecology 85, 3140–3150 (doi:10.1890/03-0520) [Google Scholar]
- Cooper G.J.2003The science of the struggle for existence Cambridge, UK: Cambridge University Press [Google Scholar]
- Dennis B., Ponciano J.M., Lele S.R., Taper M.L., Staples D.F.2006Estimating density dependence, process noise and observation error. Ecology 76, 323–341 (doi:10.1890/0012-9615(2006)76%5B323:EDDPNA%5D2.0.CO;2) [Google Scholar]
- Dornelas M., Connoly S.R., Hughes T.P.2006Coral reef diversity refutes the neutral theory of biodiversity. Nature 440, 80–82 (doi:10.1038/nature04534) [DOI] [PubMed] [Google Scholar]
- Enquist B.J., Sanderson J., Weiser M.D.2002Modeling macroscopic patterns in ecology. Science 295, 1835–1837 (doi:10.1126/science.295.5561.1835c) [DOI] [PubMed] [Google Scholar]
- Fargione J., Brown C.S., Tilman D.2003Community assembly and invasion: an experimental test of neutral versus niche processes. Proc. Natl Acad. Sci. USA 100, 8916–8920 [DOI] [PMC free article] [PubMed] [Google Scholar]
- Friggens M.2006Sevilleta small mammal population data SEV008. See http://sevilleta.unm.edu/data/.
- Gause G.F.The struggle for existence. In Hafner Publishing Company 1934New York, NY:Hafner Publishing Company [Google Scholar]
- Gelman A., Carlin J.B., Stern H.S., Rubin D.B.2003Bayesian data analysis. 2nd edn.New York, NY: Chapman and Hall [Google Scholar]
- George E.I., McCulloch R.E.1993Variable selection via Gibbs sampling. J. Am. Stat. Assoc 88, 881–889 (doi:10.2307/2290777) [Google Scholar]
- Gilks W. R., Richardson S., Spiegelhalter D. J. (eds) 1996Markov Chain Monte Carlo in practice London, UK: Chapman and Hall [Google Scholar]
- Henderson P.A., Holmes R.H.A.1990Population stability over a ten year period in the short-lived fish Liparis liparis. J. Fish Biol 37, 605–615 [Google Scholar]
- Heske E.J., Brown J.H., Mistry S.1994Long-term experimental study of a Chihuahuan Desert rodent community: 13 years of competition. Ecology 75, 438–445 (doi:10.2307/1939547) [Google Scholar]
- Holmes R.T., Sherry T.W., Sturges F.W.1986Bird community dynamics in a temperate deciduous forest: long-term trends at Hubbard Brook. Ecol. Monogr 56, 201–220 (doi:10.2307/2937074) [Google Scholar]
- Houlahan J.E., et al. 2007Compensatory dynamics are rare in natural ecological communities. Proc. Natl Acad. Sci. USA 104, 3273–3277 (doi:10.1073/pnas.0603798104) [DOI] [PMC free article] [PubMed] [Google Scholar]
- Hubbell S.P.2001The unified neutral theory of biodiversity and biogeography. Princeton, NJ: Princeton University Press [Google Scholar]
- Hutchinson G. E.1957Concluding remarks. In Cold Spring Harbor Symp. on Quantitative Biology, vol. 22, pp. 415–425 [Google Scholar]
- Ives A.R.1995Predicting the response of population to environmental change. Ecology 76, 926–941 (doi:10.2307/1939357) [Google Scholar]
- Ives A.R., Dennis K., Cottingham K.L., Carpentier S.R.2003Estimating community stability and ecological interactions from time series data. Ecol. Monogr 73, 301–330 (doi:10.1890/0012-9615(2003)073[0301:ECSAEI]2.0.CO;2) [Google Scholar]
- Jacobson A.R., Provenzale A., von Hardenberg A., Bassano B., Festa-Bianchet M.2004Climate forcing and density dependence in a mountain ungulate population. Ecology 85, 1598–1610 (doi:10.1890/02-0753) [Google Scholar]
- Kokkoris G.D., Troumbis A.Y., Lawton J.H.1999Patterns of species interaction in assembled theoretical competition communities. Ecol. Lett 2, 70–74 (doi:10.1046/j.1461-0248.1999.22058.x) [Google Scholar]
- Lande R., Engen S., Saether B.-E.2003Stochastic population dynamics in ecology and conservation. Oxford, UK: Oxford University Press [Google Scholar]
- Lawton J.H.1988Population dynamics: more time means more variation. Nature 334, 563 (doi:10.1038/334563a0) [Google Scholar]
- Loreau M., de Mazancourt C.2008Species synchrony and its drivers: neutral and nonneutral community dynamics in fluctuating environments. Am. Nat 172, E48–E66 (doi:10.1086/589746) [DOI] [PubMed] [Google Scholar]
- McCarthy M.2007Bayesian methods in ecology. New York, NY: Cambridge University Press [Google Scholar]
- Miyashita T.2001Competition for a limited space in kleptoparasitic Argyrodes spiders revealed by field experiments. Popul. Ecol 43, 97–103 (doi:10.1007/PL00012020) [Google Scholar]
- Murdock W.W.1994Population regulation in theory and practice. Ecology 75, 271–287 (doi:10.2307/1939533) [Google Scholar]
- Mutshinda C.M., O'Hara R.B., Woiwod I.P.2008Species abundance dynamics under neutral assumptions: a Bayesian approach to the controversy. Funct. Ecol 22, 340–347 (doi:10.1111/j.1365-2435.2007.01358.x) [Google Scholar]
- Ripa J., Ives A.R.2003Food web dynamics and autocorrelated environments. Theor. Popul. Biol 64, 369–384 (doi:10.1016/S0040-5809(03)00089-3) [DOI] [PubMed] [Google Scholar]
- Rubin D.B.1984Bayesianly justifiable and relevant frequency calculations for the applied statistician. Ann. Stat 12, 1151–1172 (doi:10.1214/aos/1176346785) [Google Scholar]
- Saether B.-E., Tufto J., Engen S., Jerstad K., Røstad O.W., Skåtan J.E.2000Population dynamical consequences of climate change for a small temperate songbird. Science 287, 854–856 (doi:10.1126/science.287.5454.854) [DOI] [PubMed] [Google Scholar]
- Saitoh T., Stenseth N.C., Bjørnstad O.N.1997Density dependence in fluctuating grey-sided vole populations. J. Anim. Ecol 66, 14–24 (doi:10.2307/5960) [Google Scholar]
- Shorrocks B., Sevenster J.G.1995Explaining local species diversity. Proc. R. Soc. Lond. B 260, 305–309 (doi:10.1098/rspb.1995.0096) [DOI] [PubMed] [Google Scholar]
- Steele J.H.1985A comparison of terrestrial and marine ecological systems. Nature 313, 355–358 (doi:10.1038/313355a0) [Google Scholar]
- Thomas A., O'Hara R.B., Ligges U., Sturtz S.2006Making BUGS open. R News 6, 12–17 [Google Scholar]
- Turnbull L.A., Manley L., Rees M.2005Niches, rather than neutrality, structure a grassland pioneer guild. Proc. R. Soc. B 272, 1357–1364 (doi:10.1098/rspb.2005.3084) [DOI] [PMC free article] [PubMed] [Google Scholar]
- Viljugrein H., Stenseth N.C., Smith G.W., Steinbakk G.H.2005Density dependence in North American ducks. Ecology 86, 245–254 (doi:10.1890/04-0467) [Google Scholar]
- Wilson W.G., Lundberg P.2006Non-neutral dynamics: empirical predictions for ecosystem function and diversity from linearized consumer–resource interactions. Oikos 114, 71–83 (doi:10.1111/j.2006.0030-1299.14558.x) [Google Scholar]
- Woiwod I.P., Gould P.J.L.2008Long-term moth studies at Rothamsted. In The moths of Hertfordshire (ed. Plant C.W.), pp. 31–44 Welwyn Garden City, UK: Hertfordshire Natural History Society [Google Scholar]
- Woiwod I.P., Harrington R.1994Flying in the face of change: the Rothamsted insect survey. In Long-term experiments in agricultural and ecological sciences (eds Leigh R.A., Johnston A.E.) pp. 321–342 Wallingford, UK: CAB International [Google Scholar]
- Ylikarjula J.2000Nonlinearity and environmental stochasticity in ecological interactions. Doctoral thesis, Helsinki University of Technology, Finland [Google Scholar]


