

Abstract
Cellular life is a highly redundant complex system; yet, the evolutionary maintenance of the redundancy remains unexplained. Using a systems biology approach, we infer that 37–47% of metabolic reactions in Escherichia coli and yeast can be individually removed without blocking the production of any biomass component under any nutritional condition. However, the majority of these redundant reactions are preserved because they have differential maximal efficiencies at different conditions or their loss causes an immediate fitness reduction that can only be regained via mutation, drift, and selection in evolution. The remaining redundancies are attributable to pleiotropic effects or recent horizontal gene transfers. We find that E. coli and yeast exhibit opposite relationships between the functional importance and redundancy level of a reaction, which is inconsistent with the conjecture that redundancies are preserved as an adaptation to back up important parts in the system. Interestingly, the opposite relationships can both be recapitulated by a simple model in which the natural environments of the organisms change frequently. Thus, adaptive backup is neither necessary nor sufficient to explain the high redundancy of cellular metabolic networks. Taken together, our results strongly suggest that redundant reactions are not kept as backups and that the genetic robustness of metabolic networks is an evolutionary by-product.
Keywords: systems biology, redundancy, metabolic network, yeast, E. coli
Introduction
Functional redundancy refers to the situation where one part in a system can completely or partially compensate the loss of another (Hartman et al. 2001; Wagner 2005a). Due to the existence of functionally redundant parts, a system may exhibit no or only mild phenotypic changes upon malfunction of a part. In biological systems, functional redundancy may occur at the component level (Wagner 2005a), exemplified by isoenzymes, which are generated by gene duplication and differ in protein sequence but catalyze the same biochemical reactions in an organism (Gu et al. 2003; Conant and Wagner 2004; DeLuna et al. 2008). Functional redundancy may also occur at the systems level due to distributed properties of networks (Hartman et al. 2001; Wagner 2005a). For example, glucose-6-phosphate dehydrogenase and D-ribulose-5-phosphate 3-epimerase catalyze distinct reactions and are located in alternative pentose phosphate pathways in yeast; simultaneous removal of the two enzymes is lethal, although individual removal of either enzyme is not (Harrison et al. 2007). Although functional redundancy at the component level has been extensively studied in model organisms (Gu et al. 2003; Conant and Wagner 2004; Liang and Li 2007; Liao and Zhang 2007; Dean et al. 2008; DeLuna et al. 2008; Musso et al. 2008), redundancy at the systems level is poorly understood and thus is the focus of the present study.
An important consequence of functional redundancy is robustness against genetic perturbations such as deleterious mutations. Genetic robustness is a characteristic of cellular life, observed in all domains of life and at many levels of biological organizations, from DNA replication, transcription, and translation to metabolism, cell cycle, and embryonic development (de Visser et al. 2003; Wagner 2005c; Lenski et al. 2006). Despite the apparent importance of functional redundancy and genetic robustness to development and health, their evolutionary preservation remains enigmatic (de Visser et al. 2003). This is because mutations that destroy redundancies occur repeatedly and are normally invisible to natural selection, such that redundancies are evolutionarily unstable and are destined to be lost (Clark 1994) except under special circumstances (Nowak et al. 1997). One hypothesis asserts that redundancies are favored by natural selection to ensure optimal performance through backing up important parts of a biological system when the system is attacked by mutations (de Visser et al. 2003), which we refer to as the adaptive backup hypothesis. But this hypothesis requires a very high rate of deleterious mutation that is not commonly observed in cellular organisms (de Visser et al. 2003; Wagner 2005c).
To identify the evolutionary forces that preserve systems-level redundancies and to understand the origin of genetic robustness, we here take advantage of recent genomic reconstructions of metabolic networks of model organisms and analyze metabolic redundancies using rigorous systems-level flux balance analysis (FBA) (Price et al. 2004) and its derivatives (Segre et al. 2002). The metabolic networks are collections of biochemical reactions used to synthesize biomass, which is made up of multiple components such as amino acids and nucleotides. Based on the stoichiometric associations among metabolites, the computational methods provide reliable quantitative predictions of metabolic function and Darwinian fitness under genetic and environmental perturbations (Edwards et al. 2001; Ibarra et al. 2002; Segre et al. 2002; Famili et al. 2003; Papp et al. 2004), thus allowing a systematic investigation of the amount of functional redundancy as well as the mechanisms of its maintenance in cellular metabolic networks.
Materials and Methods
Escherichia coli and Yeast Metabolic Networks
Metabolic network models of Escherichia coli (iJR904 GSM/GPR) (Reed et al. 2003) and yeast Saccharomyces cerevisiae (iND 750) (Duarte et al. 2004) were used in this study. The models were downloaded from the BiGG database (http://bigg.ucsd.edu) and parsed by the COBRA toolbox (Becker et al. 2007). The E. coli metabolic network contains 931 unique biochemical reactions associated with 904 known genes. The yeast metabolic network is composed of 1,149 reactions associated with 750 known genes. Some reactions do not have associated genes because the genes whose protein products catalyze these reactions have yet to be identified. The metabolic network models also provide information on stoichiometry, direction of reaction, isoenzyme, and enzymatic protein complex. Classification of reactions by functional category as presented in supplementary figure S1 (Supplementary Material online) follows previous authors (Reed et al. 2003; Duarte et al. 2004).
Flux Balance Analysis
Details of FBA have been described in the literature (Edwards et al. 2002; Price et al. 2004). Briefly, FBA can be used to analyze a metabolic network at the steady state under the constraint of stoichiometry. The FBA equation is S · v = 0, where S is the stoichiometric matrix and v is the metabolic flux vector. The biomass reaction describes the relative contribution of metabolites to the cellular biomass. The steady-state flux distribution is determined by maximizing the rate of biomass production. The formulated linear programming problem is shown below:
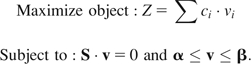 |
Here, the vector c is the biomass reaction function and vectors α and β represent the lower and upper bound constraints of metabolic fluxes, respectively. We used the optimization package CLPEX (www.ilog.com) to solve the linear programming problem. To delete a reaction, we constrain the flux of the reaction to zero and obtain the maximal biomass production under the constraint. The relative fitness of the deletion strain to the wild-type strain is the maximal biomass production rate of the deletion strain divided by that of the wild type (Segre et al. 2005).
Minimization of Metabolic Adjustment
Minimization of metabolic adjustment (MOMA) has been previously described in detail (Segre et al. 2002). Briefly, MOMA predicts the maximal biomass production rate upon deletion of a reaction by minimizing the differences in all metabolic fluxes between the deletion strain and the wild-type strain. All the constraints used in FBA are still enforced in MOMA. The formulated quadratic programming problem is
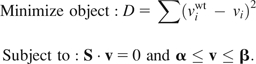 |
Here, is the wild-type flux vector calculated by FBA. When there are multiple flux values for a reaction in the wild type, we randomly choose one of them, as in the original MOMA analysis (Segre et al. 2002). MOMA results are not sensitive to the use of different wild-type values (Mahadevan and Schilling 2003). The quadratic programming problem is also solved by CPLEX. As in FBA, deletion of a reaction is realized by constraining the flux of the reaction to zero.
Identification of Dead-end Reactions
We followed a published protocol (Burgard et al. 2004) to identify dead-end reactions. Dead-end reactions are defined as reactions that must have zero flux under a steady state. These reactions are involved in the generation of metabolites that are neither included in biomass nor transported outside the cell and may reflect the incompleteness of the metabolic network models. They were identified by maximizing and minimizing in turn each flux under the condition that all nutrients are provided. If both the maximization and minimization result in zero flux, this reaction is considered a dead-end reaction. Because neither active transportation that requires adenosine triphosphate nor ionic transportation is modeled in FBA, these reactions are also not considered in our analysis. After removing all these reactions, the E. coli and S. cerevisiae metabolic networks used in our analysis contain 737 and 632 reactions, respectively. Saccharomyces cerevisiae has many more dead-end reactions than E. coli, probably because the reconstructed metabolic network is less complete for the former than for the latter.
Simulation of Nutritional Conditions
The simulation of single-usable carbon-source conditions follows a previous study (Pal et al. 2005). Briefly, the medium contains one major carbon metabolite as the organic carbon source and the required inorganic metabolites (nitrogen, phosphate, metal ions, etc.). In nature, the environments of microorganisms such as E. coli and S. cerevisiae often change frequently. These organisms usually face nutritionally poor conditions but occasionally encounter rich conditions. To mimic their natural environments, we simulate random nutritional conditions following a recent study (Wang and Zhang 2009). For each condition, we generate a random number g from an exponential distribution with a mean of m = 0.1. Here, g is the probability that a carbon-source nutrient is available. The actual presence or absence of each nutrient is then determined stochastically using g. We then add all required inorganic metabolites. Use of other m values (0.05 or 0.5) did not change our results. For each available nutrient, we fix the uptake rate at a random value between 0 and 20. A condition is considered to be a valid condition only if FBA shows that it supports the growth of wild-type organisms.
Level of Redundancy
We define the level of redundancy by the total number of redundant reactions divided by the average number of these reactions that need to be present in zero-redundancy networks. If there are n compensating pathways for a particular function and each of these pathways contains m reactions, the level of redundancy is (mn)/m = n. Thus, a redundancy of n is equivalent to the presence of n compensating pathways of equal length for each function.
Identification of Reactions Catalyzed by Pleiotropic Enzymes
We used the gene-reaction association annotated in the reconstructed metabolic networks (Reed et al. 2003; Duarte et al. 2004). If an enzyme is annotated to catalyze more than one reaction, the enzyme is considered to be pleiotropic. An otherwise dispensable reaction appears to be indispensable if the enzyme that catalyzes this reaction is required to be present in the network, owing to its pleiotropic function in catalyzing an indispensable reaction.
Recent Horizontal Gene Transfer
We used the horizontal gene transfer (HGT) data set compiled in a recent study (Lercher and Pal 2008). In this data set, HGTs were identified by the parsimony method across 31 proteobacterial species with the available phylogenetic tree. Because we concentrated on the metabolic genes of the E. coli K-12 strain, only genes within the data set that are horizontally transferred into E. coli K-12 or its ancestors are used for the calculation. Genes that are horizontally transferred into the common ancestor of E. coli K-12 and E. coli CFT073 (within four steps away from E. coli K-12 in the phylogeny of fig. 1 in Lercher and Pal 2008) or a more recent ancestor of E. coli K-12 are considered as recent HGTs.
Comparison Between Experimentally Determined and Computationally Predicted Fitness Values of Single-Gene Deletion Yeast Strains
The growth rates of S. cerevisiae single-gene deletion strains in the yeast extract/peptone/dextrose (YPD) medium were previously measured (Steinmetz et al. 2002) and were obtained from http://www-deletion.stanford.edu/YDPM/YDPM_index.html. In the original data set, the relative growth rate of every gene deletion strain is normalized such that the average growth rate of all viable deletion strains is one. In order to obtain the fitness of the deletion strains relative to the wild type, we scaled the relative growth rate to another data set (Sliwa and Korona 2005), which accurately measured the fitness of 12 gene deletion strains by competing them individually with the wild-type strain. Specifically, we averaged the growth rate of the 12 gene deletion strains using the data from Steinmetz et al. (2002) (fg = 1.026) and averaged their fitness relative to the wild type using the data from Sliwa and Korona (2005) (fm = 1.010). Then, for every deletion strain in the large data set (Steinmetz et al. 2002), its fitness is calculated by multiplying the growth rate by fm/fg. In our analysis, fm/fg = 0.984. Our results are virtually unaffected even when we use fm/fg = 1.
The parameters used in FBA and MOMA to mimic the YPD medium that is used in the experimental determination of the growth rates of yeast gene deletion strains follow previous authors (Forster et al. 2003). Comparison between the FBA-predicted and experimentally determined fitness values shows that in only 8% (39/486) of cases, essential genes are misidentified as nonessential by FBA. However, a reaction is considered redundant only when it is nonessential in all 105 examined conditions. The probability of misclassifying a nonredundant reaction as redundant is the probability that FBA misclassifies it as nonessential in every condition where it is essential, which should be low. Thus, it is improbable for a nonredundant reaction to be misclassified as redundant. We regarded a redundant reaction as indispensable if its deletion strain has an FBA- or MOMA-predicted fitness of f < 0.99. In fewer than 2% (8/486) of cases, FBA-predicted fitness is <0.99, whereas the experimentally determined fitness is >0.99. The corresponding error rate for MOMA is slightly higher (24/486 = 5%). A dispensable redundant reaction is misclassified by FBA or MOMA as indispensable when the true fitness of the deletion strain is >0.99 in all 105 conditions but the predicted fitness is <0.99 in at least one condition, which is expected to be low.
Preservation of Rarely Used Genes
A rarely used gene can be preserved in the genome during evolution as long as the null mutation rate is sufficiently low compared with the product of the probability that the gene is used at any given time and the fitness contribution of the gene when it is used. This is demonstrated below, first in haploid organisms and then in diploids. Let us use A to collectively denote all functional alleles of the gene under study and a to collectively denote all null alleles of the gene and use p and q to denote the frequency of A and a alleles, respectively. Let the null mutation rate, or the rate of mutation from A to a, be u per gene per generation. We assume that the mutation rate from a to A is zero because it is extremely unlikely for a null allele to mutate back to a functional allele. Random mutations increase the frequency of a, whereas occasional natural selection reduces it. Let us first consider the possibility of a mutation–selection balance. At the balance, new a alleles generated by mutations are completely removed by selection. In haploids, let us assume that the relative fitness of A and a individuals is 1 and 1 − s, respectively, and that selection occurs once every n generations. For simplicity, let us assume that in every cycle of n generations, selection occurs at the end of the nth generation in the form of a viability difference. Thus, when the balance is reached, in n generations, the allele frequency of a increases from q0 to qn by mutation and then decreases to q0 by natural selection. The mutational process is described by the difference equation
| (1) |
Solving equation (1), we obtained
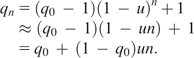 |
(2) |
In the case of haploid organisms such as E. coli, the selection process is described by
| (3) |
where is the frequency of a after selection. At the mutation–selection balance, we have
| (4) |
Using equations (2), (3), and (4), we can obtain
| (5) |
For diploid organisms, the fitness of AA, Aa, and aa individuals is assumed to be 1, 1, and 1 − s, respectively, because enzyme genes are largely haplosufficient (Kondrashov and Koonin 2004; Deutschbauer et al. 2005). Then, equation (3) can be rewritten as
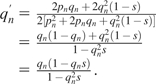 |
(3′) |
Using equations (2), (3′), and (4), we obtain
| (5′) |
Thus, for both haploids and diploids, when un/s < 1, null alleles cannot be fixed through the mutation–selection process. In other words, functional alleles can be preserved in the population. Note that the above mutation–selection equilibrium is a stable equilibrium because if q is by chance slightly larger than its equilibrium value, the effect of selection in removing null alleles (qs for haploids and q2s for diploids) becomes larger and the mutation rate per generation in generating null alleles ((1 − q)u) becomes smaller. Consequently, q will return to its equilibrium value. The same argument can be made if q is by chance slightly smaller than its equilibrium value. Thus, random genetic drift cannot push q much away from its equilibrium value. This is particularly so, given the large population size of E. coli and S. cerevisiae.
Although un/s < 1 can ensure that functional alleles at a locus will not be lost in evolution, in practice, one may consider a more stringent criterion of qn < 0.5 so that a randomly sampled allele of the gene from the population is more likely to be functional than null. Thus, we consider that the gene can be retained by selection if n < 0.5s/u for haploids or n < 0.25s/u for diploids. The mean mutation rate u for E. coli metabolic enzyme genes is 7.7 × 10⁻⁸ per gene per generation (see the next section). If we use s = 0.01, n has to be smaller than 6.5 × 10⁴. If we use s = 0.1, n has to be smaller than 6.5 × 10⁵. The mean u for S. cerevisiae metabolic enzyme genes is 4.0 × 10⁻⁸ per gene per generation (see the next section). When s = 0.01, n has to be smaller than 6.3 × 10⁴. When s = 0.1, n has to be smaller than 6.3 × 10⁵. Because the vast majority of metabolic enzyme genes have u values not exceeding twice the mean u (supplementary fig. S2, Supplementary Material online), the above results are also largely correct for virtually every individual gene. In our study, although a redundant reaction is considered indispensable when it is used in at least one of the 105 examined nutritional conditions, the vast majority of redundant reactions were found to be used in the first 104 conditions examined (fig. 1). In addition, although our main analysis used a fitness differential of s = 0.01 to define indispensability, additional analysis showed that the results are virtually unchanged even when we require s = 0.1. Taken together, these considerations and the population genetic analysis in this section demonstrate that the criteria we used in determining indispensability of redundant reactions are appropriate.
FIG. 1.—

Estimates of the numbers of various redundant reactions in (A) E. coli and (B) S. cerevisiae stabilize as the number of examined nutritional conditions increases. The first 158 conditions examined in E. coli and first 60 conditions examined in S. cerevisiae are single-usable carbon-source conditions, whereas the remaining conditions are randomly generated following a specific sampling scheme. Note that the number of nonactive reactions might be overestimated because the estimate continues to decline as the number of examined conditions increases. This leads to a conservative estimate of the number of active reactions.
Note that the above population genetic formulation ignores occasional back mutations from a to A. When the frequency of a increases, back mutations may become more common. Because back mutations effectively reduce u, the above results are conservative. In other words, the power of selection in preserving rarely used reactions should be slightly higher than calculated above.
Null Mutation Rate in E. coli and S. cerevisiae
If we know the point mutation rate and indel mutation rate, we can estimate the null mutation rate for any given gene (Zhang and Webb 2003). This is based on the idea that nonsense mutations and frameshifting mutations usually generate null alleles. Note that some nonsense and frameshifting mutations may not generate null alleles if they only disrupt a short C-terminal region of the encoded protein, whereas some missense mutations can generate null alleles. Our estimates are thus approximate, but they are not expected to differ from the true values by more than 1-fold because the above three types of mutations are rare and their opposite influences on our estimates tend to cancel out. We consider an indel as frameshifting if its size is not a multiple of three nucleotides. The point mutation rates used here are 5.4 × 10⁻¹⁰ and 2.2 × 10⁻¹⁰ per nucleotide site per generation for E. coli and S. cerevisiae, respectively (Drake et al. 1998). We assume that the indel mutation rate is 10% of the point mutation rate and that 83% of indel mutations are frameshifting, based on previous comparative genomic analysis (Podlaha and Zhang 2003; Zhang and Webb 2003). We then use the coding sequences of the genes associated with E. coli and S. cerevisiae metabolic reactions studied in this work to estimate the null mutation rates per gene per generation by a modified version of the program PSEUDOGENE (Zhang and Webb 2003). The frequency distributions of u for E. coli and S. cerevisiae metabolic enzyme genes are shown in supplementary figure S2 (Supplementary Material online). Given the null mutation rate, u, it is easy to see that it takes on the order of 1/u (or 107) generations for a functional allele to be replaced with null alleles.
Results
Abundance of Redundant Metabolic Reactions
Here, we study the bacterium E. coli (Reed et al. 2003) and yeast S. cerevisiae (Duarte et al. 2004) because their reconstructed metabolic networks are of high quality and have been empirically verified and because they represent prokaryotes and eukaryotes, respectively. The metabolic networks of E. coli and S. cerevisiae contain 737 and 632 biochemical reactions, respectively, after the removal of dead-end reactions (see Materials and Methods). For three reasons, we focus on biochemical reactions rather than genes encoding the enzymes that catalyze these reactions. First, we are interested in the functional redundancy at the systems level of a metabolic network, which is composed of reactions. Second, there is no one-to-one relationship between genes and reactions. Third, annotations of enzyme genes are incomplete, making it impossible to conduct a gene-based analysis that is as comprehensive and accurate as a reaction-based analysis.
Assuming a steady state in metabolism, FBA maximizes the rate of biomass production under the stoichiometric matrix of all metabolic reactions and a set of flux constraints (see Materials and Methods). The FBA-optimized rate of biomass production can be regarded as the Darwinian fitness of the cell under the condition specified. If removing a reaction blocks the production of one or more biomass components, biomass production becomes zero or undefined due to imbalanced compositional stoichiometry of the biomass. In order to estimate the number (m) of metabolically redundant reactions, we need to identify the reactions whose single removal does not block the production of any biomass component under any nutritional condition. Because it is infeasible to enumerate all possible conditions, we investigate how the estimate of m changes when the number (c) of examined conditions increases. In E. coli, m reduces from 737 to 320 after we examine all single-usable carbon-source conditions (see Materials and Methods; fig. 1A). We then create random nutritional conditions in which wide-type organisms can grow (see Materials and Methods). As expected, m decreases at a much reduced pace as c increases (fig. 1A). When c is doubled from 5 × 10⁴ to 105, m decreases by only 6 (or 2%). Thus, 105 conditions appear sufficient for providing a reasonably accurate estimate of m. Using this method, we identified 276 (37% of the network) and 295 (47% of the network) redundant reactions from E. coli and S. cerevisiae, respectively (figs. 1 and 2).
FIG. 2.—

Numbers and fractions of redundant and nonredundant reactions in (A) E. coli and (B) S. cerevisiae metabolic networks. The total number of reactions after the removal of dead-end reactions is given in the parentheses after the species name. An always-essential reaction is required for growth in all nutritional conditions, whereas a sometimes-essential reaction is required in only some conditions. A redundant reaction is not required in any condition. An efficient (redundant) reaction is more efficient than reactions of the same functions in at least one condition. A nonefficient, active (redundant) reaction is no more efficient than reactions of the same functions under all conditions but has nonzero flux in at least one condition. Under certain conditions, removing such reactions causes an immediate fitness reduction, which can only be recovered via evolution by mutation, drift, and selection. A nonefficient, nonactive (redundant) reaction can be removed without causing an appreciable fitness reduction in all conditions. Pleiotropic effect refers to the situation where an otherwise dispensable reaction is preserved because its catalyzing enzyme also catalyzes another reaction that is indispensable. Recent HGT refers to the situation where a redundant reaction was acquired by recent HGT and thus may not have been stably preserved in the genome. FBA limitation refers to the situation where an indispensable reaction is misclassified as dispensable due to limitations of FBA. Because the enzyme genes associated with some reactions have yet to be identified, the number of genes known to be associated with the unexplained redundant reactions is given in brackets. For each species, the middle and right circles show various explanations for the existence of redundant reactions. Explanations in the middle circle are considered before those in the right circle; within each circle, explanations depicted with darker colors are considered before those depicted with lighter colors. For each redundant reaction, only the first applicable explanation considered is counted.
Nonredundant metabolic reactions can be divided into two groups: always essential and sometimes essential. Deletion of an always-essential reaction blocks biomass production under all conditions, whereas deletion of a sometimes-essential reaction blocks biomass production under some, but not all, conditions. Always-essential reactions can be identified unambiguously because the metabolic network models allow us to know all nutrients that can be used by the cells under the metabolic models. If a reaction is essential when all these usable nutrients are available, it must be essential when one or more of these nutrients are absent and hence must be an always-essential reaction. The rest of the nonredundant reactions are then classified as sometimes-essential reactions. Using this strategy, we identified 95 (13%) always-essential and 366 (50%) sometimes-essential reactions in E. coli (fig. 2A) and 24 (4%) always-essential and 313 (49%) sometimes-essential reactions in S. cerevisiae (fig. 2B). Not unexpectedly, sometimes-essential reactions considerably outnumber always-essential reactions (Almaas et al. 2005). We also observe that 1) different functional subgraphs of the metabolic network contain different fractions of always-essential, sometimes-essential, and redundant reactions and 2) E. coli and S. cerevisiae show different distributions of the three types of reactions among subgraphs (supplementary fig. S1, Supplementary Material online).
Zero-Redundancy Metabolic Networks
Although redundant reactions can be individually removed from a metabolic network without blocking biomass production, they may not be simultaneously removed. To estimate the number of redundant reactions that can be simultaneously removed, we build a functional metabolic network with zero redundancy under all conditions. To achieve this goal, we randomly pick a redundant reaction and examine if its deletion still permits biomass production in all conditions examined. If so, this reaction is permanently deleted from the network; otherwise, it is restored. We then pick another redundant reaction from the remaining network and repeat the procedure until no more reactions can be deleted from the network. We generate 250 such networks by using variable random orders in deleting reactions and find that the zero-redundancy networks have on average 534 (72% of the original network) and 418 (64%) reactions in E. coli and S. cerevisiae, respectively (supplementary fig. S3, Supplementary Material online). Because, on average, 203 of the 276 redundant reactions can be simultaneously deleted in E. coli, the level of redundancy is 276/(276 − 203) = 3.8. Simply put, this level of redundancy among the redundant reactions of E. coli is equivalent to the presence of 3.8 compensating pathways of equal length for each function (see Materials and Methods). The corresponding number is 3.7 in S. cerevisiae. Due to high demands of computational time and memory, our main analysis of zero-redundancy networks examines only 103 nutritional conditions. Nevertheless, our subsequent analysis with 104 conditions shows that the result is largely unchanged (supplementary fig. S3, Supplementary Material online). In sum, the zero-redundancy network analysis further demonstrates the high redundancy of the E. coli and S. cerevisiae metabolic networks because as many as 28–36% of reactions can be simultaneously removed from the metabolic networks without blocking the biomass production under any condition.
Preservation of Redundant Reactions: Efficient Reactions
How can redundant reactions be preserved in a metabolic network during evolution? One possibility is that these functionally redundant reactions have differential metabolic efficiencies under different conditions, allowing the cell to use different reactions to achieve maximal growth in many different environments. Under this hypothesis, deleting a redundant reaction at a given condition may reduce (but not block) biomass production when the deleted reaction is more efficient than other reactions of the same function at this condition. Population genetic theories predict that mutations causing a fitness reduction of >1/N will be subject to substantial purifying selection, where N is the effective population size, on the order of 109 for E. coli (Ochman and Wilson 1987) and 107 for S. cerevisiae (Wagner 2005b). Thus, natural selection can keep a redundant reaction in the network if its deletion renders even a tiny decrease in biomass production. Furthermore, because the null mutation rate in E. coli and S. cerevisiae is on the order of 10−7 to 10−8 per gene per generation, a gene can be selectively kept in a population even if it is used only once every 104 to 105 generations (see Materials and Methods). Given these theoretical considerations and potential errors associated with FBA-predicted fitness, we regard a redundant reaction to be indispensable if its removal reduces biomass production by more than 1% in one or more of the 105 conditions examined. Such indispensable redundant reactions are referred to as efficient reactions, as they are more efficient than other reactions of the same functions under at least one condition. Our analysis identifies 64 and 89 efficient reactions in E. coli and S. cerevisiae, respectively, accounting for 23–30% of all redundant reactions (figs. 1 and 2). The remaining 70–77% of redundant reactions are as efficient as or less efficient than other reactions of the same functions under all conditions and are referred to as nonefficient reactions (figs. 1 and 2).
Preservation of Redundant Reactions: Nonefficient, Active Reactions
In the above analysis, we assumed that when a redundant reaction is deleted, its compensating reaction is immediately activated to its optimal flux to produce the maximal biomass predicted by FBA. This assumption requires that the cell has a regulatory emergency plan for every possible reaction deletion, which seems unrealistic. In general, the growth performance of a perturbed metabolic network is suboptimal and the FBA-predicted maximal growth can only be achieved through evolution by mutation, drift, and selection (Ibarra et al. 2002; Fong et al. 2005). In other words, when a reaction is deleted from a cell, the cell may be outcompeted by wild-type cells and has no chance to evolve to its FBA-predicted maximal fitness. To consider this possibility, we employ the method of MOMA, a derivative of FBA that has also been empirically verified (Segre et al. 2002). Under all the assumptions and constraints used by FBA, MOMA calculates the rate of biomass production after the deletion of a reaction by minimizing flux changes (see Materials and Methods). Because MOMA minimizes flux changes while FBA does not, the biomass production predicted by MOMA is always lower than or equal to that predicted by FBA. A nonefficient reaction is considered to be indispensable if its removal reduces the MOMA-predicted biomass production by more than 1% in one or more of the 105 examined conditions. Such reactions are referred to as active reactions because they must have nonzero fluxes; otherwise, their removal will not cause biomass reductions. We identify 158 and 166 active reactions in E. coli and S. cerevisiae, respectively, accounting for more than half of all redundant reactions or 75–80% of nonefficient redundant reactions (fig. 2). The rest of the nonefficient reactions are referred to as nonactive reactions because their removal does not affect MOMA-predicted biomass appreciably. Unlike the numbers of redundant and nonefficient reactions, the number of nonactive reactions may have been overestimated as the number continues to drop even when c reaches 105 conditions (fig. 1). This means that the above numbers of active reactions are conservative estimates.
Although we showed how a nonefficient redundant reaction can be indispensable and kept in the network by natural selection, it is puzzling as why such reactions were incorporated into the metabolic network in the first place, as nonefficient reactions are never more efficient than other reactions of the same functions. We suggest that nonefficient reactions were incorporated by neutral processes. They became active reactions if they were equally efficient as their redundant reactions under some conditions. When multiple equally efficient redundant reactions exist (regulatory or structural), degenerate mutations may be fixed so that the total activity of the enzymes catalyzing the redundant reactions is optimized, whereas the activity of each enzyme becomes insufficient for the maximal growth should the other redundant enzymes be removed.
Preservation of Redundant Reactions: Nonefficient, Nonactive Reactions
Our analysis identified 54 (7% of the total network) and 40 (7%) nonactive redundant reactions in E. coli and S. cerevisiae, respectively (fig. 2). Among them, 38 E. coli and 20 S. cerevisiae reactions are less efficient than other reactions of the same functions and have zero fluxes under all conditions. The rest may be as efficient as their redundant reactions and have nonzero fluxes, but their removal does not reduce MOMA-predicted biomass production by more than 1%.
How are the nonactive reactions maintained in the metabolic network? Some enzymes can catalyze multiple reactions, a phenomenon known as pleiotropy (He and Zhang 2006). In E. coli, 266 reactions (36% of the total network), including 27 nonactive reactions, are catalyzed by pleiotropic enzymes (supplementary table S1, Supplementary Material online). In S. cerevisiae, 171 reactions (27% of the total network), including 13 nonactive reactions, are catalyzed by pleiotropic enzymes (supplementary table S2, Supplementary Material online). A nonactive reaction can be stably retained in the network if the enzyme that catalyzes it also catalyzes one or more indispensable reactions. Indeed, we find that every nonactive reaction catalyzed by pleiotropic enzymes can be retained by this “guilt-by-association” mechanism. In both E. coli and S. cerevisiae, there are only 27 redundant reactions whose retentions are unexplained (fig. 2). Further examinations show that they are unexplained by FBA and MOMA simply because of the incompleteness of the reconstructed metabolic networks, limitations of the metabolic models (e.g., lack of connection to regulatory and signal transduction networks), and existence of environments difficult to simulate (e.g., temperature changes) (supplementary tables S1 and S2, Supplementary Material online). For instance, E. coli gene otsB encodes trehalose-6-phosphate phosphatase, which is required for cell viability at 4°C (Kandror et al. 2002) and thus may be maintained by selection if E. coli sometimes experiences this low temperature in nature. We also observed six E. coli nonactive reactions that are catalyzed by enzymes encoded by genes that were recently horizontally transferred into E. coli (supplementary table S1, Supplementary Material online) (see Materials and Methods). HGTs occur so frequently among prokaryotes (Gogarten et al. 2002) that the presence of some redundant genes may be attributable to this mechanism rather than preservation under purifying selection. Indeed, analyzing an E. coli HGT data set (Lercher and Pal 2008), we find that the fraction of recently horizontally acquired genes is significantly greater among nonactive reactions (43%) than among other reactions (19%) (P < 0.05, Fisher's exact test; see Materials and Methods). We did not analyze recent HGTs into S. cerevisiae because such information is not readily available and because HGTs are thought to be much less frequent in eukaryotes than in prokaryotes. After considering all these additional mechanisms, there are only 14 (8 with associated genes) E. coli and 13 (4 with associated genes) S. cerevisiae redundant reactions whose preservation in the metabolic networks remain unexplained (fig. 2).
A Direct Test of the Adaptive Backup Hypothesis
Our analysis showed that the vast majority of the functionally redundant reactions in E. coli and S. cerevisiae are selectively maintained because they cause fitness reductions when singly removed from the cell. This explanation is different from the adaptive backup hypothesis, in which only simultaneous removal of compensating redundant reactions is deleterious. Hence, the adaptive backup hypothesis is not needed to explain the maintenance of metabolic redundancy. The adaptive backup hypothesis also has a key prediction of higher redundancy for more important functions because the fitness gain from backing up more important functions is greater than that from backing up less important ones (e.g., Kafri et al. [2008] on redundant duplicate genes). To test this prediction, we measure the importance of reactions using zero-redundancy networks because they are free from the confounding influence of redundant reactions. We calculate the average biomass reduction upon removal of a reaction from a zero-redundancy network across 103 conditions and repeat this calculation in 125 random zero-redundancy networks to obtain the mean. For E. coli, contrary to the prediction of the backup hypothesis, reactions that are redundant in the original metabolic network tend to perform less important jobs than reactions that are nonredundant (P = 0.056, Mann–Whitney U test; fig. 3). But for S. cerevisiae, the observation appears to be consistent with the backup prediction (P = 3.5 × 10⁻⁵, Mann–Whitney U test; fig. 3). These opposite patterns in E. coli and S. cerevisiae show that the adaptive backup hypothesis is either inadequate or wrong. Our subsequent computer simulation shows that the observations in both species are explainable without invoking adaptive backup.
FIG. 3.—

Relationships between the importance and redundancy of metabolic reactions. Error bars show one standard error. P values are from Mann–Whitney U test. The redundancy of a reaction is determined from the complete network, whereas the importance of a reaction is determined from zero-redundancy networks. Redundant reactions perform less important functions than nonredundant functions in E. coli, whereas the opposite is true in S. cerevisiae. The same patterns are recapitulated in simulated metabolic networks that are formed by merging 103 zero-redundancy networks that each functions in a different condition.
Let us assume that a population rotates among many different environments so frequently that a metabolic reaction needed for a particular environment does not have a chance to be lost from the population before the population switches back to this environment after moving through other environments. This scenario is quite likely because, even without selective constraint, it takes, on average, 107 generations for a functional allele of a gene to be replaced by a nonfunctional allele in E. coli and S. cerevisiae (see Materials and Methods). We ask whether this scenario would result in a metabolic network whose redundancy mimics that observed in E. coli and S. cerevisiae. We first generate a random nutritional condition (see Materials and Methods). A zero-redundancy metabolic network for this condition is then generated by removing redundant reactions from the original network, as described earlier. We repeat this process 103 times, each under a different condition. We then merge the 103 resultant zero-redundancy networks to form the final simulated metabolic network. We measure the relative importance of redundant and nonredundant reactions of this simulated network as was done for the real network. Interestingly, for both E. coli and S. cerevisiae, the results are similar between the simulated networks and their respective real networks (fig. 3). Because we did not invoke adaptive backup in the simulation, our result strongly suggests that the observation of higher redundancy for more important functions in S. cerevisiae is a by-product of its evolutionary history. This simulation was repeated 10 more times and the above finding always holds (supplementary table S3, Supplementary Material online).
Discussion
In this work, we used FBA and MOMA to study the level of redundancy as well as the mechanisms of its preservation in metabolic networks. It is important to emphasize that in our definition, a reaction is functionally redundant only when its removal does not block the biomass production in any condition. This definition is fundamentally different from that used in all earlier studies of metabolic redundancy. In these studies, a reaction is considered redundant when it is dispensable in only one or a few conditions. It is clear that many redundant reactions such defined are actually sometimes-essential reactions by our definition and thus are not truly redundant in all conditions, as has been demonstrated in numerous studies (Papp et al. 2004; Blank et al. 2005; Dudley et al. 2005; Harrison et al. 2007). It is the number and preservation of those truly functionally redundant reactions that are of particular interest and are the subject of our study. However, to our surprise, the percentage of reactions that are redundant under our strict definition substantially exceeds earlier FBA-based and experiment-based estimates that were based on the looser definitions of redundancy (Papp et al. 2004; Blank et al. 2005). A careful comparison reveals that these earlier studies only considered reactions with nonzero fluxes under rich or minimal media, which tend to be nonredundant (supplementary table S4, Supplementary Material online), whereas our study considers all reactions in a metabolic network. Our finding of large numbers of redundant reactions in E. coli and S. cerevisiae confirms the prediction of high metabolic redundancy from extreme pathway analysis of subnetworks, which cannot deal with an entire cellular metabolic network due to computational difficulties (Papin et al. 2002; Price et al. 2002).
Because FBA and MOMA predictions are not without errors, it is important to evaluate how such errors affect our results. Previous studies demonstrated that FBA and MOMA make good qualitative predictions of gene essentiality (Segre et al. 2002; Papp et al. 2004). Here, we plot the experimentally determined fitness values of single-gene deletion S. cerevisiae strains in rich media and their corresponding values predicted by FBA and MOMA (fig. 4). Only in 8% (39/486) of cases did we observe misidentification of essential genes as nonessential by FBA (yellow bars in fig. 4A). The accuracy of FBA should be similarly high in other conditions because the models and assumptions used in FBA are not specific to the rich media. Because a reaction is regarded as redundant only when it is nonessential in all 105 examined conditions, it is improbable for a nonredundant reaction to be misclassified as redundant (see Materials and Methods). In other words, the number of redundant reactions is unlikely to have been grossly overestimated in our study. We regarded a redundant reaction as indispensable if its deletion strain has an FBA- or MOMA-predicted fitness of f < 0.99. In fewer than 2% (8/486; red bars in fig. 4A) of cases, the FBA-predicted fitness is <0.99, whereas the experimentally determined fitness is >0.99. The corresponding error rate for MOMA is slightly higher (24/486 = 5%; red bars in fig. 4B). These observations suggest that the estimation of the number of indispensable redundant reactions is relatively accurate (see Materials and Methods). To be conservative, we also used a more stringent cutoff of f < 0.9 in defining indispensable reactions, for which the error rate is expected to be 0.6% (3/486) for FBA and 1.2% (6/486) for MOMA, respectively. We found that the number of unexplained redundant reactions is not much increased (supplementary table S5, Supplementary Material online), suggesting that our conclusion remains valid even when the few errors made by FBA and MOMA are considered. To explore a wider range of f, we further carried out an analysis with a cutoff of f < 0.999, which is closer to the fitness boundary between deleterious and neutral mutations (1/N), and found that the results are consistent with those under other cutoffs (supplementary table S5, Supplementary Material online). An even larger f is theoretically preferred, but it may generate less accurate results due to the limited precisions of FBA and MOMA. Use of a larger f should result in more redundant reactions to be indispensable and thus provide stronger support to our conclusion. Therefore, our conclusion of indispensability of redundant reactions is robust to the choice of f.
FIG. 4.—

Accuracy of (A) FBA and (B) MOMA in predicting the fitness values of single-gene deletion yeast straits in rich medium, which were previously determined experimentally (see Materials and Methods). A total of 485 genes encoding metabolic enzymes are examined here. Yellow bars are genes that are essential by experimental determination but nonessential by FBA prediction. Red bars are single-gene deletion strains that have a fitness of >0.99 in experiments but <0.99 by either FBA or MOMA prediction.
In this study, we examined 105 different nutritional conditions to identify redundant reactions and to determine the mechanisms of evolutionary preservation of the redundant reactions. Although we could have examined more combinations of nutrients (e.g., additional nitrogen and phosphate sources), our results showed that even with the limited number and type of nutritional conditions considered, the preservation of virtually every redundant reaction can be explained without invoking backup. Furthermore, some redundant enzymes may perform noncatalytic functions that are not considered in FBA (He and Zhang 2006). Thus, our results are conservative. It is worth mentioning that the above conclusion is strongly supported by a recent experimental study by Hillenmeyer et al. (2008), who showed that most yeast genes have fitness effects in at least one of many conditions examined. However, Hillenmeyer et al. (2008) did not study functional redundancy and their results may be misinterpreted as a complete lack of functional redundancy in yeast. More importantly, the majority of the conditions they used are artificial drug treatments that are likely to be substantially different from the natural environments of yeast (with the exception of some clinical strains of yeast). The conditions we computationally examined are combinations of existing nutritional metabolites and thus are more realistic.
The adaptive backup hypothesis makes the key prediction of higher redundancy of more important functions. Using zero-redundancy networks, we showed that E. coli and S. cerevisiae exhibit different relationships between the importance of a reaction and its redundancy level. Thus, the adaptive backup hypothesis is inadequate in explaining the actual observations. By contrast, our simulation showed that a simple scenario where a population frequently alternates among many environments can explain both the E. coli and S. cerevisiae results and thus provides a better explanation of the observations. One caveat of the simulation and other analysis in the present study is that it is unknown how close our simulated conditions match and how well they represent the wide range of natural nutritional environments in the evolution of E. coli and S. cerevisiae. Nevertheless, identification of conditions where some redundant reactions directly contribute to the organismal fitness suggests that these reactions “can” be maintained without invoking the adaptive backup hypothesis. Furthermore, these identified nutritional conditions may provide information about the natural environments where the organisms live or have recently lived, which are potentially useful for the study of organismal evolution as well as environmental changes.
In summary, our systems analysis of E. coli and S. cerevisiae metabolic networks revealed the presence of 37–47% redundant reactions. The vast majority of these redundancies are stably preserved in the network owing to their direct contribution to fitness or pleiotropic effect of some enzymes. In the case of E. coli, a few redundant reactions were recently acquired via HGTs and thus may not be stably maintained in the genome. It is likely that even the small fraction of redundant reactions that are unexplained by our analysis can be explained when more information about them becomes available. Furthermore, we invalidated a key prediction of the adaptive backup hypothesis about the relationship between the functional importance and redundancy level of a reaction. Taken together, adaptive backup is neither necessary nor sufficient to explain the high redundancy of cellular metabolic networks. Thus, the genetic robustness of metabolism is likely an evolutionary by-product. In this context, genetic robustness does not constrain evolvability (Lenski et al. 2006), but rather enhances it, because genetic robustness reflects the ability of an organism to survive in different environments. Note that although our analysis is limited to the metabolic network, the obtained biological principles and insights may be applicable to redundancies in other biological systems because all biological systems can be treated as complex networks.
Supplementary Material
Supplementary figures S1–S3 and tables S1–S5 are available at Genome Biology and Evolution online (http://www.oxfordjournals.org/our_journals/gbe/).
Supplementary Material
Acknowledgments
We thank Meg Bakewell, Wendy Grus, Xionglei He, Ben-Yang Liao, and Wenfeng Qian for valuable comments. This work was supported by research grants from the National Institutes of Health and University of Michigan Center for Computational Medicine and Biology to J.Z.
References
- Almaas E, Oltvai ZN, Barabasi AL. The activity reaction core and plasticity of metabolic networks. PLoS Comput Biol. 2005;1:e68. doi: 10.1371/journal.pcbi.0010068. [DOI] [PMC free article] [PubMed] [Google Scholar]
- Becker SA, et al. Quantitative prediction of cellular metabolism with constraint-based models: the COBRA toolbox. Nat Protoc. 2007;2:727–738. doi: 10.1038/nprot.2007.99. [DOI] [PubMed] [Google Scholar]
- Blank LM, Kuepfer L, Sauer U. Large-scale 13C-flux analysis reveals mechanistic principles of metabolic network robustness to null mutations in yeast. Genome Biol. 2005;6:R49. doi: 10.1186/gb-2005-6-6-r49. [DOI] [PMC free article] [PubMed] [Google Scholar]
- Burgard AP, Nikolaev EV, Schilling CH, Maranas CD. Flux coupling analysis of genome-scale metabolic network reconstructions. Genome Res. 2004;14:301–312. doi: 10.1101/gr.1926504. [DOI] [PMC free article] [PubMed] [Google Scholar]
- Clark AG. Invasion and maintenance of a gene duplication. Proc Natl Acad Sci USA. 1994;91:2950–2954. doi: 10.1073/pnas.91.8.2950. [DOI] [PMC free article] [PubMed] [Google Scholar]
- Conant GC, Wagner A. Duplicate genes and robustness to transient gene knock-downs in Caenorhabditis elegans. Proc Biol Sci. 2004;271:89–96. doi: 10.1098/rspb.2003.2560. [DOI] [PMC free article] [PubMed] [Google Scholar]
- Dean EJ, Davis JC, Davis RW, Petrov DA. Pervasive and persistent redundancy among duplicated genes in yeast. PLoS Genet. 2008;4:e1000113. doi: 10.1371/journal.pgen.1000113. [DOI] [PMC free article] [PubMed] [Google Scholar]
- DeLuna A, et al. Exposing the fitness contribution of duplicated genes. Nat Genet. 2008;40:676–681. doi: 10.1038/ng.123. [DOI] [PubMed] [Google Scholar]
- Deutschbauer AM, et al. Mechanisms of haploinsufficiency revealed by genome-wide profiling in yeast. Genetics. 2005;169:1915–1925. doi: 10.1534/genetics.104.036871. [DOI] [PMC free article] [PubMed] [Google Scholar]
- de Visser JA, et al. Perspective: evolution and detection of genetic robustness. Evol Int J Org Evol. 2003;57:1959–1972. doi: 10.1111/j.0014-3820.2003.tb00377.x. [DOI] [PubMed] [Google Scholar]
- Drake JW, Charlesworth B, Charlesworth D, Crow JF. Rates of spontaneous mutation. Genetics. 1998;148:1667–1686. doi: 10.1093/genetics/148.4.1667. [DOI] [PMC free article] [PubMed] [Google Scholar]
- Duarte NC, Herrgard MJ, Palsson BO. Reconstruction and validation of Saccharomyces cerevisiae iND750, a fully compartmentalized genome-scale metabolic model. Genome Res. 2004;14:1298–1309. doi: 10.1101/gr.2250904. [DOI] [PMC free article] [PubMed] [Google Scholar]
- Dudley A, Janse D, Tanay A, Shamir R, Church G. A global view of pleiotropy and phenotypically derived gene function in yeast. Mol Syst Biol. 2005 doi: 10.1038/msb4100004. doi: 10.1038/msb4100004. [DOI] [PMC free article] [PubMed] [Google Scholar]
- Edwards JS, Covert M, Palsson BO. Metabolic modeling of microbes: the flux balance approach. Environ Microbiol. 2002;4:133–140. doi: 10.1046/j.1462-2920.2002.00282.x. [DOI] [PubMed] [Google Scholar]
- Edwards JS, Ibarra RU, Palsson BO. In silico predictions of Escherichia coli metabolic capabilities are consistent with experimental data. Nat Biotechnol. 2001;19:125–130. doi: 10.1038/84379. [DOI] [PubMed] [Google Scholar]
- Famili I, Forster J, Nielsen J, Palsson BO. Saccharomyces cerevisiae phenotypes can be predicted by using constraint-based analysis of a genome-scale reconstructed metabolic network. Proc Natl Acad Sci USA. 2003;100:13134–13139. doi: 10.1073/pnas.2235812100. [DOI] [PMC free article] [PubMed] [Google Scholar]
- Fong SS, et al. In silico design and adaptive evolution of Escherichia coli for production of lactic acid. Biotechnol Bioeng. 2005;91:643–648. doi: 10.1002/bit.20542. [DOI] [PubMed] [Google Scholar]
- Forster J, Famili I, Palsson BO, Nielsen J. Large-scale evaluation of in silico gene deletions in Saccharomyces cerevisiae. OMICS. 2003;7:193–202. doi: 10.1089/153623103322246584. [DOI] [PubMed] [Google Scholar]
- Gogarten JP, Doolittle WF, Lawrence JG. Prokaryotic evolution in light of gene transfer. Mol Biol Evol. 2002;19:2226–2238. doi: 10.1093/oxfordjournals.molbev.a004046. [DOI] [PubMed] [Google Scholar]
- Gu Z, et al. Role of duplicate genes in genetic robustness against null mutations. Nature. 2003;421:63–66. doi: 10.1038/nature01198. [DOI] [PubMed] [Google Scholar]
- Harrison R, Papp B, Pal C, Oliver SG, Delneri D. Plasticity of genetic interactions in metabolic networks of yeast. Proc Natl Acad Sci USA. 2007;104:2307–2312. doi: 10.1073/pnas.0607153104. [DOI] [PMC free article] [PubMed] [Google Scholar]
- Hartman JL, Garvik B, Hartwell L. Principles for the buffering of genetic variation. Science. 2001;291:1001–1004. doi: 10.1126/science.291.5506.1001. [DOI] [PubMed] [Google Scholar]
- He X, Zhang J. Toward a molecular understanding of pleiotropy. Genetics. 2006;173:1885–1891. doi: 10.1534/genetics.106.060269. [DOI] [PMC free article] [PubMed] [Google Scholar]
- Hillenmeyer ME, et al. The chemical genomic portrait of yeast: uncovering a phenotype for all genes. Science. 2008;320:362–365. doi: 10.1126/science.1150021. [DOI] [PMC free article] [PubMed] [Google Scholar]
- Ibarra RU, Edwards JS, Palsson BO. Escherichia coli K-12 undergoes adaptive evolution to achieve in silico predicted optimal growth. Nature. 2002;420:186–189. doi: 10.1038/nature01149. [DOI] [PubMed] [Google Scholar]
- Kafri R, Dahan O, Levy J, Pilpel Y. Preferential protection of protein interaction network hubs in yeast: evolved functionality of genetic redundancy. Proc Natl Acad Sci USA. 2008;105:1243–1248. doi: 10.1073/pnas.0711043105. [DOI] [PMC free article] [PubMed] [Google Scholar]
- Kandror O, DeLeon A, Goldberg AL. Trehalose synthesis is induced upon exposure of Escherichia coli to cold and is essential for viability at low temperatures. Proc Natl Acad Sci USA. 2002;99:9727–9732. doi: 10.1073/pnas.142314099. [DOI] [PMC free article] [PubMed] [Google Scholar]
- Kondrashov FA, Koonin EV. A common framework for understanding the origin of genetic dominance and evolutionary fates of gene duplications. Trends Genet. 2004;20:287–290. doi: 10.1016/j.tig.2004.05.001. [DOI] [PubMed] [Google Scholar]
- Lenski RE, Barrick JE, Ofria C. Balancing robustness and evolvability. PLoS Biol. 2006;4:e428. doi: 10.1371/journal.pbio.0040428. [DOI] [PMC free article] [PubMed] [Google Scholar]
- Lercher MJ, Pal C. Integration of horizontally transferred genes into regulatory interaction networks takes many million years. Mol Biol Evol. 2008;25:559–567. doi: 10.1093/molbev/msm283. [DOI] [PubMed] [Google Scholar]
- Liang H, Li WH. Gene essentiality, gene duplicability and protein connectivity in human and mouse. Trends Genet. 2007;23:375–378. doi: 10.1016/j.tig.2007.04.005. [DOI] [PubMed] [Google Scholar]
- Liao BY, Zhang J. Mouse duplicate genes are as essential as singletons. Trends Genet. 2007;23:378–381. doi: 10.1016/j.tig.2007.05.006. [DOI] [PubMed] [Google Scholar]
- Mahadevan R, Schilling CH. The effects of alternate optimal solutions in constraint-based genome-scale metabolic models. Metab Eng. 2003;5:264–276. doi: 10.1016/j.ymben.2003.09.002. [DOI] [PubMed] [Google Scholar]
- Musso G, et al. The extensive and condition-dependent nature of epistasis among whole-genome duplicates in yeast. Genome Res. 2008;18:1092–1099. doi: 10.1101/gr.076174.108. [DOI] [PMC free article] [PubMed] [Google Scholar]
- Nowak MA, Boerlijst MC, Cooke J, Smith JM. Evolution of genetic redundancy. Nature. 1997;388:167–171. doi: 10.1038/40618. [DOI] [PubMed] [Google Scholar]
- Ochman H, Wilson AC. Evolution in bacteria: evidence for a universal substitution rate in cellular genomes. J Mol Evol. 1987;26:74–86. doi: 10.1007/BF02111283. [DOI] [PubMed] [Google Scholar]
- Pal C, Papp B, Lercher MJ. Adaptive evolution of bacterial metabolic networks by horizontal gene transfer. Nat Genet. 2005;37:1372–1375. doi: 10.1038/ng1686. [DOI] [PubMed] [Google Scholar]
- Papin JA, Price ND, Edwards JS, Palsson BB. The genome-scale metabolic extreme pathway structure in Haemophilus influenzae shows significant network redundancy. J Theor Biol. 2002;215:67–82. doi: 10.1006/jtbi.2001.2499. [DOI] [PubMed] [Google Scholar]
- Papp B, Pal C, Hurst LD. Metabolic network analysis of the causes and evolution of enzyme dispensability in yeast. Nature. 2004;429:661–664. doi: 10.1038/nature02636. [DOI] [PubMed] [Google Scholar]
- Podlaha O, Zhang J. Positive selection on protein-length in the evolution of a primate sperm ion channel. Proc Natl Acad Sci USA. 2003;100:12241–12246. doi: 10.1073/pnas.2033555100. [DOI] [PMC free article] [PubMed] [Google Scholar]
- Price ND, Papin JA, Palsson BO. Determination of redundancy and systems properties of the metabolic network of Helicobacter pylori using genome-scale extreme pathway analysis. Genome Res. 2002;12:760–769. doi: 10.1101/gr.218002. [DOI] [PMC free article] [PubMed] [Google Scholar]
- Price ND, Reed JL, Palsson BO. Genome-scale models of microbial cells: evaluating the consequences of constraints. Nat Rev Microbiol. 2004;2:886–897. doi: 10.1038/nrmicro1023. [DOI] [PubMed] [Google Scholar]
- Reed JL, Vo TD, Schilling CH, Palsson BO. An expanded genome-scale model of Escherichia coli K-12 (iJR904 GSM/GPR) Genome Biol. 2003;4:R54. doi: 10.1186/gb-2003-4-9-r54. [DOI] [PMC free article] [PubMed] [Google Scholar]
- Segre D, Deluna A, Church GM, Kishony R. Modular epistasis in yeast metabolism. Nat Genet. 2005;37:77–83. doi: 10.1038/ng1489. [DOI] [PubMed] [Google Scholar]
- Segre D, Vitkup D, Church GM. Analysis of optimality in natural and perturbed metabolic networks. Proc Natl Acad Sci USA. 2002;99:15112–15117. doi: 10.1073/pnas.232349399. [DOI] [PMC free article] [PubMed] [Google Scholar]
- Sliwa P, Korona R. Loss of dispensable genes is not adaptive in yeast. Proc Natl Acad Sci USA. 2005;102:17670–17674. doi: 10.1073/pnas.0505517102. [DOI] [PMC free article] [PubMed] [Google Scholar]
- Steinmetz LM, et al. Systematic screen for human disease genes in yeast. Nat Genet. 2002;31:400–404. doi: 10.1038/ng929. [DOI] [PubMed] [Google Scholar]
- Wagner A. Distributed robustness versus redundancy as causes of mutational robustness. BioEssays. 2005a;27:176–188. doi: 10.1002/bies.20170. [DOI] [PubMed] [Google Scholar]
- Wagner A. Energy constraints on the evolution of gene expression. Mol Biol Evol. 2005b;22:1365–1374. doi: 10.1093/molbev/msi126. [DOI] [PubMed] [Google Scholar]
- Wagner A. Robustness and evolvability in living systems. Princeton (NJ): Princeton University Press; 2005c. [Google Scholar]
- Wang Z, Zhang J. Why is the correlation between gene importance and gene evolutionary rate so weak? PLoS Genet. 2009;5:e1000329. doi: 10.1371/journal.pgen.1000329. [DOI] [PMC free article] [PubMed] [Google Scholar]
- Zhang J, Webb DM. Evolutionary deterioration of the vomeronasal pheromone transduction pathway in catarrhine primates. Proc Natl Acad Sci USA. 2003;100:8337–8341. doi: 10.1073/pnas.1331721100. [DOI] [PMC free article] [PubMed] [Google Scholar]
Associated Data
This section collects any data citations, data availability statements, or supplementary materials included in this article.