Abstract
Chicken Repeat 1 (CR1) repeats are the most abundant family of repeats in the chicken genome, with more than 200,000 copies accounting for ∼80% of the chicken interspersed repeats. CR1 repeats are believed to have arisen from the retrotransposition of a small number of master elements, which gave rise to the 22 CR1 subfamilies as previously reported in Repbase. We performed a global assessment of the divergence distributions, phylogenies, and consensus sequences of CR1 repeats in the chicken genome. We identified and validated 57 chicken CR1 subfamilies and further analyzed the correlation between these subfamilies and their regional GC contents. We also discovered one novel lineage-specific CR1 subfamilies in turkeys when compared with chickens. We built an evolutionary tree of these subfamilies and concluded that CR1 repeats may play an important role in reshaping the structure of bird genomes.
Keywords: CR1 repeats, comparative genomics, chicken genome
Introduction
Most bird species have smaller genomes and fewer repeats than mammals. The chicken genome (∼1,200 Mb) is approximately 40% of the size of the human genome, and repetitive elements make up only 15% of it, as compared with the 45% in the human genome (International Chicken Genome Sequencing Consortium 2004; Wicker et al. 2005). As a non–long terminal repeat retrotransposon, Chicken Repeat 1 (CR1) is the most abundant repeat family, belonging to long interspersed nuclear elements and with more than 200,000 copies accounting for ∼80% of the chicken interspersed repeats (International Chicken Genome Sequencing Consortium 2004). Recent work increasingly recognizes that CR1 elements have a greater impact than expected on chicken genome evolution (Abrusan et al. 2008). It has been suggested that the relatively small genome size of birds in general, and chicken in particular, may reflect selective pressure to optimize metabolism and to minimize the amount of repetitive DNA (Gregory 2002; Wicker et al. 2005).
A full-length CR1 is estimated to be 4.5 kb and contains a (G + C)-rich internal promoter region, followed by two protein-coding sequences (Haas et al. 2001; International Chicken Genome Sequencing Consortium 2004). The exact function of ORF1 is not known. ORF2 encodes endonuclease and reverse transcriptase domains and catalyzes the critical step of the retrotransposition process. The high specificity of ORF2 reverse transcriptase activity may explain the lack of other nonautonomous elements, including short interspersed sequence elements and pseudogenes in the chicken genome (International Chicken Genome Sequencing Consortium 2004). Due to the truncation at their 5′ ends, most CR1 fragments are left with a few hundred base pairs at their 3′ ends, suggesting the premature termination of reverse transcription (Abrusan et al. 2008). Unlike mammalian L1 elements, CR1 elements do not create target site duplications. Although their 5′-untraslated region (UTR) are divergent, CR1’s 3′-UTR are well conserved, ending with 2–4 copies of 8-bp repeat (ATTCTRTG) and lacking a polyadenylic acid tail, in all chicken CR1 subfamilies as well as in the turtle CR1 and the ancient L3 element (Haas et al. 2001; International Chicken Genome Sequencing Consortium 2004).
CR1 elements are divided into subfamilies based on the extent of sequence diversity. Six CR1 subfamilies were initially identified based on 52 elements with the complete 3′ ends (Vandergon and Reitman 1994). The RECON analysis of the chicken genome generated a total of 22 CR1 subfamilies, including 11 full-length (4.1–4.8 kb) and 11 additional (3′ end 1.0–1.1 kb) CR1 subfamilies, when only 3′ end sequences were considered (International Chicken Genome Sequencing Consortium 2004). Phylogenetic analysis of the ORF2 sequences using the 11 full-length CR1 subfamilies in the chicken genome indicated that several remarkably divergent CR1 elements have been existing and active in chickens, whereas in mammals, a single lineage of L1 has been dominant (International Chicken Genome Sequencing Consortium 2004). The mixing of turtle and chicken CR1 elements in this ORF2-based phylogenetic tree also suggested that the oldest CR1 elements may predate the reptile–bird speciation (International Chicken Genome Sequencing Consortium 2004). Based on CR1 subfamily sequence diversity, a major burst in CR1 amplification was estimated to occur approximately 45 Ma and since then gradually declined (Abrusan et al. 2008). It is not clear whether these CR1 is still active in the chicken at present. The chicken CR1 subfamilies have also been determined in different evolutionary ages with overlap by a transposon-interruption analysis (Giordano et al. 2007; Abrusan et al. 2008).
To date, characterization of CR1 repeats has been limited to the chicken (International Chicken Genome Sequencing Consortium 2004). For other birds, most studies have been based on polymerase chain reaction (PCR) cross-amplification among diverse bird taxa and, therefore, are potentially biased to either conserved regions or limited to closely related species (St John et al. 2005; Watanabe et al. 2006). Due to their unidirectional mode of evolution, CR1 insertions have been used as largely homoplasy-free character states in cladistic analyses of reptiles (Shedlock 2006) and birds like chickens, geese, and penguins (St John et al. 2005; Watanabe et al. 2006). CR1 insertion loci have also been used to clarify relationships among rockfowls, crows, and ravens (Treplin and Tiedemann 2007).
Using a novel method (Alucode), Pevzner and colleagues identified more human “Alu” subfamilies at a much finer resolution than previously recognized (Price et al. 2004). This method first splits repeat subfamilies based on “biprofiles,” that is, linkage of pairs of nucleotide values and then used the calibration of mutation rates to split subfamilies containing overrepresented individual mutations. In this study, we applied this method to further characterize the chicken CR1 elements and identified 35 new CR1 subfamilies. In addition, we discovered a potential lineage-specific CR1 repeat element in the turkey. Considering turkey diverged from chickens approximately 25–30 Ma (Griffin et al. 2008), our comparative analysis revealed that the activities of CR1 vary in different bird lineages. The new classification of CR1 repeats will provide insights into their diversity and biology.
Material and Methods
Genomic and BAC End Sequences
The Chicken genome assembly (galGal3) and repeat annotations were downloaded from the UCSC genome browser (http://genome.ucsc.edu/). Bacteria artificial chromosome (BAC) libraries were constructed in Dr Peter de Jong's lab at Children's Hospital Oakland Research Institute, Oakland, CA (http://www.chori.org/bacpac/), for the common turkey (Meleagris gallopavo CH260). Genomic sequences from turkey (CH260) were generated in NIH Intramural Sequencing Center. Most of these BACs are from the greater cystic fibrosis transmembrane conductance regulator. In total, we retrieved 29 loci (6,192,853 bp) for turkey genomic sequence from GenBank. We also collected 20,388 BAC end sequences (9,850,138 bp) generated by Dr Reed from University of Minnesota.
CR1 Element Identification and Phylogenetic Analyses
To investigate the relationship between CR1 subfamilies, we used 22 consensus sequences of the previously described subfamilies B–F as well as CR1-X and CR1-Y from Repbase (http://www.girinst.org/, version 9.04, and International Chicken Genome Sequencing Consortium 2004). We detected CR1 repeat elements using the slow search option (-s) of RepeatMasker (version open-3.1.0). For this study, only the 3′ terminal region of ORF2 was used because most CR1 elements are found as short fragments of the 3′ region less than 1,000 bp (International Chicken Genome Sequencing Consortium 2004). The default chicken CR1 consensus sequences were trimmed to 465 bp from nucleotide positions 3944–4408 (accession number U88211), corresponding to amino acid positions 818–972 of the consensus protein for ORF-2 (accession number AAC60281; Haas et al. 2001; Wicker et al. 2005). We selected all CR1 repeats (17,441) with at least 98% length of the 465-bp consensus segments.
Sequence divergences of CR1 elements from the consensus sequences were computed by RepeatMasker. Divergence levels reported by RepeatMasker were corrected for the CpG content of each repeats by DCpG = D/(1 + 9FCpG), where FCpG is the frequency of CpG dinucleotides in the consensus and DCpG is further corrected with the Jukes–Cantor formula for multiple substitutions (Abrusan et al. 2008). Distribution histograms were plotted using a 0.01 bin size. We calculated the mean and standard deviation (SD) of the divergence distribution. We used the mean of 9.0 substitutions/site (%) as the threshold to define “young” or “ancient” subfamilies. We used the SD of 5.0% to decide one or two modes. One-mode distributions were labeled as Y (young) or A (ancient), whereas two-mode distributions were labeled as AY or AA. For major branches within phylogenetic trees, multiple sequence alignments were performed with ClustalW at default settings. The consensus sequences were derived using the simple majority rule. Degenerated nucleotides were defined according to the standard IUPAC codes. MEGA (Kumar et al. 2001) was used to construct Neighbor-Joining (NJ) trees using Kimura 2-parameter model. The minimum spanning (MS) trees of chicken CR1 subfamilies, that is, the tree with CR1 subfamilies as nodes that minimizes the sum of edge distances, were constructed using the Alucode modified specifically for CR1 (i.e., length = 465). We tested multiple subfamilies as the consensus sequence including CR1-C2, C4, and X. Under the null hypothesis of uniformity, the P value for the linkage was calculated using the nonparametric computation as described by Price et al. (2004). Because this code can run on a wide range of resolutions, it can split a CR1 population into multiple subfamilies. Based on the size of our data (17,441 or 1,732 CR1 elements extracted from chicken and turkey genome, respectively), we chose MINCOUNT = 150 or 10 and CR1-C4 as the consensus sequence with all other default parameters. Under this setting, MS trees had similar stable topologies and numbers of CR1 subfamilies as the conventional NJ method.
To analyze the correlations between different CR1 subfamilies in a region and its GC content, we used the method as previously described (Abrusan et al. 2008). Briefly, the GC distributions of the chicken genome were calculated by dividing the entire genome into 30-kb nonoverlapping windows, excluding repetitive elements. The local GC content of repeats was calculated in two 15-kb windows flanking each CR1 element. To reduce the sampling bias, we did this analysis on 123,084 reannotated chicken CR1 elements without a length requirement (i.e., 465 bp). We did not include random chromosomes or ancestral elements like LINE3. Relative frequencies of CR1 class within a GC range were standardized relative to its average density in the genome.
Results
CR1 Repeat Identification and Sequence Divergence Distribution
We analyzed the chicken genome assembly (galGal3) and currently available turkey sequences (6.2 Mb of BAC insert sequences and 9.9 Mb of BAC end sequences). We utilized RepeatMasker (Smit 1999) to identify CR1 elements. We then extracted all nearly full-length CR1 elements whose insert length was ≥98% of the corresponding consensus sequence length (465 bp). Compared with the chicken genome (104 repeats/Mb, 15 nearly full-length repeats/Mb), the turkey genome shows a slightly lower density of CR1 repeats (95 repeats/Mb, 9 nearly full-length repeats/Mb).
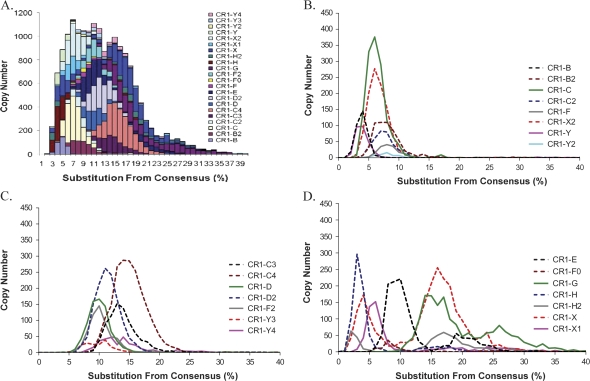
We performed a CR1 divergence distribution analysis of the chicken genome using the 22 previously known CR1 subfamilies (International Chicken Genome Sequencing Consortium 2004). The divergence levels reported by RepeatMasker were corrected by the CpG content of each repeat and multiple hits. We plotted the divergence (i.e., substitution from consensus) distribution either by summing all 22 subfamilies or separately for each subfamily (fig. 1, bin size = 0.01). In the stacking plot (fig. 1A), a plateau of bursts in CR1 amplification was detected (count in each bin >800 ranging from 0.05 to 0.17) and estimated to occur approximately 14 and 48 Ma assuming a substitution rate of 3.6 × 10⁻⁹ substitutions/site/year (Axelsson et al. 2005; Abrusan et al. 2008). Notable differences among the distributions were observed when each CR1 subfamily was considered: 1) B, B2, C, C2, F, H, X2, Y, and Y2 subfamilies show a dominant young divergence profile with a mode less than 0.09 substitutions/site (fig. 1B, labeled as “Y” in table 1); 2) C3, C4, D, D2, F2, Y3, and Y4 subfamilies show a dominant ancient divergence profile with a mode greater than 0.09 substitutions/site (fig. 1C, labeled as “A” in table 1); 3) In contrast, E, F0, G, H2, X, and X1 subfamilies show a broader distribution with at least two modes, which are often separated on either side of 0.09 substitutions/site (fig. 1D, labeled as “YA” in table 1). The only exceptions are E and G subfamilies, in which both two modes are greater than 0.09 substitutions/site (labeled as “AA” in table 1). The multiple modes suggest that those subfamilies may represent a mixed population and could be further divided into distinct subfamilies.
FIG. 1.—
Sequence divergences of 22 previously known CR1 families. (A) The sequence divergence distribution of 22 CR1 families in the chicken genome in bins corresponding to 0.01 increments. The sequence divergence distributions are plotted for each CR1 subfamily in (B) for young, (C) for ancient, and (D) for two-mode subfamilies.
Table 1.
Divergences of 22 Previously Known CR1 Elements in the Chicken Genome
| Subfamily | Average Divergence (%) | SD | Type |
| CR1-B | 3.52 | 2.19 | Y |
| CR1-Y | 4.15 | 4.50 | Y |
| CR1-C | 5.92 | 2.15 | Y |
| CR1-X2 | 6.13 | 2.36 | Y |
| CR1-Y2 | 7.37 | 1.65 | Y |
| CR1-C2 | 7.41 | 3.24 | Y |
| CR1-B2 | 7.72 | 3.03 | Y |
| CR1-F | 8.63 | 4.25 | Y |
| CR1-Y3 | 9.28 | 2.14 | A |
| CR1-D | 9.73 | 2.74 | A |
| CR1-F2 | 9.85 | 2.52 | A |
| CR1-D2 | 11.02 | 2.37 | A |
| CR1-Y4 | 13.46 | 2.95 | A |
| CR1-C3 | 13.55 | 4.32 | A |
| CR1-C4 | 14.59 | 2.81 | A |
| CR1-H | 4.92 | 5.47 | YA |
| CR1-X1 | 9.97 | 8.45 | YA |
| CR1-F0 | 11.29 | 7.50 | YA |
| CR1-E | 11.82 | 5.23 | AA |
| CR1-X | 13.69 | 6.55 | YA |
| CR1-H2 | 14.41 | 7.96 | YA |
| CR1-G | 19.39 | 6.31 | AA |
NOTE.—After correction for the CpG content and multiple hits, we calculated the mean and SD of the divergence distribution. The mean of 9.0 substitutions from consensus (%) was used as the threshold to define Y (young) or A (ancient) subfamilies. The SD of 5.0% was used to decide one or two modes. One-mode distributions were labeled as Y or A, whereas two-mode distributions are labeled as YA or AA.
Characterization of Chicken CR1 Elements and Their Relationships at a Fine Resolution
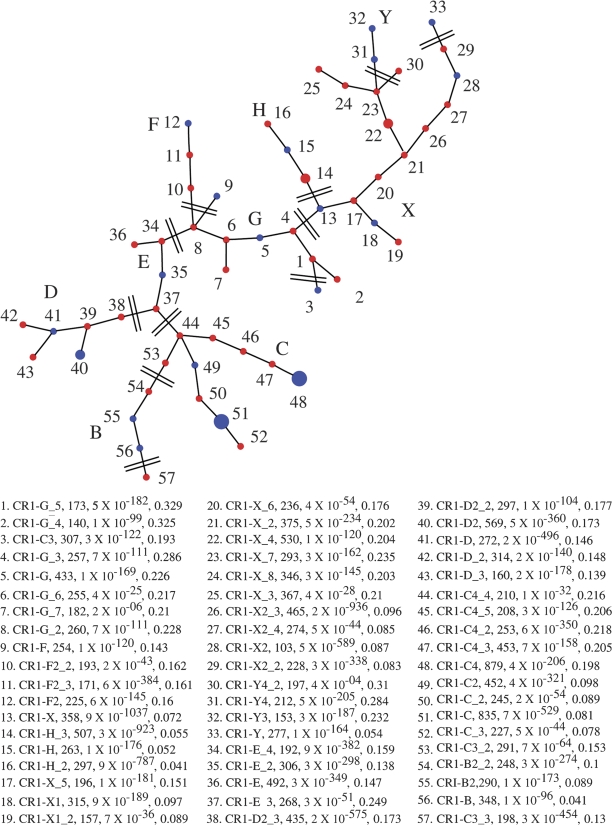
We first categorized the chicken CR1 subfamilies using the custom program modified from Alucode (Price et al. 2004). Based on our analysis of 17,441 CR1 repeats from the chicken genome, we identified 57 distinct subfamilies: the subfamily composition ranges from 107 to 879 with most subfamilies containing 150–450 elements (P values for subfamily partition ranges from 3 × 10−298 to 4 × 10⁻⁴, see Price et al. [2004] for the P value definition and calculation). We next constructed a MS tree for these 57 CR1 subfamilies to summarize their evolutionary relationship (fig. 2, see Supplementary Material online for sequences). We identified approximately 35 new subfamilies (fig. 2, red dots) besides most of the previously known CR1 subfamilies (fig. 2, blue dots). A simplified version of their relationship is shown in figure 3. Generally, we found a good agreement between the divergence distributions and this MS tree. Subfamilies C, E, G, X, and Y have wide divergence ranges and may have been coexisting for a long time (represented by solid bars). Subfamilies G, X, and Y are loosely related. Subfamilies E and D are closely associated and they are linked to G. Subfamily C are related to E. Subfamily H is derived from X, whereas F is derived from G (labeled as arrows). Subfamilies B and B2 are the youngest subfamily, and they directly derived from C (labeled as arrows).
FIG. 2.—
The MS tree of 57 chicken CR1 subfamilies. This tree is based on an analysis of 17,441 CR1 repeats extracted from the chicken genome. Previously known CR1 subfamilies are labeled in blue, whereas new putative CR1 subfamilies are labeled in red. Large nodes: subfamilies with more than 800 elements; medium nodes: 800–500 elements; small nodes: less than 500 elements. The number, P value, and sequence divergence of CR1 elements within each group are indicated in legend.
FIG. 3.—
A simplified classification of 57 chicken CR1 subfamilies. This diagram is a simplified version of the MS tree (fig. 2). The sequence divergences of merged subfamilies were based on figure 1 and table 1. The solid bars represent multiple CR1 subfamilies that have overlapping sequence divergence (i.e., may coexist). The arrows represent young subfamilies derived from the ancient subfamilies.
Characterization of Lineage-Specific CR1 Repeat Elements from Turkey Sequences
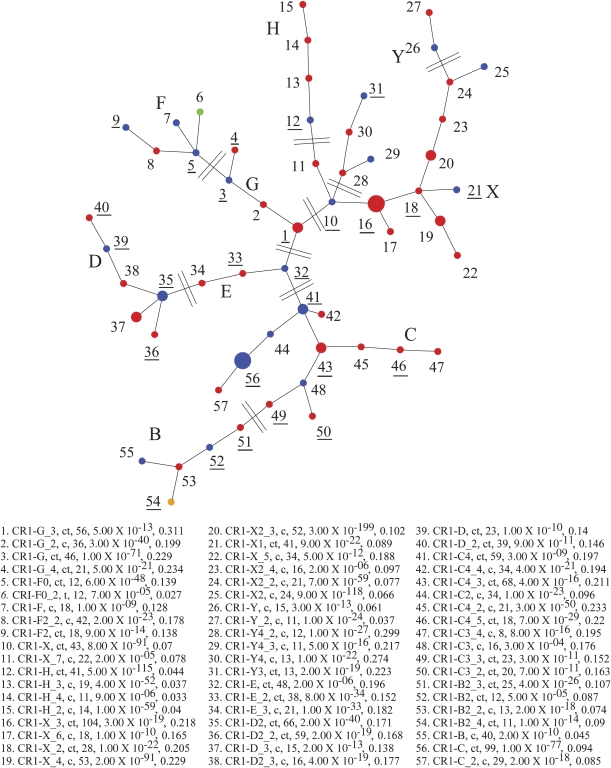
We used two distinct approaches to study lineage-specific CR1 subfamilies in the chicken–turkey comparison. First, we categorized CR1 subfamilies using the program Alucode (Price et al. 2004). Based on our analysis of 59 turkey CR1 repeats and 1,732 randomly selected chicken CR1 repeats, we also identified a similar number (57) of distinct subfamilies: The subfamily composition ranges from 8 to 100 with most subfamilies containing 10–50 elements (P value for subfamily partition ranges from 5 × 10⁻⁵ to 3 × 10⁻⁴. We next constructed a MS tree for these 57 CR1 subfamilies to summarize their evolutionary relationship (fig. 4). The topology of this tree is similar to the MS tree derived from the whole-genome analysis. We identified 26 subfamilies shared between chicken and turkey species (numbers underlined, labeled as “ct”), 1 subfamily only in turkey (labeled as Dot 6: CR1_F0_2, t, 12, 7 × 10⁻⁵, 0.027) and 30 subfamilies only in chicken (labeled as “c”).
FIG. 4.—
The MS tree of chicken–turkey CR1 comparison. This tree is based on an analysis of 59 turkey CR1 repeats and 1,732 randomly selected chicken CR1 repeats. Previously known CR1 subfamilies are labeled in blue, whereas new putative CR1 subfamilies are labeled in red. Large nodes: subfamilies with more than 80 elements; medium nodes: 80–50 elements; small nodes: less than 50 elements. The type, P value, and sequence divergence of CR1 elements within each group are indicated. Twenty-six subfamilies are shared between chicken and turkey species (subfamily numbers underlined and labeled as ct); only one subfamily is specific in turkey (green, Dot 6: CR1_F0_2, t, 12, 7 × 10⁻⁵, 0.027), and 30 subfamilies are only present in chicken (numbers not underlined and labeled as c).
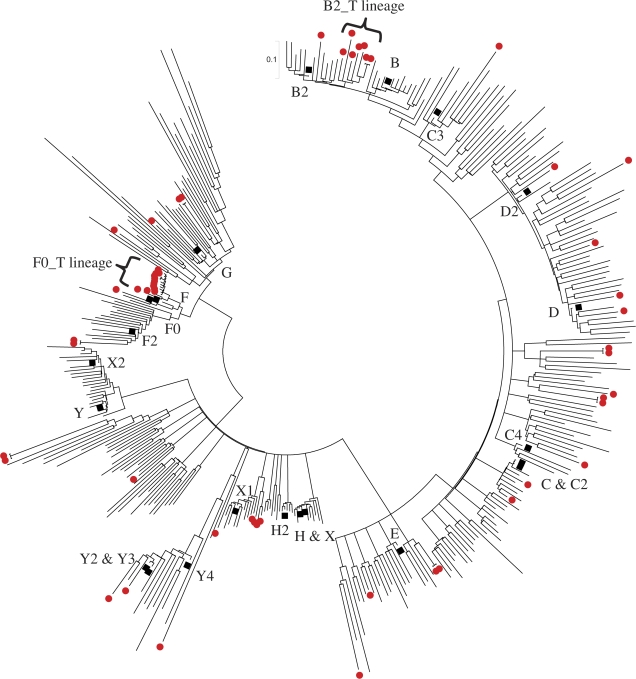
As a second method, we constructed a NJ tree independently for 59 turkey CR1 repeats (red dots) as well as randomly selected 300 chicken CR1 repeats (fig. 5). The random samplings of 300 CR1 repeats were repeated multiple times and all replicates produced constant results. This tree has several major branches: 1) on the left are chicken and turkey ancestral G (0–50%) and Y (18–47%), which were old and not supported by bootstrapping, interleaved together with F (91–100%) and X2 (59–64%), which were supported by bootstrapping. These G and Y subfamilies might represent degenerated copies of ancestral events. 2) On the bottom are subfamilies H2, H, and X. From the divergent distance, they look younger and may be still active more recently. 3) On the right are CR1 lineages including both ancestral and young elements: ancestral ones (E, D, D2, C4, and C3) may be dead on arrival, whereas young ones (C, C2, B, and B2) may be still active more recently agreeing well with the MS tree results (fig. 4).
FIG. 5.—
NJ trees of chicken–turkey CR1 comparison. This NJ tree includes 59 turkey CR1 repeats (red dots) and 300 randomly selected chicken CR1 repeats (lineages without dots). The major branches are labeled with subfamily names: 1) On the left are chicken and turkey ancestral G and Y, which were old and not supported by bootstrapping, interleaved together with F and X2 which were supported by bootstrapping; 2) On the bottom are subfamilies H2, H, and X; and 3) On the right are CR1 lineages including both ancestral (E, D, D2, C4, and C3) and young (C, C2, B, and B2) subfamilies. Subfamilies X2, Y, H2, H, X, B, and B2 only contain chicken elements but not turkey elements. Two putative turkey-specific groups were identified and labeled as brackets: the F0_T lineage and the B2_T lineage. Only the F0_T lineage was supported by the bootstrap values of 88% with n = 1,000 replicates.
Subfamilies X2, Y, H2, H, X, B, and B2 only contain chicken elements and do not mix with any turkey elements. They have short-length (young) and multiple branches (active) suggesting that these younger CR1 elements may be active only in chicken. However, their lineage specificities are not totally established and need to be tested again using larger turkey sequence data in the future. Two putative turkey-specific groups were identified and labeled as the F0_T lineage and the B2_T lineage. Only the F0_T lineage was supported by a strong bootstrapping (88%) as a monophyletic clade, which appears to be turkey lineage-specific, corresponding to Dot 6 (green) in figure 4. The B2_T lineage was not supported by bootstrapping and corresponds to Dot 54 (orange) in figure 4. Based on the majority rule, this turkey CR1 consensus sequences were derived from the F0_T group of 12 turkey CR1 repeats.
Subfamily Consensus Sequences and Phylogeny
We performed phylogenetic analyses (NJ trees) on this turkey and those 57 chicken CR1 consensus sequences as well as 22 known chicken CR1 subfamilies (fig. 6). All new CR1 consensus sequences can be found in additional supplementary file S2 (see Supplementary Material online).
FIG. 6.—
NJ trees of chicken and turkey CR1 consensus sequences. This NJ tree includes 57 chicken (with postfix of “MS”) and 1 turkey (CR1-F0-T12, pointed by an arrow) CR1 consensus sequences identified by the current study and 22 previously known chicken CR1 consensus sequences. The confirmations of previously known consensus sequences by the new chicken CR1 subfamilies are labeled by black brackets. The newly derived subfamilies are labeled by red brackets. All branches are labeled with the bootstrap values (>50%) with n = 1,000 replicates.
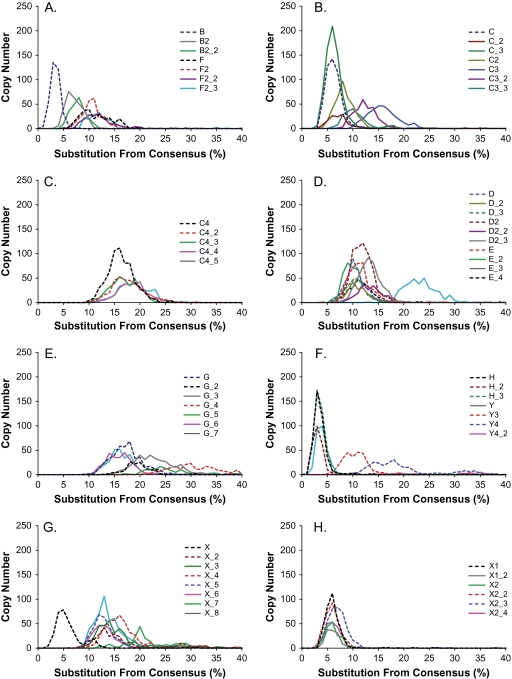
In the NJ tree shown in figure 6, the relationship among known chicken CR1 consensus sequences was recovered as expected. All 22 known subfamilies were confirmed and covered by new consensus sequences (labeled as black brackets). The sequence distances between known consensus sequences and their closest neighbors within the 57 new consensus sequences range from 0.000 to 0.069, with an average of 0.015 and SD of 0.015. The few discrepancies between our consensus sequences and the consensus sequences reported in Repbase occur mostly at CpG dinucleotide positions, which are ill determined because of frequent mutation. In spite of the above-mentioned ancestry sharing, 35 new consensus sequences were discovered (fig. 6, labeled by red brackets). The new subfamilies include 1) X (7), G (6), and C4 (4); 2) three new subfamilies for E and X2; 3) two new subfamilies for D, D2, and F; and 4) one new subfamilies for B2, C, C3, X1, H, and Y4. Overwhelming majority of newly discovered consensus sequences (80% or 28/35) come from those subfamilies with ancient populations or with two modes, including X, G, C4, E, D, D2, C3, X1, H, and Y4. Importantly, near half of them (17/35) are from three subfamilies X, G, and C4. Genome-wide divergence distributions were calculated for these 57 new consensus sequences (fig. 7). Most of the newly discovered subfamilies (50/57) have symmetric divergence distributions with only one mode. Only seven of them have two modes and they are all ancient subfamilies, including subfamilies G_4, G_5, X_2, X_4, X_7, Y4, and Y4_2 (see supplementary table S1, Supplementary Material online). Agreeing with the MS and NJ trees, the turkey CR1-F0-T12 subfamily (labeled by an arrow) shares ancestry from the chicken F subfamilies but has its own trajectory of evolution since divergence.
FIG. 7.—
Sequence divergences of 57 newly indentified chicken CR1 families. The sequence divergence distribution of 57 new indentified CR1 families in the chicken genome in bins corresponding to 0.01 increments. Panels are organized to show related subfamilies.
Correlation between CR1 Subfamilies and Their regional GC Contents
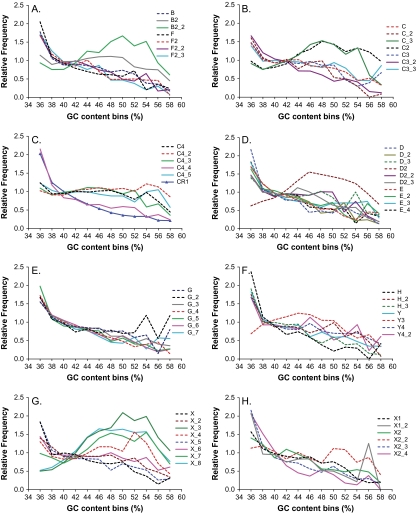
To provide further insights about the causes or consequences of this complexity, we performed an analysis between CR1 subfamilies and their regional GC contents in the chicken genome. Based on our whole-genome analysis of 123,084 reannotated chicken CR1 elements, we found that like mouse and human L1 repeats, CR1 repeats are most abundant in AT-rich regions (fig. 8). An overall distribution of all CR1 repeat as a function of local GC content is presented in figure 8C (CR1: the solid blue line with triangular symbols). The overwhelming majority of CR1 subfamilies (over 80%, 46/57) follow this trend (i.e., increased density in AT-rich regions and decreased density in GC-rich regions). On the other hand, there are 11 subfamilies (i.e., B2, B2_2, C_3, C2, D2, X_3, X_4, X_7, X_8, X2_2, and Y3) showing increased density in GC-rich regions and/or decreased density in AT-rich regions as compared with the overall CR1 distribution. It is interesting to note that some related families like B2 and B2_2, which have comparable abundances and ages, show distinct distributions according to the local GC content (fig. 8A). To compare their chromosomal distributions, we recorded their events on chrZ, macro-, and microchromosomes and calculated the ratios between their relative frequencies (table 2). Although B2_2 is slightly underrepresented on chrZ and similarly represented on macrochromosomes as compared with B2, these variations are not significantly different by the χ2 test. On the other hand, we observed that B2_2 is significantly overrepresented in microchromosomes (P value = 0.047, χ2 test).
FIG. 8.—
Distributions of CR1 subfamilies in regions of different GC content. The graph shows the relative distribution of various CR1 subfamilies as a function of local GC content. An overall distribution of all CR1 repeats as a function of local GC content is presented in panel (C) (labeled as CR1: the solid blue line with triangular symbols, that is, increased density in AT-rich regions and decreased density in GC-rich regions). Over 80% of CR1 subfamilies (46/57) follow this trend. As compared with the overall CR1 distribution, the left 11 subfamilies show increased density in GC-rich regions and/or decreased density in AT-rich regions, including B2, B2_2 (in panel A), C_3, C2 (in panel B), D2 (in panel D), X_3, X_4, X_7, X_8 (in panel G), X2_2 (in panel H), and Y3 (in panel F).
Table 2.
Chromosomal Distributions of CR1-B2 and B2_2 Elements in the Chicken Genome
| ChrZ | Macrochromosomes | Microchromosomes | All | |
| B2 | 162 (9.55%) | 1381 (81.43%) | 153 (9.02%)a | 1,696 |
| B2_2 | 139 (7.71%) | 1463 (81.19%) | 200 (11.10%)a | 1,802 |
| Ratio | 0.81 | 1.00 | 1.23 |
NOTE.—We recorded B2 and B2_2 events on chrZ, macro-, and microchromosomes and calculated the ratios between their relative frequencies.
We observed that B2_2 is significantly overrepresented in microchromosomes (P value = 0.047, χ2 test).
Discussion
In this project, we performed a global characterization of CR1 elements in the chicken genomes using an integrated approach combining two distinct phylogenetic methods: NJ and MS trees. We identified 35 new chicken and 1 turkey lineage-specific CR1 consensus sequence. Our analysis supports a model in which a burst of CR1 activities occurred between 14–48 Ma, with multiple master CR1 genes involved in the chicken lineages. These observations generally support that CR1 subfamilies originated through the fixation of multiple master CR1 elements. Our turkey CR1 analyses were based on two combined data sets: BAC end sequences data and finished genomic sequences. We identified the same turkey-specific CR1 subfamilies using two independent analyses (MS and NJ trees). Compared with PCR cross-species amplification, our approach is potentially less biased capturing a broader spectrum of repeat diversity.
Our results have confirmed previous analysis (Abrusan et al. 2008) as well as provided new insights with respect to evolutionary relationships of the CR1 subfamilies. Our results explain the earlier observation that the most recently active CR1 elements in chicken (CR1-F and CR1-B) are less than 70% identical over their ORF2-coding region because they derived from different lineages CR1-G and CR1-C, respectively. The earlier results based on insertion order/rank analysis suggested that 1) X, X1, Y4, and C4 are the most ancient CR1 subfamilies, with C4 being the most common; 2) C, C3, D, D2, E, G, H, X2, Y, and Y3 represent the major burst of CR1 elements; and 3) B, B2, C, C2, F, F0, F2, H2, and Y2 are among the youngest subfamilies. On the other hand, our data indicated that a subset of CR1-G belongs to the most ancient group and parts of CR1-H, X, X1, and X2 belong to the youngest group.
One source of these discrepancies may relate to that we limited our analyses to the 465 bp of the 3′ terminus (155 amino acids) of ORF2. Other studies based on longer 3′ terminus (∼1,000 bp) of or full-length ORF2 (Abrusan et al. 2008). Because the vast majority of CR1s are fragments shorter than 1,000 bp, filtering of RepeatMasker output with a shorter length requirement will preserve more CR1 copies, thus making our samples more representative. Another difference is the two distinct methods were used. The insertion order/rank method does not directly depend on sequence divergences but instead depends on the RepeatMasker program to properly assign repeat subfamily (Giordano et al. 2007). The accuracy of this method also depends on the repeat length and their connectedness with other repeats. The proper subfamily assignment of repeats by RepeatMasker depends on the fact that the consensus sequences are properly constructed and thoroughly verified. The 22 previously known CR1 consensus sequences were constructed by RECON based on the sequence divergence. Due to RECON's clustering algorithm, the 22 CR1 consensus sequences do not necessarily represent distinct subfamilies (Bao and Eddy 2002). For example, both subfamilies X and X1 extend from ancient to young, whereas its relative X2 is among the youngest (fig. 1). Therefore, our results of 57 CR1 subfamilies offer a new refined prospective for CR1 classification and evolution. It is also worthwhile to note that no full-length functional CR1 is annotated as of yet in the chicken or the turkey and the one annotated in reference 1 may have an inactive promoter (International Chicken Genome Sequencing Consortium 2004). Therefore, our inference about recent activity of young CR1s annotated in this study is still restricted to extinct processes. Another limitation in our analysis is that our turkey CR1 repeat sequences were limited; it is likely that by increasing the sample size, additional turkey-specific CR1 subfamilies could be discovered.
As described previously (Abrusan et al. 2008), we also observed that CR1 densities vary among macrochromosomes, intermediate chromosomes, and microchromosomes (data not shown). These variations could be partially due to the uneven GC and length distributions among these chromosome groups (Abrusan et al. 2008). However, when all CR1 data from the chicken genome were pooled and analyzed together, we began to detect a similar pattern like L1 repeats in the human and rodent genomes. We found that over 80% of the 57 families, including both young and ancient CR1 subfamilies, are enriched in regions of high AT content. We did discover gradual changes in distribution among related CR1 subfamilies (such as C, D, E, F, H, and Y) but failed to correlate their distributions with their ages in a constant fashion. It is also possible that certain CR1 subfamilies like the relatively young B2_2 repeats have high insertion preferences in GC-rich regions. Because microchromosomes have higher GC contents, the overrepresentation of B2_2 as compared with B2 on microchromosomes could be an example of genomic “niche partitioning” between simultaneously active transposable elements families.
In summary, our analysis has provided an evolutionary framework for further classification and refinement of the CR1 repeat phylogeny. These new CR1 subfamilies expand our understanding of CR1 evolution and their impacts on bird genome architecture. The differences in the distribution and rates of CR1 activity may play an important role in subtly reshaping the structure of chicken genomes. The functional consequences of these changes among the bird lineages are an important area of future investigation.
Funding
This work was supported in part by National Research Initiative [grant 2007-35205-17869] from the Cooperative State Research, Education, and Extension Service, United States Department of Agriculture and from the Agriculture Research Service, United States Department of Agriculture [project 1265-31000-099-00D].
Supplementary Material
Supplementary table S1 and file S2 is available at Genome Biology and Evolution online (http://www.oxfordjournals.org/our_journals/gbe/).
Supplementary Material
Acknowledgments
We thank E. Eichler and C. Alkan for helpful discussion about Alucode. G.E.L. and J.S. conceived and designed the experiments. L.J. and B.Z. modified the computer programs. G.E.L., L.J., F.T., and J.S. analyzed the data. G.E.L. wrote the paper.
References
- Abrusan G, Krambeck HJ, Junier T, Giordano J, Warburton PE. Biased distributions and decay of long interspersed nuclear elements in the chicken genome. Genetics. 2008;178:573–581. doi: 10.1534/genetics.106.061861. [DOI] [PMC free article] [PubMed] [Google Scholar]
- Axelsson E, Webster MT, Smith NG, Burt DW, Ellegren H. Comparison of the chicken and turkey genomes reveals a higher rate of nucleotide divergence on microchromosomes than macrochromosomes. Genome Res. 2005;15:120–125. doi: 10.1101/gr.3021305. [DOI] [PMC free article] [PubMed] [Google Scholar]
- Bao Z, Eddy SR. Automated de novo identification of repeat sequence families in sequenced genomes. Genome Res. 2002;12:1269–1276. doi: 10.1101/gr.88502. [DOI] [PMC free article] [PubMed] [Google Scholar]
- Giordano J, et al. Evolutionary history of mammalian transposons determined by genome-wide defragmentation. PLoS Comput Biol. 2007;3:e137. doi: 10.1371/journal.pcbi.0030137. [DOI] [PMC free article] [PubMed] [Google Scholar]
- Gregory TR. A bird's-eye view of the C-value enigma: genome size, cell size, and metabolic rate in the class aves. Evolution. 2002;56:121–130. doi: 10.1111/j.0014-3820.2002.tb00854.x. [DOI] [PubMed] [Google Scholar]
- Griffin DK, et al. Whole genome comparative studies between chicken and turkey and their implications for avian genome evolution. BMC Genomics. 2008;9:168. doi: 10.1186/1471-2164-9-168. [DOI] [PMC free article] [PubMed] [Google Scholar]
- Haas NB, et al. Subfamilies of CR1 non-LTR retrotransposons have different 5′UTR sequences but are otherwise conserved. Gene. 2001;265:175–183. doi: 10.1016/s0378-1119(01)00344-4. [DOI] [PubMed] [Google Scholar]
- International Chicken Genome Sequencing Consortium. Sequence and comparative analysis of the chicken genome provide unique perspectives on vertebrate evolution. Nature. 2004;432:695–716. doi: 10.1038/nature03154. [DOI] [PubMed] [Google Scholar]
- Kumar S, Tamura K, Jakobsen IB, Nei M. MEGA2: molecular evolutionary genetics analysis software. Bioinformatics (Oxford) 2001;17:1244–1245. doi: 10.1093/bioinformatics/17.12.1244. [DOI] [PubMed] [Google Scholar]
- Price AL, Eskin E, Pevzner PA. Whole-genome analysis of Alu repeat elements reveals complex evolutionary history. Genome Res. 2004;14:2245–2252. doi: 10.1101/gr.2693004. [DOI] [PMC free article] [PubMed] [Google Scholar]
- Shedlock AM. Phylogenomic investigation of CR1 LINE diversity in reptiles. Syst Biol. 2006;55:902–911. doi: 10.1080/10635150601091924. [DOI] [PubMed] [Google Scholar]
- Smit AF. Interspersed repeats and other mementos of transposable elements in mammalian genomes. Curr Opin Genet Dev. 1999;9:657–663. doi: 10.1016/s0959-437x(99)00031-3. [DOI] [PubMed] [Google Scholar]
- St John J, Cotter JP, Quinn TW. A recent chicken repeat 1 retrotransposition confirms the Coscoroba-Cape Barren goose clade. Mol Phylogenet Evol. 2005;37:83–90. doi: 10.1016/j.ympev.2005.03.005. [DOI] [PubMed] [Google Scholar]
- Treplin S, Tiedemann R. Specific chicken repeat 1 (CR1) retrotransposon insertion suggests phylogenetic affinity of rockfowls (genus Picathartes) to crows and ravens (Corvidae) Mol Phylogenet Evol. 2007;43:328–337. doi: 10.1016/j.ympev.2006.10.020. [DOI] [PubMed] [Google Scholar]
- Vandergon TL, Reitman M. Evolution of chicken repeat 1 (CR1) elements: evidence for ancient subfamilies and multiple progenitors. Mol Biol Evol. 1994;11:886–898. doi: 10.1093/oxfordjournals.molbev.a040171. [DOI] [PubMed] [Google Scholar]
- Watanabe M, et al. The rise and fall of the CR1 subfamily in the lineage leading to penguins. Gene. 2006;365:57–66. doi: 10.1016/j.gene.2005.09.042. [DOI] [PubMed] [Google Scholar]
- Wicker T, et al. The repetitive landscape of the chicken genome. Genome Res. 2005;15:126–136. doi: 10.1101/gr.2438005. [DOI] [PMC free article] [PubMed] [Google Scholar]
Associated Data
This section collects any data citations, data availability statements, or supplementary materials included in this article.


