

Abstract
Experimental evolution in rapidly reproducing viruses offers a robust means to infer substitution trajectories during evolution. But with conventional approaches, this inference is limited by how many individual genotypes can be sampled from the population at a time. Low-frequency changes are difficult to detect, potentially rendering early stages of adaptation unobservable. Here we circumvent this using short-read sequencing technology in a fine-grained analysis of polymorphism dynamics in the sentinel organism: a single-stranded DNA phage ΦX174. Nucleotide differences were educed from noise with binomial filtering methods that harnessed quality scores and separate data from brief phage amplifications. Remarkably, a significant degree of variation was observed in all samples including those grown in brief 2-h cultures. Sites previously reported as subject to high-frequency polymorphisms over a course of weeks exhibited monotonic increases in polymorphism frequency within hours in this study. Additionally, even with limitations imposed by the short length of sequencing reads, we were able to observe statistically significant linkage among polymorphic sites in evolved lineages. Additional parallels between replicate lineages were apparent in the sharing of polymorphic sites and in correlated polymorphism frequencies. Missense mutations were more likely to occur than silent mutations. This study offers the first glimpse into “real-time” substitution dynamics and offers a robust conceptual framework for future viral resequencing studies.
Keywords: experimental evolution, next-generation sequencing, substitution analysis
Introduction
An emerging and fruitful field of research uses microorganisms to test diverse aspects of evolutionary theory by experiment (Elena and Lenski 2003). Experimental methods offer a plethora of new insights because they enable direct observation of evolving populations under defined conditions rather than relying on the indirect inferences required in traditional, comparative evolutionary methods. Viruses offer several benefits as organisms for use in experimental evolution. These are chiefly conferred by their short generation times, ease of storage, and small genome sizes, which jointly permit the accurate observation of genetic changes occurring during a bout of adaptation or evolutionary change. Conventional dideoxy sequencing of isolates can be used with sufficiently small genomes to observe changes in the entire genome: A technique that has been used to enumerate the effects of host switching in the single-stranded (ss) DNA bacteriophage ΦX174 for example (Bull et al. 1997; Crill et al. 2000). But inferring detailed evolutionary trajectories of populations by sequencing isolates is time consuming, and low-frequency changes are difficult to detect with practical levels of sampling. Only when interesting genomic sites or regions are identified by full-genome sequencing can higher throughput methods be employed, such as oligonucleotide hybridization (Wichman et al. 1999; Crill et al. 2000) or partial sequencing (Poon and Chao 2005). However, these methods offer only minor sensitivity improvements at the expense of generality.
The technology of sequencing is subject to rapid and exciting change. So-called next-generation sequencing technologies (Roche/454, Illumina/Solexa, AB/SOLiD, Helicos/Heliscope) leverage highly parallel shotgun sequencing to deliver multiple short sequences from input DNA. These methods show great potential for microbiological research that go beyond mere improvements in the efficiency of sequencing novel genomes (MacLean et al. 2009). When reference genomes are available, next-generation sequencing can further be used to expedite the resequencing of even large eukaryotic genomes (e.g., Caenorhabditis elegans: Hillier et al. 2008; Pichia stipitis: Smith et al. 2008; and Homo sapiens: Bentley et al. 2008; Wang et al. 2008; and Wheeler et al. 2008). This is tantalizing because it suggests that population differences can be comprehensively explored at the genomic level. The fact that next-generation methods yield DNA sequences, before assembly, that represent individual DNA molecules has also been exploited for analysis of heterogeneous DNA samples. This metagenomic approach has been used to explore population and community diversity across a wide range of environments and species (e.g., Dinsdale et al. 2008; for review: Cardenas and Tiedje 2008). Clearly, population geneticists and ecologists will use these short-read sequencing applications to sharpen their empirical vision.
We believe that it is time to apply next-generation sequencing to experimental evolution. The practical and inferential limits imposed by sequencing relatively small numbers of isolates from an evolving population are overcome by parallel sequencing of many individual molecules in a mixed sample. Viruses remain an ideal choice because their small genome size permits massive sampling of each genome position from a single population aliquot, thereby more effectively evincing low-frequency changes. We have chosen to analyze ΦX174 due to the extant experimental evolution literature and methodology with this organism as well as its status as the first genome sequenced by the dideoxy method of Sanger et al. (1977, 1978). Previous studies using ΦX174 have explored parallel genetic changes in replicate populations (Bull et al. 1997; Wichman et al. 1999), including the closely related phage S13 (Wichman et al. 2000). Experimental methods have also been used in ΦX174 to address the occurrence of clonal interference under different conditions (Pepin and Wichman 2008) and the genetic basis of fitness effects induced by high temperature (Bull et al. 2000; Holder and Bull 2001), novel hosts (Pepin et al. 2008), or repeated host switching (Bull et al. 1997; Crill et al. 2000). Introduced mutations were shown to lead to pleiotropic effects on components of fitness (Pepin et al. 2006) and have been used to assess the rate of compensatory mutation (Poon and Chao 2005) and the nature and extent of epistasis (Pepin and Wichman 2007). The fitness of beneficial mutations fixed in a single step in ID11, a relative of ΦX174, has also been used to estimate the distribution of fitness effects available to selection (Rokyta et al. 2005; Rokyta et al. 2008). At the functional level, artificial selection of ΦX174 in the presence of complementing clones has been used to manipulate the necessity of gene B, which encodes the internal scaffolding protein (Chen et al. 2007).
We decided to explore the potential of short-read sequencing in this context, but, rather than focusing on a defined selection regimen or a specific theoretical question, we adapted the phage to its common laboratory host, Escherichia coli C, in a chemostat. A chemostat is a continuous culture system useful in evolutionary studies because it maintains a population of uninfected bacteria that continually supply naive hosts to an evolving population of phage (see Methods and Dykhuizen 1993). In principle, this approach reduces coadaptation between phage and host and should provide a highly competitive environment for phage adaptation (Bull et al. 2006). Our study shares the same ancestral phage sequence and similar propagation methods with a conventional sequencing study of ΦX174 that tracked changes occurring throughout its 180-day duration possibly caused by selection under within-host competition (Wichman et al. 2005), but we maintained a larger population in our study (see Methods) to increase population sampling of mutations. We prepared four ΦX174 samples from short-term flask cultures and sampled two replicate chemostat lines each at three time points over 32 h of continuous culture. Using Illumina sequencing to examine the entire ΦX174 genome in these samples at high density, we aimed to track high- and low-frequency changes in an environment known to elicit an evolutionary response.
Methods
Strains
Host bacteria, E. coli C, and ΦX174 bacteriophage (identical to sequence under GenBank accession number AF176034) were generously provided by Holly Wichman. All chemostats were seeded from the same glycerol stock of ΦX174 from a single sequence-verified plaque (by dideoxy sequencing; data not shown).
Chemostat
A chemostat comprising two 250 ml bottles immersed (above the internal fluid level) in a 37 °C water bath was used to select the phage. Luria–Bertani (LB) broth with calcium chloride (2–3 mM) and antifoam B (0.005%; J. T. Baker) was drawn into the first chamber from a 5-l storage bottle through a handblown glass drip counter, and waste was drawn from the second bottle into a 2-l conical flask. All vessels were connected with silicone (VWR) and Teflon (Nalgene) tubing and vented through ports (Chemglass) plugged with glass wool. Flow through the apparatus was maintained (at ∼1 drop/3 s) using a peristaltic pump (Heidolph) and an aquarium pump (Rolf C. Hagen Inc.) modified for suction, and growth chamber volumes were maintained at ∼25 ml with some fluctuation. Bottles and tubing (already connected) were autoclaved before each experiment, media and waste containers periodically and aseptically replaced, and all replacement vessels were autoclaved before use.
Adaptation Procedure
Two replicate experiments were successfully conducted yielding lineages B and C described in the manuscript. In each replicate, the first chamber of the chemostat was seeded through a port with 2 ml of E. coli C from an overnight LB culture. When these chambers were turbid (for B: ∼1 h 15 min, for C: ∼1 h 5 min), ΦX174 were pipetted into the second chamber from a 500 μl LB aliquot (in turn inoculated, by loop, from the glycerol stock). Aliquots (∼10–24 ml) were extracted from the inoculation port of the second chamber at 8-h intervals. To remove bacteria, aliquots were mixed with chloroform (∼10%), centrifuged (5 min at 5,000 RCF), and cleared supernatant was stored at 4 °C. At the end of the experiment, after the seventh sample was taken (56 h), two aliquots were extracted from the first chamber. One of these was prepared as described and was used to detect bacteriophage contamination (by titering with wild-type E. coli C), the other was not treated with chloroform but was used to test for bacterial resistance. Experiments with evidence of contamination were discontinued. Population densities were assessed from aliquots by titering and exceeded 109/ml throughout.
Time Point Zero Samples
Two replicate short-term experiments were undertaken to yield comparison samples. Two 50 ml LB cultures in 250 ml conical flasks (initiated from 2 ml overnight cultures and with calcium chloride at 2 mM) were brought to exponential growth (∼1 h) and inoculated with phage from the stock (directly by loop). Cultures were incubated for 2 h, and two (22 ml) aliquots were taken from each and prepared as described to remove bacteria (Adaptation Procedure). This gave a 2-by-2 design with two samples from each short-term amplification: A1, A2 and A3, A4, respectively.
DNA Preparation and Sequencing
Double-stranded (ds) DNA was prepared from ΦX174-containing aliquots by stalled in vivo replication with chloramphenicol (after Godson and Vapnek 1973). Adding this antibiotic to infected bacteria causes replicative form 1 dsDNA to accumulate forestalling the switch to rolling circle replication of ssDNA (Sinsheimer et al. 1962). For each sample from the chemostat or time point zero samples, a 100 ml E. coli C culture in LB (initiated from 2 ml overnight cultures) was brought to exponential growth (∼1.5 h), at which point calcium chloride was added (to 2 mM) followed by the prepared aliquot. Approximately 10 min later, chloramphenicol was added (to ∼30 μg/ml). After ∼3 h cultures were centrifuged (20 min at 5000 RCF), DNA was extracted by miniprep (Qiagen) from precipitates (sometimes after storage at −20 °C). For all samples except A4, DNA was further purified by gel electrophoresis (1% tris-acetate-ethylenediaminetetraacetic acid buffer) and extraction of the appropriate band (Qiagen; exposure to UV was minimized). Prepared time point zero samples and those from the first, third, and fourth chemostat time points (of B and C) were quantitated and sent to Prognosys Biosciences Inc. who fragmented and ligated adapters to the dsDNA preceding multiplex single-end Illumina sequencing. In Illumina sequencing, reversible terminators are ligated in a step-by-step manner to immobilized clusters of amplified DNA fragments (Bentley et al. 2008). All data is accessible from http://usegalaxy.org by clicking “Data Library” link.
Sequence Analysis
The complete procedure for mapping short reads and enumerating mismatches at each genome position is given in supplementary methods (Supplementary Material online), which includes an analysis of the error characteristics of these data. In brief, we mapped reads (in Fasta format) to the ancestral genome using LASTZ 1.01.50 (http://www.bx.psu.edu/miller_lab/), a drop-in replacement for BlastZ. We adjusted the algorithm to make better use of the full length of short reads, and parameters were set to favor mismatches over gaps. The circularity of the genome was accounted for by separate mappings with concatenated sequence either side of reference nucleotide #1. Postprocessing was performed with custom scripts (available on request) to integrate mapping results and assemble a table detailing mismatch data at each position.
Statistical Analysis
All statistics were carried out in R 2.8.1 (R Development Core Team 2008). All statistics were nonparametric, and permutation versions of Spearman's (“Polymorphism Frequencies Correlate among Lineages”) and Wilcoxon's (“Overabundance of Transversional and Missense Polymorphisms,” “Polymorphisms in Overlapping Regions Follow Genome-Wide Trend”) tests were implemented with the coin package (Hothorn et al. 2006). Probabilities for permuted tests were calculated by asymptotic inference. For analysis of monotonic trends (Polymorphism Frequencies Correlate among Lineages, Overabundance of Transversional and Missense Polymorphisms), we used the Jonckheere–Terpstra test implemented in the SAGx package (Broberg 2008). R scripts, which applied the core wilcox.test function to data ranked by alternate extremes, were written to perform Siegel–Tukey tests for equal variance.
Results and Discussion
Evolved Lines and Variation Mapping
Two groups of samples derived from a common ΦX174 ancestor were analyzed in this experiment (see Methods). In the first group, 2-h amplifications of the stock were carried out yielding four time point zero samples labeled A1 and A2 (from one amplification) and A3 and A4 (from the other). In the second group, phage was grown in two chemostats (B and C), and each was sampled at 8, 24, and 32 h (samples 1, 3, and 4, respectively) yielding six experimental samples (B1, B3, and B4 and C1, C3, and C4). In all samples, dsDNA was prepared from virions containing ssDNA by stalled in vivo replication (see Methods). Illumina reads were aligned against the ΦX174 ancestral genome using LASTZ 1.01.50 (supplementary methods, Supplementary Material online for parameters). Reads were discarded if they aligned incompletely to the reference or if more than six mismatches were present. With these parameters, 88.03% of 14,833,201 reads were mapped to the ΦX174 ancestral genome.
Data Filters
Our mapping procedure gave us data for each genome position (in each sample) specifying the numbers of deviant reads, those which differed (contained a mismatch) from the reference genome base at that position, and the coverage, the total number of reads mapping to that position. For each position, we summed the deviant reads and computed the deviant read proportion (by dividing the sum of deviant reads by the coverage; for example, if a genome position is spanned by 100 reads of which 10 contain mismatches, then the deviant read proportion will be 10/100 = 10%). Before correcting for background effects, which may be caused by machine error, the deviant read proportion constitutes a noisy estimate of polymorphism frequency. Given that base calls are assigned a range of Phred equivalent (FRED) quality scores (Ewing, Hillier, et al. 1998; Ewing and Green 1998), an initial filtering step was performed based on FRED score. We applied a simple but strict prefilter in which only bases with an FRED score of 40 (corresponding to 1 in 10,000 chance of miscall) were admitted into coverage or deviant read data. Next, we applied three filters to these FRED-filtered data that yielded three types of polymorphism data described in detail below: 1) highly polymorphic sites, 2) significantly polymorphic sites, and 3) significant polymorphisms.
In our first and simplest filter, we excluded from analysis all genome positions with a deviant read proportion less than the maximum observed proportion in time point zero samples (≈1.51%). Because this excludes all variation within the range of time point zero samples, this filter makes stringent use of these as controls. We refer to genome positions surviving this filter as highly polymorphic sites (fig. 1 for analytical schema). Our two other filters exploited the fact that an FRED score of 40 corresponds with an expected “probability” of producing a deviant base of 0.0001 to detect sites or mutations likely to be polymorphic. For these filters, we assumed that errors occurred in a one-time process and were independent across genome positions allowing us to use the binomial probability distribution.
FIG. 1.—

Analytical schema depicting filters employed (blue) and statistical analyses undertaken (green). All analyses were nonparametric. TP0: time point zero; DRP: deviant read proportion.
To detect significantly polymorphic sites, we assigned a probability to each genome position in each sample based on a binomial distribution with k = total number of deviant reads, n = coverage, and P = 0.0001. To detect significant polymorphisms, that is likely polymorphisms per se, we calculated probabilities with the same parameters, save that k = number of deviant reads supporting a particular base at a given position and P = 0.0001/3 because only one of three possible mutations was considered (fig. 1). Mutation probabilities thus derived were grouped into pairs of vectors according to types of polymorphism: transitions versus transversions or missense versus silent changes. Because different bases at a given genome position may support the same polymorphism (e.g., two types of mutation are transversions), some positions contributed multiply to some vectors. Because a given mutation may be silent in one reading frame but missense in another, it was also possible for a single mutation's probability to be shared within, as well as between, pairs of vectors.
For both binomial filtering strategies, probability vectors for each position or type of polymorphism across the genome, but within each sample (e.g., within B3), were modified to account for the expected false discovery rate (FDR). For significant polymorphisms, FDR probabilities were calculated across pairs of mutation types: across transitions and transversions or across missense and silent changes. Filtering for significantly polymorphic sites or significant polymorphisms consisted of rejecting all positions or mutations with an FDR > 0.05. Figure 2 shows the effect of applying a binomial filter on the distribution of per-site deviant read proportions in time point zero samples (fig. 2A) and in experimental samples (fig. 2B). That there are significantly polymorphic sites in time point zero samples suggests that amplification and/or dsDNA preparation provided sufficient time for polymorphisms to accumulate. Figure 3 maps observed deviant read proportions across all experimental samples to the ΦX174 genome in lineages B and C.
FIG. 2.—


Histograms showing the frequencies of genome positions with different deviant read proportions across time point zero samples (A) and experimental samples (B). Gray bars indicate frequencies from significantly polymorphic sites only, and blue bars or portions of bars indicate the additional numbers of positions removed by the binomial filter (see text). Figure 2 is continued on the following page.
FIG. 3.—

Circular histograms of deviant read proportions across the genome in lineages B and C. The height of each spoke represents deviant read proportions at each genome position from 0% (at the inner ring) to the threshold value (for highly polymorphic sites) of ∼1.51% (at the outer ring; for exact frequencies of highly polymorphic sites, see table 1). Colors represent time points with red = time point 1, green = time point 3, and blue = time point 4.
Missense Changes Dominate Highly Polymorphic Sites
Using our threshold-based filter, we identified 54 unique highly polymorphic sites across all experimental samples distributed across the ΦX174 genome but absent from gene K and intergenic regions (see outer rings in fig. 3). Table 1 shows all 54 sites, 48 of which show individual mutations exceeding the threshold deviant read proportion (≈1.51%) at one or more time points and two of which, 1639 and 2275 (throughout this manuscript we use 1-based coordinate system), show two and three mutations, respectively, that exceed this threshold. Each of the five above-threshold mutations at sites 1639 and 2275 lead to the same amino acid change (M → I; table 1).
Table 1.
Highly Polymorphic Sites Identified by the Maximum Deviation Filter
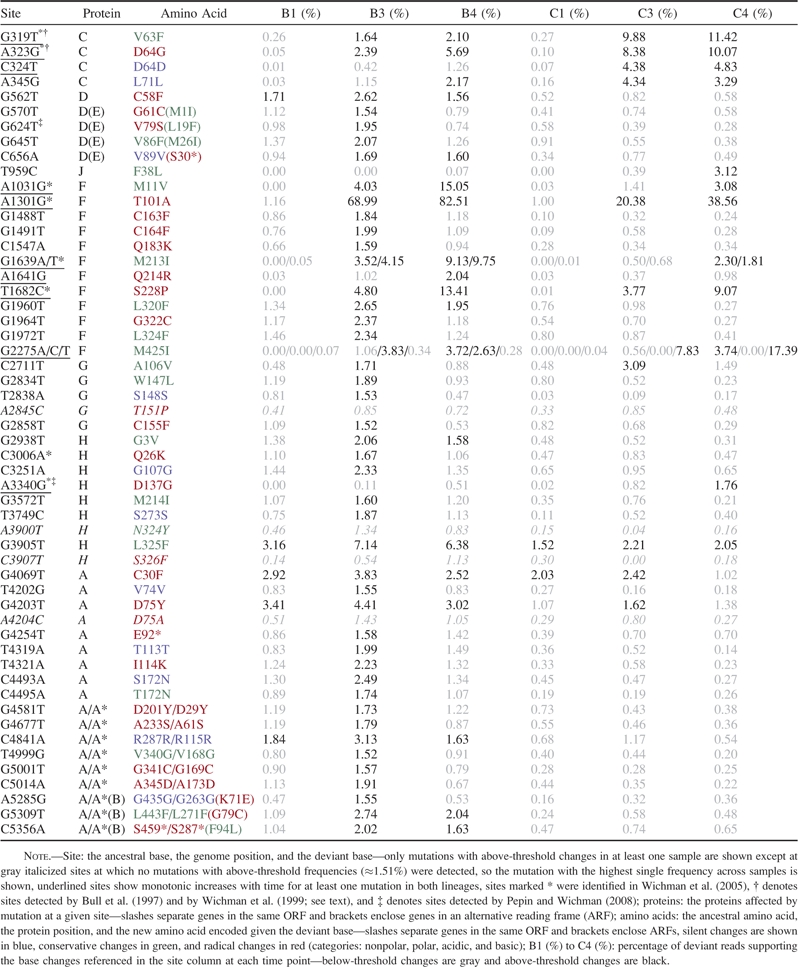 |
Of the 54 highly polymorphic sites, seven are located within overlapping reading frames (ORFs; expected number = 8.16; Fisher exact P > 0.10), three were identified with (above-threshold) nonsense mutations in one reading frame, and 44 with missense mutations. Just nine sites carry only silent mutations indicating a preponderance of changes with effects on polypeptide sequence.
Site-by-Site Patterns: Unexpected Level of Variation within 32 h
Among 54 highly polymorphic sites, 10 showed a monotonic increase in polymorphism frequency with time for above-threshold mutations in both lineages (underlined in table 1; both equivalent missense mutations at site 1639 are included). Eight of these sites (marked * in table 1) were also observed in a much longer 180-day chemostat study initiated with the same phage ancestor (Wichman et al. 2005) and sequenced at low density with dideoxy whole-genome sequencing. Specifically, changes at 1, 2, 2, 1, and 2 of these sites were observed at 10, 20, 40, 80, and 160 days, respectively, in their study, suggesting that we could observe these changes at a much earlier stage (although the volume of phage maintained in our experiment was more than 10 times greater and mutations may be arbitrarily ordered). All eight mutations at the sites shared between Wichman et al. (2005), and this study was the same except that a subsequent mutation at 1301 (to a T) did not exceed the threshold in this study and the two mutations that were coeval at site 1639 were sequential in Wichman et al. (2005).
Suggesting that a core group of changes were subject to selection, the results of our two searches were overlapping. Seven of the eight sites in our study that were shared with Wichman et al. (2005) were also subject to monotonic increases in both lineages in this study providing strong evidence for deterministic evolution (the exception is site 3006; table 1). Further, two of the intersecting changes (319 and 323) were also identified under different selective conditions (of high temperature and the same or a different host; Bull et al. 1997; Wichman et al. 1999: sites marked † in table 1; site 319 also detected by Crill et al. 2000).
Because two replicate lineages were analyzed (see Methods), we also sought evidence for selection by comparing polymorphic sites between these. Table 2 shows the number of highly polymorphic (table 2A) and significantly polymorphic (table 2B) sites shared between lineages at each time point and overall. Of the 54 highly polymorphic sites evinced by the threshold filter, five (3905, 562, 4203, 4069, and 4841) are found in all lineage B experimental samples and one (3905) in all lineage C samples. A high extent of parallelism was indicated by the 12 unique sites that were shared between lineages across time points (table 2A; continuity-corrected chi-squared test P < 0.0001 for each time point or for the union of all time points). Parallelism is also evident at the level of mutations within highly significant sites (table 1). For example, at position 3905, which is shared by all experimental samples, all but two deviant reads of 19098 total (across B1, B3, B4, C1, C3, and C4) support a change to the same deviant base (T) from the ancestral base (G; although 148 reads support deletions at this position). This striking level of parallelism is consistent with selection on this subset of highly polymorphic sites, but we also sought broader patterns across the larger set of significantly polymorphic sites identified with our binomial filtering approach (see Data Filters above).
Table 2.
Effect of Filter on Number of Sites in Each Sample with A) Threshold-Based and B) Binomial Filters
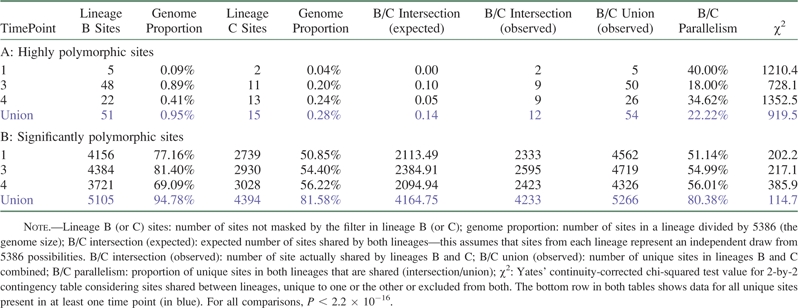 |
The fraction of the genome covered by significantly polymorphic sites approximately ranges from one-half to four-fifths (table 2B) with significantly fewer polymorphic sites in lineage C than in lineage B for unknown reasons (chi-squared test P < 0.0001 with site counts for each sample as observed frequencies). Again, and as with the highly polymorphic sites, we observed a significant degree of parallelism with around half the significantly polymorphic sites shared between lineages at each time point (table 2B; continuity corrected chi-squared test P < 0.0001 for each time point or for the union of all time points). This is congruent with previous ΦX174 studies in which about 50% of changes were shared between lineages (Bull et al. 1997; Wichman et al. 1999). However, significant parallelism is also present between time point zero samples (four-way chi-squared test P < 0.0001; data not shown) so that the effect of initial conditions (e.g., in the seeding plaque) cannot be excluded.
Although a complete replacement of the ancestral base (i.e., a substitution) occurred at no sites in our study, a dramatic (and monotonic) increase in polymorphism frequency was evident at position 1301 in both lineages (table 1), where an A-to-G substitution reaches a high frequency (∼83% and ∼39% in lineages B and C, respectively) in just 32 h as opposed by 10 days in the case of Wichman et al. (2005). The amino acid residue (gpF101) encoded by this site is located on the outer surface of the capsid (McKenna et al. 1994; they label as gpF100). A missense change at the same amino acid was identified during serial transfers on a mutant E. coli host lacking O antigens (Pepin et al. 2008; site 1302, they label as gpF100) and the adjacent residue (gpF102), also prominently placed on the capsid surface, is subject to rapid and reversible change in response to repeated host shifts (Crill et al. 2000; they label as gpF101). Because gpF102 influences the virus–host attachment rate (Crill et al. 2000), we speculate that gpF101 may also be subject to selection for improved attachment to the wild-type host or may be selected in response the emergence of adsorption-resistant clones of bacteria within the chemostat. We also note that the diversity of other high-frequency changes appears to be diminished in sample B4 (cf. B3) perhaps due to the particularly rapid rise in polymorphism frequency at site 1301 in this lineage between time points 3 and 4 (table 1). It should be noted, however, that relaxed selection may also be operating in samples B3 and B4 (with a nonsense mutation in the lysis protein, gpE30, at threshold-exceeding frequencies in these samples; table 1).
Polymorphism Frequencies Correlate among Lineages
Our analysis of significant sites potentially elides shared patterns of change because parallelism may be evident in polymorphism frequencies per se. We therefore tested whether site-by-site levels of polymorphism correlated between lineages at each time point. Figure 4 compares the distributions of polymorphism frequencies at each time point between lineages in highly polymorphic sites (fig. 4A; union of sites in both lineages at each time point) and in significantly polymorphic sites (fig. 4B; intersection of sites in both lineages at each time point). Likely due to the small number of highly polymorphic sites considered, a significant correlation between frequencies was only evident in time points 3 and 4 (fig. 4A; time point 1: P > 0.10, rho = 0.600; time point 3: P < 0.01, rho = 0.409; time point 4: P < 0.05, rho = 0.499; Spearman correlation). Considering significantly polymorphic sites, shared between lineages at each time point, significant correlations were detected at all time points (fig. 4B; time point 1: P < 0.0001, rho = 0.505; time point 3: P < 0.0001, rho = 0.503; time point 4: P < 0.0001, rho = 0.545; P < 0.0001 for all time points if union of sites at each time point considered). Robust correlations were also detected when all genome sites were considered without exclusion (data not shown; time point 1: P < 0.0001, rho = 0.431; time point 3: P < 0.0001, rho = 0.441; time point 4: P < 0.0001, rho = 0.473; Spearman correlations as above) suggesting a shared genome-wide pattern of change in our experiment. However, significant correlations were also detected between the polymorphism frequencies from the two time point zero amplifications (Spearman's P < 0.0001 for all sites and for intersection or union of significantly polymorphic sites when per-site averages of A1 and A2 deviant proportions contrasted with A3/A4 averages) suggesting again that initial conditions may play a role or that shared patterns of divergence emerge early in the experiment.
FIG. 4.—

Scatterplots showing the deviant read proportions of polymorphic sites in both lineages at given time points. (A) Highly polymorphic sites detected in one or the other or both samples are shown; (B): significantly polymorphic sites detected only in both samples are shown.
Despite the degree of parallelism between significantly polymorphic sites, no overall trend toward monotonic increases in polymorphism frequency was detected in this group or across all genome sites (Jonckheere–Terpstra P > 0.10 for all tests cf. P < 0.0001 for highly polymorphic sites) although increases in variance with time were noted between nearly all adjacent pairs of time points in each lineage for all sites and for the intersection or union of significantly polymorphic sites (Siegel–Tukey P < 0.0001 for all comparisons except C3 vs. C4 where P < 0.01 for all sites, P < 0.05 for union, and P > 0.10 for intersection of significantly polymorphic sites). Therefore, although general patterns of change were shared between lineages at each time point, only a subset of sites were subject to concerted changes in polymorphism frequency over time.
Linkage from Short Reads: Attraction, Repulsion, and Transitivity
Because neutral or deleterious alleles can hitchhike with strongly beneficial changes, identifying linked changes is an important step in individuating the causes of allele frequency increase among different genome sites that complements the analysis of parallel changes. Although the foregoing analyses illustrate the potential of Illumina sequencing for detecting genome-wide trends in polymorphism, the short-read length involved (36 bp) limits the potential for linkage detection. Linkage is only detectable between closely positioned sites (or it may be weakly inferred between a pair of sites if intermediate sites are linked). Nevertheless, we identified 33 pairs of highly polymorphic sites within a read length (36 bp) of one another and undertook a linkage survey of changes at these positions. Table 3 shows summary data for this analysis (for complete analysis with the proportion of overlapping reads supporting mutations at one or the other or both sites, see supplementary table 1, Supplementary Material online).
Table 3.
Summary of Linkage Analysis
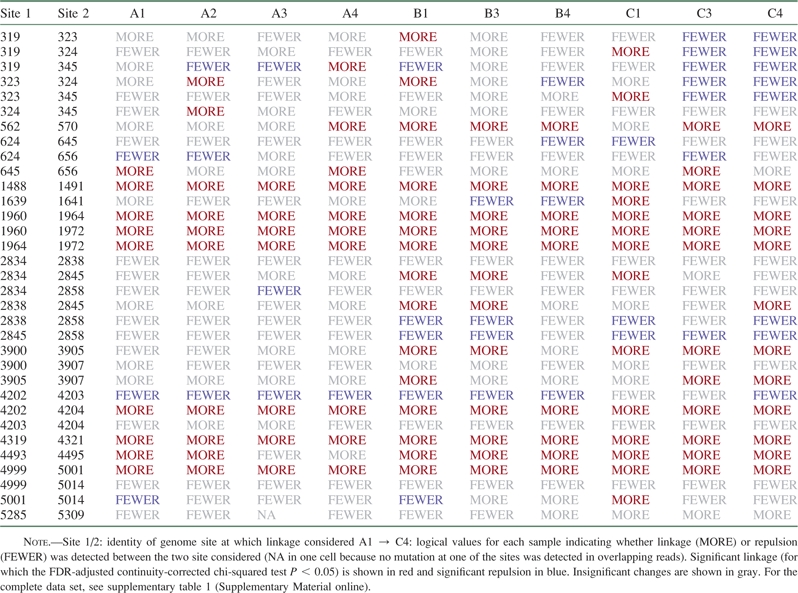 |
For some groups of sites, this analysis seems to confirm the presence of hitchhiking effects. For example, 4319, dominated by a silent mutation, and 4321, by a radical amino acid change (in an adjacent codon), seem to be linked (table 3), suggesting that 4319 may only be present at high frequency due to linkage with 4321. However, this analysis also revealed significant linkage between seven pairs of highly polymorphic sites in all samples (FDR-adjusted continuity-corrected chi-squared test P < 0.05 for every sample), and several other pairs showed strong evidence for linkage in experimental samples (e.g., 562 and 570 or 4493 and 4495; table 3). Insofar as mutations occur at random, this observation is surprising because of the low probability that linkage patterns would be independently acquired in separate lineages. Two explanations are possible: 1) these mutations were already present at low frequency within the phage stock used to initiate all samples and/or 2) these patterns of linkage disequilibrium are explained by positive epistatic interactions between sites.
Perhaps due to the relatively low levels of polymorphism typically detected in our study, significant “repulsion” between sites (indicative of clonally derived amplifications) was less easily educed in this analysis although several pairs of sites showed trends toward repulsion in all samples (table 3).
When more than two sites are within a read length of each other, it is possible to identify discrete linkage groups and thereby parse alleles. For example, sites 1960, 1964, and 1972 appear to be linked to each other in all samples tested. On the other hand, sites 4202 and 4204 appear to be in linkage with each other, whereas both sites are in repulsion with mutations at 4203, suggesting that former two sites arose in one clone and the latter one site in another. Patterns are not always this perspicuous, however. Among sites 2834, 2838, 2845, and 2858, a complex, nontransitive pattern is observed in which site 2845 appears to be linked to 2834 at time points 1 and 3 even though site 2838, which is linked to 2845 in most samples, appears to be in repulsion with site 2834 across all samples.
Overabundance of Transversional and Missense Polymorphisms
To further characterize the patterns of change observed over our experiment, we filtered mutations by polymorphism type (see fig. 1 and Data Filters). First we turn to a comparison of polymorphism types.
Using the number of possible mutations of each type that could occur across the genome, we calculated the proportion of polymorphisms of each type that were deemed significant by our method (table 4). By this measure, the “probability” that transitions (Ti) occurred was significantly lower than that for transversions (Tv) at each time point and in each sample (P < 0.0001 for all comparisons; chi-squared tests against expected proportions) although in time point zero samples, transitions were more likely to be detected by the filter (table 4). On the other hand, missense mutations (NS) were more likely to occur than silent mutations (S) in all experimental samples (P < 0.0001 for all comparisons), but a 1:1 ratio could not be discounted in most time point zero samples (sample A1: P > 0.10; sample A2: P > 0.10; sample A3: P < 0.10; sample A4: P < 0.01; table 4).
Table 4.
Proportions of Mutations Identified as Significantly Polymorphic by Binomial Filter
| Sample | Percentage Significant Transitions | Percentage Significant Transversions | Ti/Tv Ratio | Percentage Significant Missense | Percentage Significant Silent | NS/S Ratio |
| A1 | 34.74 | 46.74 | 0.743**** | 43.56 | 42.20 | 1.032 |
| A2 | 36.63 | 47.73 | 0.767**** | 45.05 | 43.29 | 1.041 |
| A3 | 32.10 | 39.77 | 0.807**** | 38.48 | 36.39 | 1.057• |
| A4 | 34.18 | 45.27 | 0.755**** | 42.64 | 39.55 | 1.078** |
| B1 | 7.87 | 37.73 | 0.209**** | 29.07 | 23.17 | 1.255**** |
| B3 | 10.75 | 43.72 | 0.246**** | 34.31 | 27.85 | 1.232**** |
| B4 | 9.39 | 32.91 | 0.285**** | 26.8 | 19.70 | 1.362**** |
| C1 | 5.07 | 20.16 | 0.251**** | 16.18 | 12.10 | 1.337**** |
| C3 | 5.83 | 24.21 | 0.241**** | 19.49 | 13.74 | 1.419**** |
| C4 | 7.87 | 25.97 | 0.303**** | 21.18 | 16.51 | 1.283**** |
NOTE.—Sample: sample identity; percentage significant transitions/transversions/missense/silent: percentage of mutations of the indicated type identified as significant by the binomial filter, that is, the probability of significant change; Ti/Tv ratio: probability ratio of transitions to transversions; NS/S ratio: ratio for missense to silent changes. Significance probabilities indicated by: •P < 0.10, **P < 0.01, ****P < 0.0001.
Considering the deviant read proportions or frequencies associated with each polymorphism type, we see comparable trends among significant polymorphisms. Transitions show significantly lower frequencies than transversions at all time points (time point 0: P < 0.0001, median Ti frequency = 0.0471%, median Tv frequency = 0.0629%; time point 1: P < 0.0001, median Ti frequency = 0.0541%, median Tv frequency = 0.0749%; time point 3: P < 0.0001, median Ti frequency = 0.0537%, median Tv frequency = 0.0798%; and time point 4: P < 0.0001, median Ti frequency = 0.0529%, median Tv frequency = 0.0744%; Mann–Whitney tests stratified by lineage). Turning to significant missense and silent polymorphisms, missense changes are significantly more polymorphic at all time points (time point 0: P < 0.0001, median NS frequency = 0.0584%, median S frequency = 0.0543%; time point 1: P < 0.001, median NS frequency = 0.0733%, median S frequency = 0.0692%; time point 3: P < 0.0001, median NS frequency = 0.0776%, median S frequency = 0.0714%; and time point 4: P < 0.0001, median NS frequency = 0.0722%, median S frequency = 0.0640%).
Although these data suggest an effect of selection, a cautious interpretation is advisable because mutation bias can inflate the expected ratio of missense to silent substitutions in this system (Wichman et al. 2005) and because time point zero data exhibited similar trends to experimental samples. We therefore looked for changing patterns in polymorphism frequencies over time. Figure 5 shows changes in ranked polymorphism frequencies for transitions and transversions (fig. 5A) or for missense and silent changes (fig. 5B) across all experimental samples. A nonmonotonic pattern of change is evident and trend tests failed to confirm a significant increase in median frequencies over time in any polymorphism class (P > 0.10 for all comparisons: Jonckheere–Terpstra test; transitions, transversions, missense, and silent changes: 2520, 19,896, 18,472, and 4568 observations, respectively). The failure to detect a significant trend over time may reflect the small number of time points sampled. Alternatively, the incipient missense substitution occurring at site 1301 (see table 1 and Site-by-Site Patterns: Unexpected Level of Variation within 32 h) might be expected to have caused a decrease in diversity at nonlinked sites.
FIG. 5.—

Box and whisker plots showing ranked deviant read proportions associated with different classes of polymorphism in each experimental sample. (A) Transitions and transversions contrasted; (B): missense and silent mutations contrasted. Ranking is carried out within each polymorphism class but between samples.
Polymorphisms in Overlapping Regions Follow Genome-Wide Trend
Several genes in the ΦX174 genome overlap with one another producing alternative reading frames. The two largest overlaps are between gene A (encoding the replication protein) and gene B (internal scaffolding protein) and between gene D (external scaffolding protein) and gene E (lysis protein; for genic arrangement, see fig. 3). Pavesi (2006) analyzed substitution biases in members of the Microviridae (including ΦX174) and found asymmetrical changes in these overlapping regions with excess missense changes in the nested genes (B and E) and silent changes dominating in overlapping and nonoverlapping portions of their containing genes (A and D), which is in line with previous observations in bacteria (Rogozin et al. 2002) and eukaryotes (Szklarczyk et al. 2007). This shows that despite the constraints imposed by ORFs, signatures of differential selection can be identified in overlapping regions although selection pressures are likely to differ between long- and short-time scales and between natural and novel (chemostat) environments.
We sought evidence for distinct intraregional patterns of selection by comparing missense and silent polymorphisms in the following regions: gene A nonoverlapping (positions 3984–5074), genes A and B overlapping (5078–48), gene D nonoverlapping (394–567, 844–845), and genes D and E overlapping (571–840; all regions exclude start and stop codons and overlap with gene K is excluded in the A/B region). To detect significant polymorphisms, we made FDR adjustments across missense and silent mutations (as above) but considering only mutations within the specified region and reading frame. For comparisons between polymorphisms, data from both lineages were aggregated to increase power.
The genome-wide excess of missense over silent changes (see Overabundance of Transversional and Missense Polymorphisms) is replicated in the nonoverlapping regions of genes A and D. This trend is evident in the increased detection probability associated with missense changes (table 5), and it is also apparent, to a lesser degree, in observed polymorphism frequencies (gene A nonoverlapping: time points 1, 3, and 4: P < 0.05, P < 0.0001, and P < 0.001; gene D nonoverlapping: time points 1, 3, and 4: P < 0.05, P > 0.10, and P > 0.10) although the pattern for gene D region is weaker likely due to its smaller size (176 nt vs. 1091 for A nonoverlapping).
Table 5.
Region-Specific Analysis of Significant Proportions of Missense and Silent Changes
| Region |
Overlapping |
Nonoverlapping |
|||||
| Gene | Time Point | Percentage Significant Missense | Percentage Significant Silent | NS/S Ratio | Percentage Significant Missense | Percentage Significant Silent | NS/S Ratio |
| A | 1 | 21.11 | 16.12 | 1.310* | 23.94 | 18.48 | 1.295*** |
| 3 | 24.25 | 19.01 | 1.276* | 29.07 | 22.28 | 1.305**** | |
| 4 | 21.41 | 15.50 | 1.382* | 26.21 | 19.63 | 1.336**** | |
| B | 1 | 20.39 | 18.44 | 1.105 | — | — | — |
| 3 | 23.76 | 20.44 | 1.162 | — | — | — | |
| 4 | 21.10 | 16.22 | 1.301* | — | — | — | |
| D | 1 | 21.54 | 21.28 | 1.012 | 21.06 | 16.39 | 1.285 |
| 3 | 26.42 | 26.41 | 1.000 | 24.38 | 16.80 | 1.451* | |
| 4 | 23.90 | 24.10 | 0.992 | 21.31 | 14.34 | 1.485 | |
| E | 1 | 23.62 | 14.80 | 1.596** | — | — | — |
| 3 | 28.50 | 19.90 | 1.432** | — | — | — | |
| 4 | 25.16 | 20.15 | 1.249• | — | — | — | |
NOTE.—Gene: reading frame analyzed; time point: time points analyzed (lineages merged); region(overlapping/nonoverlapping): region of gene analyzed (for exact specification, see text); percentage significant missense/silent: percentage of mutations of indicated type identified as significant by the binomial filter, that is, probability of significant change; NS/S ratio: ratio for missense to silent changes. Significance probabilities indicated by •P < 0.10, *P < 0.05, **P < 0.01, ***P < 0.001, ****P < 0.0001.
Within the gene A/B overlap, the excess likelihood of missense mutations is also visible within both reading frames (table 5). Again, however, these trends are weak and missense polymorphisms are not associated with excess frequencies (gene A overlapping: time points 1, 3, and 4: P > 0.10, P < 0.10 for S > NS, and P > 0.10; gene B overlapping: time points 1, 3, and 4: P > 0.10, P > 0.10, and P > 0.10). Although this may relate to increased constraint on sequence change in this overlapping region, its small size (357 nt) precludes firm conclusions.
Within the gene D/E overlap, a more interesting pattern is evident. Despite the small size of the analyzed region (270 nt), missense changes are more likely to be detected in the E reading frame than silent changes (at least significantly at time points 1 and 3; table 5), whereas parity of changes seems the rule within the D reading frame (table 5). Although this tantalizingly suggests that lysis functions (encoded by gene E) may be subject to positive selection—a trend we might expect given the high phage population density—no trend at all is evident in the frequencies of significant polymorphisms (gene D overlapping: time points 1, 3, and 4: P > 0.10, P > 0.10, and P > 0.10; gene E overlapping: time points 1, 3, and 4: P > 0.10, P > 0.10, and P > 0.10), and this is not consistent with a high-frequency nonsense mutation in E (see “Site-by-Site Patterns: Unexpected Level of Variation within 32 h”).
Collectively, these data suggest that overlapping regions of the genome may be subject to variant selective forces, but, perhaps due to the complexity of the selective environment, no clear pattern can be discerned. We look forward to future experiments that make use of specific selective regimens while employing the short-read sequencing methodology developed here.
Mutational Flicker
We designed this study aiming to view mutations (nearly) directly as they occur. The extremely high coverage provided by the combination of the high output of the Illumina GAII instrument and the compactness of the ΦX174 genome seemingly allowed us to detect very low-frequency variants. Yet very early in this study, it became apparent that, although Illumina-type sequencing is a relatively established technology (compared with, say, AB SOLiD or Helicos technologies), the short reads it produces are stochastic (e.g., there is a wide variation in the sequencing coverage that is highly correlated between samples: supplementary fig. 1, Supplementary Material online), and the nature of sequencing artifacts and detection biases is not completely understood (this statement should not be viewed as the criticism of Illumina platform; it applies equally to all next-generation sequencing technologies including commercially available Roche/454 and AB/SOLiD platforms; Harismendy et al. 2009). These issues underline the need for quantitative differentiation between true substitutions and potential artifacts. In attempting to address this need, we designed filtering approaches that produced vastly different sets of polymorphic sites ranging from very conservative (highly polymorphic sites) to relatively inclusive (significantly polymorphic sites). A striking observation was the extent of variation within time point zero samples (A1 through A4) that implied a high degree of background variation or mutational flicker, within this clonally reproducing population (see fig. 2A). Although additional studies, with a variety of platforms, are needed to carefully dissect the machine noise component from the mutational flicker, it is clear that the extent of such background variation is greater than was previously thought. Also notable was the rate with which substitutions detected in classical studies by Wichman and colleagues gain frequency in this experiment: A replacement previously detected within 10 days goes almost to fixation in just 32 h. In addition, we were able to detect selection by comparisons between replicate lineages, infer patterns of linkage between closely apposed polymorphic sites, and tentatively identify region-specific signatures of functional constraint.
Funding
Beckman Young Investigators Award (Arnold and Mabel Beckman Foundation); The Pennsylvania State University.
Supplementary Material
Supplementary methods, table 1, and figure 1 are available at Genome Biology and Evolution online (http://www.oxfordjournals.org/our_journals/gbe/).
Supplementary Material
Acknowledgments
We would like to thank Holly Wichman and Jack Millstein for advice as well as for phage and bacterial stocks and for chemostat schema. Bob Harris for mapping algorithm (LASTZ) and calibration thereof. Siobain Duffy for reading the manuscript. Francesca Chiaromonte for analytical advice. Wen Yu Chung for counting plaques on one set of plates. Guruprasad Ananda for analysis of proportion of reads mapped.
References
- Bentley DR, et al. Accurate whole human genome sequencing using reversible terminator chemistry. Nature. 2008;456(7218):53–59. doi: 10.1038/nature07517. [DOI] [PMC free article] [PubMed] [Google Scholar]
- Broberg P. 2008. SAGx: statistical Analysis of the GeneChip. R package version 1.16.0. http://bioconductor.org/packages/release/bioc/html/SAGx.html. [Google Scholar]
- Bull JJ, et al. Exceptional convergent evolution in a virus. Genetics. 1997;147(4):1497–1507. doi: 10.1093/genetics/147.4.1497. [DOI] [PMC free article] [PubMed] [Google Scholar]
- Bull JJ, Badgett MR, Wichman HA. Big-benefit mutations in a bacteriophage inhibited with heat. Mol Biol Evol. 2000;17(6):942–950. doi: 10.1093/oxfordjournals.molbev.a026375. [DOI] [PubMed] [Google Scholar]
- Bull JJ, Millstein J, Orcutt J, Wichman HA. Evolutionary feedback mediated through population density, illustrated with viruses in chemostats. Am Nat. 2006;167(2):E39–E51. doi: 10.1086/499374. [DOI] [PubMed] [Google Scholar]
- Cardenas E, Tiedje JM. New tools for discovering and characterizing microbial diversity. Curr Opin Biotechnol. 2008;19(6):544–549. doi: 10.1016/j.copbio.2008.10.010. [DOI] [PubMed] [Google Scholar]
- Chen M, Uchiyama A, Fane BA. Eliminating the requirement of an essential gene product in an already very small virus: scaffolding protein B-free oX174, B-free. J Mol Biol. 2007;373(2):308–314. doi: 10.1016/j.jmb.2007.07.064. [DOI] [PubMed] [Google Scholar]
- Crill WD, Wichman HA, Bull JJ. Evolutionary reversals during viral adaptation to alternating hosts. Genetics. 2000;154(1):27–37. doi: 10.1093/genetics/154.1.27. [DOI] [PMC free article] [PubMed] [Google Scholar]
- Dinsdale EA, et al. Functional metagenomic profiling of nine biomes. Nature. 2008;452(7187):629–632. doi: 10.1038/nature06810. [DOI] [PubMed] [Google Scholar]
- Dykhuizen DE. Chemostats used for studying natural selection and adaptive evolution. Methods Enzymol. 1993;224:613. doi: 10.1016/0076-6879(93)24046-w. [DOI] [PubMed] [Google Scholar]
- Elena SF, Lenski RE. Evolution experiments with microorganisms: the dynamics and genetic bases of adaptation. Nat Rev Genet. 2003;4(6):457–469. doi: 10.1038/nrg1088. [DOI] [PubMed] [Google Scholar]
- Ewing B, Hillier L, Wendl MC, Green P. Base-calling of automated sequencer traces using phred. I. Accuracy assessment. Genome Res. 1998;8(3):175–185. doi: 10.1101/gr.8.3.175. [DOI] [PubMed] [Google Scholar]
- Ewing B, Green P. Base-calling of automated sequencer traces using phred. II. Error probabilities. Genome Res. 1998;8(3):186–194. [PubMed] [Google Scholar]
- Godson GN, Vapnek D. A simple method of preparing large amounts of phiX174 RF 1 supercoiled DNA. Biochim Biophys Acta. 1973;299(4):516–520. doi: 10.1016/0005-2787(73)90223-2. [DOI] [PubMed] [Google Scholar]
- Harismendy O, et al. Evaluation of next generation sequencing platforms for population targeted sequencing studies. Genome Biol. 2009;10(3):R32. doi: 10.1186/gb-2009-10-3-r32. [DOI] [PMC free article] [PubMed] [Google Scholar]
- Hillier LW, et al. Whole-genome sequencing and variant discovery in C. elegans. Nat Methods. 2008;5(2):183–188. doi: 10.1038/nmeth.1179. [DOI] [PubMed] [Google Scholar]
- Holder KK, Bull JJ. Profiles of adaptation in two similar viruses. Genetics. 2001;159(4):1393–1404. doi: 10.1093/genetics/159.4.1393. [DOI] [PMC free article] [PubMed] [Google Scholar]
- Hothorn T, Hornik K, van de Wiel MA, Zeileis A. A lego system for conditional inference. Am Stat. 2006;60(3):257–263. [Google Scholar]
- MacLean D, Jones JD, Studholme DJ. Application of ‘next-generation’ sequencing technologies to microbial genetics. Nat Rev Microbiol. 2009;7(4):287–296. doi: 10.1038/nrmicro2122. [DOI] [PubMed] [Google Scholar]
- McKenna R, Ilag LL, Rossmann MG. Analysis of the single-stranded DNA bacteriophage phi X174, refined at a resolution of 3.0 A. J Mol Biol. 1994;237(5):517–543. doi: 10.1006/jmbi.1994.1253. [DOI] [PubMed] [Google Scholar]
- Pavesi A. Origin and evolution of overlapping genes in the family Microviridae. J Gen Virol. 2006;87(4):1013–1017. doi: 10.1099/vir.0.81375-0. [DOI] [PubMed] [Google Scholar]
- Pepin KM, Samuel MA, Wichman HA. Variable pleiotropic effects from mutations at the same locus hamper prediction of fitness from a fitness component. Genetics. 2006;172(4):2047–2056. doi: 10.1534/genetics.105.049817. [DOI] [PMC free article] [PubMed] [Google Scholar]
- Pepin KM, Domsic J, McKenna R. Genomic evolution in a virus under specific selection for host recognition. Infect Genet Evol. 2008;8(6):825–834. doi: 10.1016/j.meegid.2008.08.008. [DOI] [PubMed] [Google Scholar]
- Pepin KM, Wichman HA. Variable epistatic effects between mutations at host recognition sites in phiX174 bacteriophage. Evolution. 2007;61(7):1710–1724. doi: 10.1111/j.1558-5646.2007.00143.x. [DOI] [PubMed] [Google Scholar]
- Pepin KM, Wichman HA. Experimental evolution and genome sequencing reveal variation in levels of clonal interference in large populations of bacteriophage phiX174. BMC Evol Biol. 2008;8:85. doi: 10.1186/1471-2148-8-85. [DOI] [PMC free article] [PubMed] [Google Scholar]
- Poon A, Chao L. The rate of compensatory mutation in the DNA bacteriophage phiX174. Genetics. 2005;170(3):989–999. doi: 10.1534/genetics.104.039438. [DOI] [PMC free article] [PubMed] [Google Scholar]
- R Development Core Team. R: A language and environment for statistical computing. Vienna (Austria): R Foundation for Statistical Computing; 2008. ISBN 3-900051-07-0. http://www.R-project.org. [Google Scholar]
- Rokyta DR, Joyce P, Caudle SB, Wichman HA. An empirical test of the mutational landscape model of adaptation using a single-stranded DNA virus. Nat Genet. 2005;37(4):441–444. doi: 10.1038/ng1535. [DOI] [PubMed] [Google Scholar]
- Rokyta DR, et al. Beneficial fitness effects are not exponential for two viruses. J Mol Evol. 2008;67(4):368–376. doi: 10.1007/s00239-008-9153-x. [DOI] [PMC free article] [PubMed] [Google Scholar]
- Rogozin IB, et al. Purifying and directional selection in overlapping prokaryotic genes. Trends Genet. 2002;18(5):228–232. doi: 10.1016/s0168-9525(02)02649-5. [DOI] [PubMed] [Google Scholar]
- Sanger F, et al. Nucleotide sequence of bacteriophage phi X174 DNA. Nature. 1977;265(5596):687–695. doi: 10.1038/265687a0. [DOI] [PubMed] [Google Scholar]
- Sanger F, et al. The nucleotide sequence of bacteriophage phiX174. J Mol Biol. 1978;125(2):225–246. doi: 10.1016/0022-2836(78)90346-7. [DOI] [PubMed] [Google Scholar]
- Sinsheimer RL, Starman B, Nagler C, Guthrie S. The process of infection with bacteriophage phi-XI74. I. Evidence for a “replicative form”. J Mol Biol. 1962;4:142–160. doi: 10.1016/s0022-2836(62)80047-3. [DOI] [PubMed] [Google Scholar]
- Smith DR, et al. Rapid whole-genome mutational profiling using next-generation sequencing technologies. Genome Res. 2008;18(10):1638–1642. doi: 10.1101/gr.077776.108. [DOI] [PMC free article] [PubMed] [Google Scholar]
- Szklarczyk R, Heringa J, Pond SK, Nekrutenko A. Rapid asymmetric evolution of a dual-coding tumor suppressor INK4a/ARF locus contradicts its function. Proc Natl Acad Sci USA. 2007;104(31):12807–12812. doi: 10.1073/pnas.0703238104. [DOI] [PMC free article] [PubMed] [Google Scholar]
- Wang J, et al. The diploid genome sequence of an Asian individual. Nature. 2008;456(7218):60–65. doi: 10.1038/nature07484. [DOI] [PMC free article] [PubMed] [Google Scholar]
- Wheeler DA, et al. The complete genome of an individual by massively parallel DNA sequencing. Nature. 2008;452(7189):872–876. doi: 10.1038/nature06884. [DOI] [PubMed] [Google Scholar]
- Wichman HA, Badgett MR, Scott LA, Boulianne CM, Bull JJ. Different trajectories of parallel evolution during viral adaptation. Science. 1999;285(5426):422–424. doi: 10.1126/science.285.5426.422. [DOI] [PubMed] [Google Scholar]
- Wichman HA, Scott LA, Yarber CD, Bull JJ. Experimental evolution recapitulates natural evolution. Philoso Trans R Soc B Biol Sci. 2000;355(1403):1677–1684. doi: 10.1098/rstb.2000.0731. [DOI] [PMC free article] [PubMed] [Google Scholar]
- Wichman HA, Millstein J, Bull JJ. Adaptive molecular evolution for 13,000 phage generations: a possible arms race. Genetics. 2005;170(1):19–31. doi: 10.1534/genetics.104.034488. [DOI] [PMC free article] [PubMed] [Google Scholar]
Associated Data
This section collects any data citations, data availability statements, or supplementary materials included in this article.