


Abstract
GeMMA (Genome Modelling and Model Annotation) is a new approach to automatic functional subfamily classification within families and superfamilies of protein sequences. A major advantage of GeMMA is its ability to subclassify very large and diverse superfamilies with tens of thousands of members, without the need for an initial multiple sequence alignment. Its performance is shown to be comparable to the established high-performance method SCI-PHY. GeMMA follows an agglomerative clustering protocol that uses existing software for sensitive and accurate multiple sequence alignment and profile–profile comparison. The produced subfamilies are shown to be equivalent in quality whether whole protein sequences are used or just the sequences of component predicted structural domains. A faster, heuristic version of GeMMA that also uses distributed computing is shown to maintain the performance levels of the original implementation. The use of GeMMA to increase the functional annotation coverage of functionally diverse Pfam families is demonstrated. It is further shown how GeMMA clusters can help to predict the impact of experimentally determining a protein domain structure on comparative protein modelling coverage, in the context of structural genomics.
INTRODUCTION
Clustering proteins according to function would be much easier if all proteins were fully functionally annotated. A biologically meaningful clustering might then group together all proteins with the same function that could be shown to be homologous to each other. The vast majority of proteins in a genome, however, do not have the highest quality experimentally characterized and traceable author statement annotations (1). Computational methods exist for protein function prediction but many proteins still lack even an inferred functional annotation and many of the annotations that are available are not very specific. Furthermore, estimates of the error rate for the annotation of complete genomes vary from <5 to >40% depending on the types of function (2,3).
Gene3D (4), derived from the CATH classification of protein structure (5), and Superfamily (6), derived from the SCOP classification of protein structure (7), contain predicted protein domain sequences assigned to structural domain superfamilies. These superfamilies can show homology beyond the sensitivity of sequence comparison methods. A very general functional annotation is assigned to each superfamily; however, the domain sequences that they contain are not divided into more specific functional subfamilies. If they were, much greater insights might be gained into the nature and evolution of protein function. Potential applications of this subfamily classification could be in protein molecular function prediction, identification and characterization of protein active sites, provision of sequence alignments for homology modelling in the twilight zone, and phylogenetic profiling. In addition, structural genomics targets could be selected to improve the structural coverage of protein function (8,9).
There has been much progress in the last few years in the development of computational methods for protein function prediction. The main approach relies on the fundamental notion of inheriting functional annotations from a sequence homologue. However, it is difficult to establish what the necessary level of similarity is, and very similar sequences or even clear homologues are often not available. There are three main types of methods that attempt to overcome these difficulties and that are appropriate to function prediction within superfamilies: phylogenomics; pattern recognition; and clustering, all of which have been reviewed recently (10).
Phylogenomics (11) uses the evolutionary relationships within a family of proteins to improve the accuracy of functional annotation transfer. All identifiable homologues of a query sequence are aligned, a phylogenetic tree is built and all bifurcations are marked, by reference to a taxonomic tree, as duplication events giving rise to paralogues or speciation events giving rise to orthologues (reconciliation). Orthologues generally retain the same molecular function, while paralogues are often free to evolve new functions. SIFTER (12) is a method designed to inherit GO annotations from orthologues and inparalogues within a Pfam (13) domain family. Inparalogues are paralogues within the same genome that arose from a gene duplication event after speciation. These tend to be more functionally similar than outparalogues that arose from a gene duplication event in an ancestral species.
Pattern recognition methods classify proteins using locally conserved sequence patterns. This contrasts with phylogenomics, which typically uses whole protein sequences. The classic patterns used are PROSITE motifs (14), typically just a few amino acids long and stored in the form of regular expressions. PRINTS (15) uses discontinuous profiles referred to as ‘fingerprints’ that are similar to a number of PROSITE patterns spread out along a protein sequence. Most resources developed today, however, use profiles that represent protein functional domains. ProDom (16) uses profiles in the form of PSI-BLAST position-specific scoring matrices (PSSMs), while Pfam (13), SMART (17), PANTHER (18), PIRSF (19) and TIGRFAMs (20) use hidden Markov models (HMMs).
Pfam is a comprehensive collection of protein families that is, amongst many other applications, extensively used in structural genomics. However, as is common with many functional family resources, these are generally families of paralogues and show some diversification of function. Some approaches have been developed to address the subdivision of protein functional families into functional subfamilies. Funshift (21), for example, is an automatic entropy-based approach that uses Rate Shifting Sites and Conservation Shifting Sites to subdivide Pfam families into subfamilies whose functions are likely to have shifted away from those of other subfamilies. PANTHER on the other hand relies on expert curation to divide families into subfamilies, which requires broad expertise and is time consuming.
Clustering can be used to group together sequences based on some measure of similarity. If it is assumed that the obtained clusters are functionally pure then sequences without annotations may inherit from annotated members of the same cluster. ProtoNet (22) aims to cluster the whole of protein sequence space using a very efficient algorithm (23). A hierarchical tree of clusters is automatically generated, where the lower a cluster is situated in the tree the smaller it is and the more similar are its proteins to each other. The user is required to browse the clustering hierarchy to identify the level most appropriate to their requirements. The CluSTr database (24) offers a similarly comprehensive and automatic classification of UniProt Knowledgebase (25) and IPI (26) proteins into groups of related proteins.
Similar to the use of evolutionary relationships in phylogenomics, some resources attempt to improve the accuracy of clustering by restricting themselves to orthologues and inparalogues. Notable amongst these are eggNOG (27), InParanoid (28) and OrthoMCL (29). eggNOG clusters orthologues at different levels of taxonomic granularity, allowing the user to choose the most appropriate level. To accommodate the modularity of protein sequences, different domains within a protein are assigned to different orthologous groups. InParanoid specializes in orthologous pairs in eukaryotic model organisms while MultiParanoid (30) extends these binary relationships to groups. Both eggNOG and InParanoid infer orthology and paralogy using BLAST reciprocal best hits, while OrthoMCL uses the Markov clustering (MCL) algorithm (31)
PhyloFacts (32) is another collection of protein families divided into functional subfamilies, where the latter are represented by subfamily HMMs. It uses an automatic and computationally efficient pipeline to carry out phylogenomic subclassification of the members of protein families. The central algorithm, SCI-PHY (Subfamily Classification in Phylogenomics) (33), uses a minimum-encoding-cost criterion to automatically determine the number of subfamilies to divide a family into. The method may be regarded as a hybrid of pattern recognition and clustering methods. SCI-PHY, however, in common with phylogenomic methods, requires an accurate multiple alignment of protein sequences as a starting point. Such an alignment, however, cannot be constructed for many of the large domain superfamilies since they have many members and their sequences are typically very diverse. Even if it is technically feasible to force an alignment of all the members of a very large superfamily, the alignment is likely to be erroneous and thus inappropriate as the starting point for SCI-PHY.
In this article, we present a new automated method, GeMMA (Genome Modelling and Model Annotation), for functional subfamily identification in Gene3D superfamilies of predicted CATH domains (4). GeMMA may be regarded as another hybrid method for subfamily classification like SCI-PHY, using pattern recognition and clustering, but unlike SCI-PHY and phylogenomic methods it does not require an initial multiple alignment of all sequences that are to be analysed. Furthermore, GeMMA can be ‘trained’ on high-quality annotated protein families, to derive generalized similarity thresholds for clustering sparsely or low-quality annotated families. Since it is built on top of the CATH classification of protein structures (5), GeMMA has the potential to be a particularly powerful tool in the study of protein evolution and for target selection in structural genomics. In the CATH database, protein structures in the PDB (34) are chopped into globular structural domains and these are assigned to very carefully manually curated superfamilies, on the basis of core similarities in their structures. Structure is more conserved than sequence and so these superfamilies can reveal very remote homology that is undetectable by sequence comparison methods. In addition, domains within a CATH superfamily often contain extensive embellishments around the conserved core structure (35), which further adds to the sequence diversity observed in these families.
In Gene3D, all UniProt sequences are compared to a large collection of HMMs constructed using all representative CATH domains as their seed sequences. Since CATH domain boundaries are carefully manually checked the boundaries of Gene3D predicted CATH domains are reasonably accurate. This improves the chances of their expression and crystallization for structure determination in structural genomics. The collection of all sequences that match the representative CATH HMMs within a superfamily can be extremely large and diverse. The top 25 superfamilies of predicted CATH domains in Gene3D 7.0 contain >40 000 sequences each, with the largest containing more than 300 000. GeMMA can cope with very large sets of sequences and extreme sequence diversity unlike phylogenomic methods and SCI-PHY, since it is not necessary to generate an alignment of all sequences as the first step in the analysis. Moreover, by dividing proteins up into their component domains, domains from different domain contexts may be easily compared, and the chaining together of unrelated domain sequences during sequence comparison is avoided.
While there is a shortage of good benchmarks for computational protein function prediction, the SCI-PHY method has been extensively benchmarked (36). Its performance was compared to the three other sequence-only methods Secator (37), Ncut (38) and CD-HIT (39), and found to be superior. Part of this benchmark was derived from one of the few readily available and high-quality benchmark sets, the protein families in the Structure–Function Linkage Database (SFLD) (40). The latter currently contains six manually curated, mechanistically diverse enzyme superfamilies. These six superfamilies are further divided into a total of 140 annotated subfamilies. Use of the SFLD as a challenging benchmark for function prediction methods has been described previously (41).
Since the SFLD families are probably the best curated set to date we chose them as a training set to derive generalized cluster similarity cut-offs for clustering whole protein and domain sequences. This was necessary because family-specific cut-offs cannot be derived in case of sparsely or low-quality annotated families (as in many of the Pfam families). However, at the same time, we felt it would be important to use the most reliable (i.e. SFLD) families in benchmarking, above all because this enables a reliable performance comparison with SCI-PHY. We thus followed a dual strategy: firstly, benchmarking of GeMMA versus SCI-PHY on each individual SFLD family with the respective family not included in the GeMMA training set (‘leave-one-out’ approach), and secondly, derivation of a generalized GeMMA cut-off for a larger Pfam benchmark from all six SFLD families. The SFLD benchmark is extended in a logical step-wise manner: first to the analysis of the conserved CATH domains that are predicted in the SFLD whole proteins and then to the whole Gene3D 7.0 superfamilies of these predicted domains. The latter are considerably larger than the subsets found in the SFLD. The success of GeMMA is measured using three previously published scoring functions used to assess the performance of SCI-PHY.
Subsequent to benchmarking GeMMA on the expert SLFD sequence set, its performance is compared to SCI-PHY again, in a larger, more diverse benchmark set derived from Pfam. This is intended to ensure that the generalized GeMMA threshold derived is broadly applicable and not optimized to just a limited set of small families. A high-throughput version of GeMMA is developed for use on a compute cluster in order to make the analysis of large superfamilies of protein domains possible. Various strategies are employed to speed up this version of the algorithm while the SFLD benchmark is used to ensure there is no deterioration in performance.
Finally, GeMMA is applied to the analysis of 11 CATH superfamilies selected by the Midwest Center for Structural Genomics (MCSG) for target selection to improve the coverage of structurally under-represented superfamilies in the second phase of the Protein Structure Initiative (PSI-2) (42). It is demonstrated that GeMMA accurately predicts many more targets for comparative protein modelling that produce acceptable models than are predicted by the commonly used approach (sequence comparison and selection of targets that share at least 30% sequence identity with the available template structures).
MATERIALS AND METHODS
The GeMMA algorithm is analogous to building a tree by starting at the leaves and working inwards towards the trunk, rather than starting at the trunk and working outwards. It is somewhat similar to the agglomerative clustering approach previously used in the SATCHMO sequence alignment and tree construction method (43). Most tree-based approaches require an initial multiple alignment of all the sequences that are to be analyzed. However, this becomes impossible as the size and diversity of the sequence set grows above a certain level. GeMMA avoids this problem, since it is unlikely that all of the sequences in a data set will need to be grouped together into a single alignment (and if so in the very last, not the very first iteration). It is thus possible to analyse data sets such as very large Gene3D superfamilies.
FS-GeMMA
The basic GeMMA algorithm is referred to as ‘Full Scale’ or FS-GeMMA to distinguish it from the high-throughput method described later (Figure 1). Put simply, the GeMMA algorithm performs iterative all-against-all profile–profile comparison of a set of sequence clusters followed by merging of the most similar clusters and then re-alignment of the newly created (merged) clusters. This is a modular process and in principle any profile–profile comparison and sequence alignment method may be used. GeMMA currently uses COMPASS (44) for profile–profile comparison and MAFFT (45) for sequence alignment, due to the speed and accuracy of these two methods. In addition, the latest version of MAFFT is capable of aligning up to 50 000 sequences, substantially more than many other methods are capable of aligning. Profile–profile comparison scores are stored after each iteration to avoid unnecessarily repeating comparisons. COMPASS calculates an E-value corresponding to the profile-profile comparison score and this E-value is used to monitor the progress of GeMMA. An E-value cut-off is used as a termination condition for the algorithm (see below).
Figure 1.

A flow chart outlining the basic GeMMA method. This low-throughput approach is referred to as ‘Full Scale’ or ‘FS-GeMMA’.
The output of GeMMA is a set of sequence clusters each in the form of a FASTA format multiple sequence alignment (with a hierarchical tree of these clusters as a by-product). Ideally, the aim of the GeMMA analysis is to partition the sequences in the data set into separate clusters with one cluster representing each function, and each member of a cluster having the same function as all the other members. In the case of convergent evolution to the same function within a data set, multiple subfamilies would be expected for this function.
Speeding up GeMMA
GeMMA is a computationally expensive algorithm, with a number of factors effecting the time that is required to complete execution. The total number of sequences determines the number of comparisons that must be made, longer sequences require more time to be compared and aligned; and the larger the clusters get as the GeMMA iterations proceed, the longer the time that is needed to align sequences and compare those alignments. Generally speaking execution on a single processor quickly becomes impractical as the number of protein sequences rises above about one thousand. Therefore, an alternative algorithm is devised for high-throughput analyses using a cluster of compute nodes. The high-throughput version of GeMMA will subsequently be referred to as ‘High Throughput’ or ‘HT-GeMMA’.
HT-GeMMA
HT-GeMMA (Figure 2) maintains the overall strategy of merging the most similar clusters first, as implemented in FS-GeMMA, by carrying out a series of stages of iterations where the E-value cut-off is progressively stepped up. Therefore, in the first stage all iterations are carried out with an E-value cut-off of 1 × 10−80, in the second stage the E-value cut-off is stepped up to 1 × 10−70, and so on.
Figure 2.

A flow chart outlining the high-throughput or HT-GeMMA method. Steps within the grey box are executed on the nodes of a compute cluster. Pre-clustering is used to reduce the number of clusters in the initial HT-GeMMA iteration.
HT-GeMMA achieves high levels of speed-up by distributing most steps of the GeMMA method to nodes on a compute cluster. Some steps must, however, execute on the master node since it is necessary to complete all comparisons in an iteration before merges can take place and also all merges must be completed before the subsequent comparisons in the next iteration can take place. The master node monitors the completion of these steps in the method. A number of other strategies are used to further speed up HT-GeMMA.
An all-v-all matrix of clusters to be compared is loaded into random access memory (RAM) and this matrix becomes too large for the amount of RAM typically available in modern computers when the number of clusters is above a few thousands. HT-GeMMA is applied in this work to superfamilies containing up to almost 50 000 sequences, and so to avoid exceeding the amount of RAM available a pre-clustering scheme is employed. This also dramatically reduces the total number of comparisons that must be made. Gene3D S30 clusters are chosen as the starting point for pre-clustering. These are multi-linkage clusters constructed with a 30% sequence identity cut-off following an all-by-all pair wise comparison of sequences in a Gene3D superfamily. Many of the sequences within the S30 clusters are likely to be associated with the same molecular function, and the clusters are typically small (the mean and maximum cluster sizes being of the order of 10 and a few 100 sequences, respectively); they are therefore accessible to FS-GeMMA. A simplified example is presented in an appendix to illustrate the reduction in the total number of comparisons that can be achieved by pre-clustering. Further details of the strategies and parameters implemented in the GeMMA algorithm are also included in the appendix. Benchmarking as described below is used to compare the performance of FS-GeMMA to HT-GeMMA, and the results are shown to be very similar.
Benchmarking and optimization
FS-GeMMA is applied to an SFLD benchmark similar to that used by Brown et al. (36), where they demonstrate the superior performance of SCI-PHY compared to a number of other approaches to protein subfamily clustering. The same three basic scoring schemes are applied: purity, edit distance, and VI distance (‘Appendix’ section).
Performance score
It is useful to have a single measure for optimizing GeMMA and comparing its performance to SCI-PHY that captures the desired balance between high sensitivity and high specificity. Edit and VI distances are expressed as a percentage of their initial values for the given data set by multiplying by the scaling factors ce and cv respectively, where
and
Here e = edit distance, v = VI distance, and e0 and v0 are the initial values of edit and VI distance. respectively. Initial values of edit and VI distance are calculated after placing each sequence in the data set into a separate subfamily. Then,
where p = purity expressed as a percentage.
Since both edit and VI distance are measures of sensitivity but only purity is a measure of specificity then purity is multiplied by a factor of 2.
The SFLD benchmark
The benchmark was derived from the Structure-Function Linkage Database (40); http://sfld.rbvi.ucsf.edu/ on 8 January 2009. This database of mechanistically diverse enzyme superfamilies is manually curated and continuously updated and now contains six superfamilies of whole proteins. These are listed in Table 1.
Table 1.
Composition of the SFLD and corresponding SFLD-Gene3D and Gene3D benchmarks
| SFLD superfamily | Sequences in the SFLD and SFLD-Gene3D benchmarks | Annotated sequences (% of total) | Annotation types (excluding ‘None’) | Conserved CATH domain superfamily | Domain sequences predicted in Gene3D 7.0 |
|---|---|---|---|---|---|
| Amidohydrolase | 1693 | 802 (47.4) | 35 | 3.20.20.140 | 15 932 |
| Crotonase | 1330 | 931 (70.0) | 14 | 3.90.226.10 | 19 323 |
| Enolase | 1556 | 1152 (74.0) | 17 | 3.20.20.120 | 4114 |
| Haloacid dehalogenase | 1285 | 936 (72.8) | 17 | 3.40.50.1000 | 20 614 |
| Terpene cyclase | 228 | 228 (100.0) | 40 | – | – |
| Vicinal oxygen chelate | 683 | 291 (42.6) | 17 | 3.10.180.10 | 11 592 |
The SFLD-Gene3D and Gene3D benchmarks
A fully conserved CATH domain is found in most of the SFLD superfamilies. For example, a 3.20.20.140 CATH domain is found in all sequences in the Amidohydrolase superfamily (Table 1). A new data set is created called the SFLD-Gene3D benchmark, consisting of just the Gene3D 7.0 predicted domain sequences of the conserved domains that are mapped onto SFLD whole proteins. Members of the Vicinal oxygen chelate superfamily are composed of a single CATH domain while the other five superfamilies are multi-domain proteins. A variety of different CATH domains accompany the conserved CATH domain, while the Terpene cyclase superfamily is not fully classified in CATH and must be excluded from the domain based analyses.
The Gene3D benchmark consists of all predicted CATH domains from the Gene3D 7.0 superfamilies that are identified as being conserved in the SFLD superfamilies and that are included in the SFLD-Gene3D benchmark. Domain predictions are made in Gene3D for all UniProt sequences and there is a considerably larger number of domains than those that are found in the proteins classified in the SFLD. SFLD-Gene3D benchmark sequences are thus subsets of the Gene3D benchmark sequences. Some of the additional domains in the Gene3D benchmark may belong to proteins that have not yet been classified in the SFLD, while others may belong to functional subfamilies that are not in the SFLD and may yet need to be functionally characterized. Although some of the extra protein sequences that domains are derived from have functional annotations, these are not used in the Gene3D benchmark. Only the SFLD annotations are used, since these are the most reliable and allow the results of the Gene3D benchmark to be compared to those of the SFLD and SFLD-Gene3D benchmarks.
Superfamily-specific and generalized E-value cut-offs
The performance score is used to determine the optimal, family-specific E-value cut-off for each SFLD superfamily. Further, a generalized E-value cut-off is derived from this training set, based on where the peak average performance is observed. This generalized cut-off is used in applying GeMMA to a larger Pfam benchmark and a set of Gene3D superfamilies that have been selected for structural genomics target selection. SCI-PHY and GeMMA (using both superfamily-specific and generalized E-value cut-offs) are compared in the SFLD benchmark. SCI-PHY is then again compared to GeMMA (using the generalized cut-off) in the larger Pfam benchmark. In both comparisons the performance score forms the central measure.
The Pfam benchmark
This is a larger and more diverse benchmark than the SFLD benchmark. However, it is not suitable for establishing a generalized E-value cut-off for GeMMA, due to the lower level of annotation and the likelihood of these annotations being, in some cases, less accurate. The broad applicability of the GeMMA generalized E-value cut-off is tested by comparing the performance of GeMMA and SCI-PHY on this benchmark. Annotations in the form of four-level Enzyme Commission (EC) numbers are used, since these represent annotations of the type and specificity used in the SFLD benchmark and are relatively easy to compare. Families are selected from Pfam 23.0 that contain at least two enzyme types annotated with EC numbers in UniProt (25). A total of 1741 families are identified and these contain between 5 and 71 535 members each. The largest variety of EC numbers found in a single Pfam family is for family PF00106, the short-chain dehydrogenase family, which is annotated with 87 different EC numbers. The largest Pfam family for which SCI-PHY successfully produces a result contains 29 970 members and so 15 larger families are removed from the benchmark. This appears to be a problem with memory allocation for SCI-PHY and ancillary programs. Furthermore, due to the computational expense of this analysis a representative set of 571 families is selected to constitute the final benchmark, with approximately the same distribution of family size and diversity as is found in the original 1741 families. The mean number of different EC annotations per family in this data set is 3.6.
The use of Pfam families means that the starting alignments that SCI-PHY requires are available. EC annotations are taken from the Gene3D 7.0 database (4), which are in turn imported from UniProt. An average of 20.1% of sequences in these 571 Pfam families have an annotation, compared to an average of 64.1% of sequences that are annotated in the SFLD benchmark (and the Pfam annotations are not expected to be as accurate as the SFLD ones). Performance in the Pfam benchmark is assessed using purity, edit and VI distance, and the same performance score that is used in the SFLD benchmark.
To test whether family size or family diversity have a differential effect on the two methods, the difference in the performance score of GeMMA and SCI-PHY is plotted against Pfam family size and Pfam family diversity in the results section. Family diversity is calculated as the number of multi-linkage clusters at 30% sequence identity, these being obtained from Gene3D 7.0. Although family diversity correlates with family size, the correlation is weak, thus necessitating both plots.
One important use of the function prediction aspect of GeMMA is to increase the coverage of annotations within a protein family. This not only increases the number of sequences with a putative annotation, but also increases the power of genomic inference methods such as phylogenetic profiling that can be used to predict functional associations between different proteins. The relatively low percentage of functionally annotated sequences in this Pfam data set allows the inheritance of annotation coverage of GeMMA to be compared to SCI-PHY. Firstly, all unannotated sequences within a predicted subfamily are allowed to inherit the annotation of any annotated member of that subfamily. Then the total coverage of all sequences in all Pfam families in the data set is calculated. As well as comparing GeMMA to SCI-PHY, a comparison is made to using multi-linkage clusters at 60% sequence identity (Gene3D S60 clusters), which is considered to be a safe level of similarity for functional inheritance if simple pair wise sequence identity is used (46–48).
Application of GeMMA to CATH superfamilies targeted by structural genomics
The 11 superfamilies of predicted CATH domains chosen for target selection by the Midwest Center for Structural Genomics (MCSG) are listed in Table 2. MCSG aims to broaden the structural coverage of these large and functionally and structurally diverse superfamilies. Note that the conserved CATH domains from three of the SFLD superfamilies are also found in this data set (3.20.20.140, 3.40.50.1000 and 3.90.226.10). These superfamilies are too large and diverse for the construction of single accurate multiple sequence alignments for each superfamily, and are thus not accessible to analysis using SCI-PHY. Analysis is performed using HT-GeMMA with a generalized E-value cut-off of 1e−30, as derived in the SFLD-Gene3D benchmark.
Table 2.
Composition of the 11 superfamilies of predicted CATH domains chosen for target selection by the Midwest Center for Structural Genomics and analysed using GeMMA and comparative protein modelling
| Superfamily | Total sequences | Annotated sequences (% of total) | Annotation types |
|---|---|---|---|
| 3.20.20.140 | 15 932 | 4355 (27.3) | 55 |
| 3.30.450.20 | 29 871 | 8859 (29.7) | 17 |
| 3.30.450.40 | 10 922 | 1702 (15.6) | 20 |
| 3.30.930.10 | 15 250 | 7888 (51.7) | 31 |
| 3.40.30.10 | 38 265 | 3182 (8.3) | 86 |
| 3.40.50.1000 | 20 614 | 2240 (10.9) | 80 |
| 3.40.50.1820 | 48 416 | 3570 (7.4) | 127 |
| 3.40.50.620 | 35 974 | 12 022 (33.4) | 75 |
| 3.40.630.30 | 27 036 | 1384 (5.1) | 77 |
| 3.90.1200.10 | 5671 | 383 (6.8) | 25 |
| 3.90.226.10 | 19 323 | 4838 (25.0) | 47 |
Comparative protein structure modelling
One of the major goals of structural genomics is to increase the coverage of protein sequences for which reasonably accurate structural models can be built through comparative modelling. A common approach to predicting the coverage that could be achieved by experimentally determining a domain structure is to identify the 30% sequence identity cluster that contains this proposed target and then count the number of sequences within the cluster that would subsequently be targets for comparative modelling. It is generally assumed that a sequence identity of at least 30% between template and modelling target will result in a reasonably accurate model. The proportion of accurate models generated decreases rapidly as the sequence identity falls below 30%. Notably, however, at the same time, the number of predicted homologues for a structural template generally increases rapidly below this threshold. Therefore, a significant number of reasonably accurate models may be built with sequence identities <30%. Many pair-wise sequence identities within GeMMA subfamilies are below 30%, and so GeMMA subfamilies have the potential to predict significantly increased modelling coverage compared to using 30% sequence identity clusters. This of course depends on the quality of models built within GeMMA subfamilies being sufficiently accurate. To assess the increased level of coverage that GeMMA can predict, comparative models are built within subfamilies of the 11 CATH superfamilies and their accuracy is predicted. This test is particularly important for sequence identities below 30%.
Several methods exist for predicting the accuracy of a comparative model when the true structure is unknown (49). Comparative models are built in this study using Modeller 9 (50), which has an in-built model assessment score called GA341. The GA341 score is a nonlinear combination of the percentage sequence identity of the alignment used to build the model, the model compactness, and the Z-score for a combined distance and surface statistical potential. A GA341 score of at least 0.6 indicates a reasonably accurate model (51).
Comparative models are built using Modeller for all sequences without an experimentally determined structure, within subfamilies of the 11 superfamilies of predicted CATH domains that contain a structural template. For each sequence, a model is built using each template within the same subfamily, and the quality of the models is assessed using the GA341 score. Some subfamilies contain more than one unique template and here a model is built for each sequence using each template. Where multiple models are available for a target sequence, the model with the highest GA341 score is retained.
RESULTS AND DISCUSSION
SFLD benchmark
FS-GeMMA iterations in the SFLD and SFLD-Gene3D benchmark are terminated at regular E-value cut-offs ranging from 10−200 to 10−10 and results are calculated. As a general trend, the purity of the resulting clusters (specificity) decreases as the E-value cut-off is increased above a certain level, while the edit distance decreases (sensitivity increases) and the VI distance decreases to a minimum and then increases again (sensitivity increases to a maximum and then decreases) as the E-value cut-off is increased. Purity is sometimes seen to decrease and then increase again, for example for the Crotonase superfamily in Figure 3(a). This can arise in at least two different ways. Firstly, two impure clusters can be merged together, so that the total proportion of impure clusters decreases. Secondly, a new pure cluster can be created with two annotated members that were previously in separate clusters (and thus were not counted), so that the overall proportion of pure clusters increases. Note also that for the SFLD-Gene3D Vicinal oxygen chelate domains in Figure 3(b) at very low E-value cut-offs the purity is 0%. This is because only clusters with at least two annotated members are included in the calculation of purity and at very low E-value cut-offs there is no more than one annotated member in each cluster.
Figure 3.

GeMMA purity, edit distance, VI distance and performance scores at a range of E-value cut-offs for (a) whole protein sequences in the SFLD benchmark, and (b) predicted conserved CATH domain sequences in the SFLD-Gene3D benchmark.
The highest performance scores are obtained at different E-value cut-offs for different superfamilies. For example, the peak for the Amidohydrolase SFLD superfamily in Figure 3(a) is at 10−60 while for the Crotonase SFLD superfamily the peak is at 10−40. Average performance scores are calculated for the six SFLD superfamilies in Figure 3(a) and the five SFLD-Gene3D superfamilies of conserved domains in Figure 3(b). The average peak performance for the SFLD superfamilies in Figure 3(a) is at an E-value cut-off of 10−40, while for SFLD-Gene3D in Figure 3(b) the peak is at 10−30. In general, because the SFLD-Gene3D domains have significantly shorter sequences than the whole SFLD proteins, the significance of the profile–profile similarities between different subfamilies of each superfamily is reduced for SFLD-Gene3D and the optimal E-value cut-off is shifted to a higher value. The SFLD and SFLD-Gene3D benchmarks suggest a generalized E-value cut-off of 10−40 for multi-domain proteins and 10−30 for single domains. Performance scores achieved by SCI-PHY and GeMMA on the set of SFLD protein superfamilies (using family-specific E-value cut-offs and the generalized E-value cut-off) are listed in detail in Table 3. Figure 3(b) also suggests the safe initial E-value cut-off of 10−80 that is used in HT-GeMMA.
Table 3.
Performance scores for SCI-PHY, GeMMA with a generalized E-value cut-off (GeMMA generalized), and GeMMA with superfamily-specific E-value cut-off (GeMMA specific) in the SFLD benchmark
| Superfamily | Method | Performance score |
|---|---|---|
| Amidohydrolase | SCI-PHY | 77.99 |
| GeMMA generalized | 84.83 | |
| GeMMA specific | 92.77 | |
| Crotonase | SCI-PHY | 81.29 |
| GeMMA generalized | 88.25 | |
| GeMMA specific | 88.25 | |
| Enolase | SCI-PHY | 91.70 |
| GeMMA generalized | 90.14 | |
| GeMMA specific | 90.59 | |
| Haloacid dehalogenase | SCI-PHY | 77.18 |
| GeMMA generalized | 90.70 | |
| GeMMA specific | 98.28 | |
| Terpene cyclase | SCI-PHY | 54.99 |
| GeMMA generalized | 53.64 | |
| GeMMA specific | 67.80 | |
| Vicinal oxygen chelate | SCI-PHY | 69.02 |
| GeMMA generalized | 74.97 | |
| GeMMA specific | 84.38 |
Note that the generalized GeMMA cut-offs used for each superfamily correspond to the level of peak performance when performance scores are averaged over the remaining five families, respectively (leave-one-out approach).
GeMMA compared to SCI-PHY
Generally, SCI-PHY appears to be optimized for high specificity (high purity) at the expense of rather low sensitivity (high edit and VI distances) compared to GeMMA, as can be seen in Figure 4. Both Figure 4 and the performance scores in Table 3 indicate that GeMMA usually achieves a greater balance between sensitivity and specificity, which is particularly important in such applications as structural genomics target selection: increased sensitivity generally results in a smaller number of clusters and thus a more manageable number of targets for structure determination. The reduction in the number of clusters when using GeMMA compared to SCI-PHY in the SFLD benchmark may be seen in Table 4. Only in one and two out of six cases SCI-PHY yields the lower number of clusters, when GeMMA is used with superfamily-specific and generalized thresholds, respectively.
Figure 4.

Purity, edit distance and VI distance for GeMMA with generalized (leave-one-out approach) and superfamily-specific E-value cut-offs and for SCI-PHY in the SFLD benchmark. Values for edit distance and VI distance for unclustered sequences are the initial values that are used in the calculation of the performance score. For unclustered sequences purity always has a value of zero.
Table 4.
Number of clusters generated by SCI-PHY, GeMMA with a generalized E-value cut-off (GeMMA generalized), and GeMMA with superfamily-specific E-value cut-offs (GeMMA specific) in the SFLD benchmark
| Superfamily | Method | Clusters | Singletons |
|---|---|---|---|
| Amidohydrolase | SCI-PHY | 638 | 364 |
| GeMMA generalized | 120 | 70 | |
| GeMMA specific | 304 | 132 | |
| Crotonase | SCI-PHY | 320 | 149 |
| GeMMA generalized | 223 | 165 | |
| GeMMA specific | 223 | 165 | |
| Enolase | SCI-PHY | 201 | 75 |
| GeMMA generalized | 65 | 40 | |
| GeMMA specific | 143 | 84 | |
| Haloacid dehalogenase | SCI-PHY | 332 | 181 |
| GeMMA generalized | 445 | 406 | |
| GeMMA specific | 188 | 136 | |
| Terpene cyclase | SCI-PHY | 22 | 1 |
| GeMMA generalized | 5 | 0 | |
| GeMMA specific | 89 | 55 | |
| Vicinal oxygen chelate | SCI-PHY | 302 | 163 |
| GeMMA generalized | 361 | 307 | |
| GeMMA specific | 146 | 90 |
The number of these clusters that are singletons (clusters with only one member) is also given.
It is envisioned, however, that SCI-PHY could potentially be used in conjunction with GeMMA, where GeMMA breaks down a large superfamily into subfamilies that are then accessible to SCI-PHY and the multiple sequence alignment that is required by SCI-PHY is provided by GeMMA. Subdivision by SCI-PHY could be performed within GeMMA subfamilies to improve purity where it is found to be too low.
Superfamily-specific E-value cut-offs compared to a generalized E-value cut-off
The results in Table 3 suggest that the performance of GeMMA with a generalized E-value cut-off is typically quite close to or the same as can be achieved with a family-specific E-value cut-off. This can also be seen in Figure 3 where the peak in the performance score for each superfamily is quite blunt and close to the position of the generalized E-value cut-off. These observations support the use of a generalized E-value cut-off for GeMMA. It could be argued that the availability of functional annotations for some members of a superfamily would make it attractive to establish a superfamily-specific cut-off for the analysis of that superfamily. In the case of the Amidohydrolase superfamily, for example, superior performance is achieved with a superfamily-specific cut-off. However, a sufficient level, accuracy, diversity and even distribution of functional annotations will not typically be available to determine a suitable cut-off for most superfamilies that are to be analysed. Inaccuracy, an insufficient level and diversity or a skewed distribution of functional annotations may easily suggest an inappropriate cut-off leading to inaccurate results. Therefore, the generalized E-value cut-offs (for whole proteins and domains) derived from the very well annotated SFLD benchmark are recommended for use in most situations.
High-throughput GeMMA
The results in Figure 5 show the SFLD benchmark being extended from FS-GeMMA applied to SFLD sequences to the type of situation in which GeMMA is intended to be applied, i.e. clustering whole superfamilies of predicted CATH domains using high-throughput computational methods. In Table 1 it can be seen that relative to the SFLD benchmark superfamilies there is an up to 17-fold increase (for the Vicinal oxygen chelate superfamily) in the number of sequences found in the corresponding Gene3D 7.0 superfamilies.
Figure 5.

Purity, edit distance and VI distance for FS-GeMMA and HT-GeMMA as the SFLD benchmark is progressively extended from SFLD whole protein to SFLD-Gene3D domain to Gene3D domain sequences. SFLD functional annotations are used throughout with no extra annotations being used in the Gene3D benchmark. Note that the high-throughput method HT-GeMMA is necessary to analyse the (large) Gene3D benchmark sets.
The step-wise progression in Figure 5 starts with a comparison of FS-GeMMA applied to SFLD sequences to FS-GeMMA applied to the conserved SFLD-Gene3D domain sequences. For all three scores the results are very similar, with no overall trend upwards or downwards exhibited for any of the scores. This can also be seen in the performance scores in Table 5. It may be concluded that there is sufficient sequence information in the conserved domains alone to reproduce the results that are obtained when analysing the whole protein sequences.
Table 5.
Performance scores for FS-GeMMA and HT-GeMMA (using superfamily-specific thresholds) as the benchmark is progressively extended from SFLD to SFLD-Gene3D to Gene3D
| Superfamily | Method and data set | Performance score |
|---|---|---|
| Amidohydrolase | FS-GeMMA SFLD | 92.77 |
| FS-GeMMA SFLD-Gene3D | 91.08 | |
| HT-GeMMA SFLD-Gene3D | 92.29 | |
| HT-GeMMA Gene3D | 91.10 | |
| Crotonase | FS-GeMMA SFLD | 88.25 |
| FS-GeMMA SFLD-Gene3D | 90.87 | |
| HT-GeMMA SFLD-Gene3D | 90.42 | |
| HT-GeMMA Gene3D | 87.85 | |
| Enolase | FS-GeMMA SFLD | 90.59 |
| FS-GeMMA SFLD-Gene3D | 90.80 | |
| HT-GeMMA SFLD-Gene3D | 90.88 | |
| HT-GeMMA Gene3D | 90.14 | |
| Haloacid dehalogenase | FS-GeMMA SFLD | 98.28 |
| FS-GeMMA SFLD-Gene3D | 94.83 | |
| HT-GeMMA SFLD-Gene3D | 95.63 | |
| HT-GeMMA Gene3D | 92.41 | |
| Vicinal oxygen chelate | FS-GeMMA SFLD | 84.38 |
| FS-GeMMA SFLD-Gene3D | 82.95 | |
| HT-GeMMA SFLD-Gene3D | 82.53 | |
| HT-GeMMA Gene3D | 77.24 |
The analysis is then extended to show that HT-GeMMA produces the same or very similar results to FS-GeMMA when applied to the same sets of SFLD-Gene3D domain sequences. Edit distances are consistently lower for HT-GeMMA but the difference is not thought to be significant. Overall performance scores are very similar throughout.
Finally, the results are shown for HT-GeMMA applied to the Gene3D benchmark of whole superfamilies of predicted CATH domains obtained from Gene3D 7.0. Only the original SFLD annotations are used in this last step of the benchmark even though some additional annotations are available for the extra sequences in Gene3D. Overall, there is a small decrease in the performance score when HT-GeMMA is applied to the much larger Gene3D superfamilies, with purity generally being a little lower and edit and VI distances generally being a little higher. Although the level of decrease in the performance is not large, with performance scores falling by no more than about 7% in the worst case (Table 5), and many other methods, such as SCI-PHY, are not applicable to such large and diverse data sets, some possible explanations are put forward. The SFLD superfamilies only contain carefully manually filtered sequences while all available sequences from UniProt are imported into Gene3D and this probably includes some protein fragments and less rigorously validated sequences. In addition, the increased sequence diversity in the Gene3D superfamilies may make these more challenging data sets for GeMMA.
Pfam benchmark
GeMMA compared to SCI-PHY
For both GeMMA with a generalized E-value cut-off and SCI-PHY, the majority of performance scores in the Pfam benchmark are found in the top three bins (Figure 6). This suggests a similar level of performance to that seen in the SFLD benchmark, but for a much larger and more diverse set of families. Since the total sums of the performance scores for each method are very similar to each other, neither method is clearly superior to the other (the total for GeMMA is 2.8% higher than that for SCI-PHY). Further, it can be seen in Figure 7 that family size and family diversity have no significant differential effect on the two methods.
Figure 6.

Distribution of performance scores for GeMMA and SCI-PHY in the Pfam benchmark.
Figure 7.

Average difference in performance scores between GeMMA and SCI-PHY in the Pfam benchmark (GeMMA score minus SCI-PHY score) versus (a) family size and (b) family diversity. Family diversity is calculated as the number of 30% sequence identity multi-linkage clusters in the family.
It is assumed in this benchmark that the often low level of functional annotation and the probable inaccuracy of some annotations has an equal effect on the scoring of both methods. An inadequate level of annotation can result in a score that is higher than it should be because errors within clusters are not detected, while incorrect annotations can result in a score that is lower than it should be. It is assumed that these effects cancel each other out to a certain extent in this benchmark.
The Pfam families in this benchmark contain multiple types of functional annotation in the form of EC numbers, i.e. multiple subfamilies. Both GeMMA and SCI-PHY are effective in subdividing the annotated sequences into functionally pure subfamilies (Figure 8). SCI-PHY achieves a slightly higher proportion of functionally pure subfamilies overall (∼3.1%).
Figure 8.

The number of annotation types found in Pfam families and the resultant SCI-PHY and GeMMA subfamilies in the Pfam benchmark. Annotation types were counted as the number of four-level EC numbers. Only families and subfamilies containing up to eight different types of annotation are shown.
Example results for a Pfam family
Pfam family PF03372 is a moderately large family in the Pfam benchmark, described in Pfam as an Endonuclease/Exonuclease/phosphatase family, and contains 4955 sequences in the Pfam-A full alignment. This family was not used to train GeMMA nor is it homologous to any of the SFLD superfamilies and thus is chosen to illustrate, in additional detail, the results of GeMMA analysis on a Pfam family. Nineteen different four-level EC numbers are assigned to this family in Gene3D: 2.1.1.14, 2.5.1.6, 2.7.1.33, 2.7.7.49, 3.1.1.29, 3.1.11.2, 3.1.11.6, 3.1.13.4, 3.1.21.1, 3.1.3.n1, 3.1.3.8, 3.1.3.25, 3.1.3.36, 3.1.3.56, 3.1.4.3, 3.1.4.12, 4.2.1.51, 4.2.99.18 and 6.3.5.2. GeMMA achieves a performance score of 80.75 (purity = 70%, edit distance = 33, VI distance = 0.70), while SCI-PHY achieves a performance score of 69.25 (purity = 71%, edit distance = 113, VI distance = 2.56). GeMMA produces 560 subfamilies of which 339 are singletons, while SCI-PHY produces 1028 subfamilies of which 648 are singletons.
In several cases, GeMMA and SCI-PHY display examples of ‘wrongly’ merging the same two types of functions. This happens for 3.1.3.36 and 3.1.3.56, i.e. two phosphoric monoester hydrolases with different substrate specificities. Another example is the merging of 3.1.4.3 and 3.1.4.12, i.e. two phosphoric diester hydrolases with different substrate specificities. A third case is the merging of 3.1.11.2 with 3.1.11.6, i.e. two exodeoxyribonucleases producing 5′-phosphomonoesters, again with different specificities. Finally, both methods merge 3.1.11.2 with 4.2.99.18, i.e. exodeoxyribonuclease III with DNA-(apurinic or apyrimidinic site) lyase.
In other cases, only one of the two methods merges sequences of different function. SCI-PHY merges the single instance of 2.5.1.6 (methionine adenosyltransferase) with instances of 3.1.3.56 (inositol-polyphosphate 5-phosphatase) while GeMMA does not. On the other hand, GeMMA displays examples of merging 3.1.3.n1 (another phosphoric monoester hydrolase with different substrate specificity) with both 3.1.3.36 and 3.1.3.56, while SCI-PHY does not. It also sometimes merges 3.1.11.2 with 4.2.99.18 as well as 3.1.11.6 (exodeoxyribonuclease VII) with 4.2.99.18 while SCI-PHY does not.
As can be seen for both methods from the above analysis, in most cases where different EC numbers are merged in a subfamily the difference in the enzyme reaction is a shift in substrate specificity rather than a more significant shift in enzyme type or mechanism of action. As well as showing in greater detail the result of GeMMA analysis on a Pfam family, this example also supports the possible application of SCI-PHY to GeMMA subfamilies in the analysis of Gene3D superfamilies (where SCI-PHY cannot be used directly on the whole superfamily). In some cases, SCI-PHY may be able to untangle functions that GeMMA has merged together.
Inheritance of annotations
Inheritance of functional annotations significantly increases the annotation coverage of families in the Pfam benchmark (Figure 9). Both SCI-PHY and GeMMA show the advantage of using more sophisticated methods of protein function prediction than using a safe pair wise sequence identity cut-off. The greater sensitivity of GeMMA compared to SCI-PHY allows for greater annotation coverage.
Figure 9.

Inheritance of functional annotations within the Pfam benchmark families. This shows the post-transfer annotation coverage achievable using Gene3D S60 clusters (multi-linkage sequence clusters at 60% sequence identity) and SCI-PHY and GeMMA subfamilies, respectively.
Comparative protein structure modelling
This analysis is conducted to help select target subfamilies for structure determination by MCSG in PSI-2. It is not performed using SCI-PHY since the superfamilies of predicted CATH domains are too large and diverse to construct a single accurate multiple sequence alignment for each superfamily (a necessary prerequisite for SCI-PHY analysis). For most of the superfamilies comparative modelling coverage is significantly greater within GeMMA subfamilies than it is within S30 clusters. Almost all models generated within S30 clusters are assessed as being of good quality using the GA341 score but only a slightly lower proportion of models are assessed as being of good quality within GeMMA subfamilies (Figure 10). In the case of superfamily 3.90.228.10, GeMMA coverage is more than 15 times >S30 coverage while the proportion of good models is 99.8% compared to 100%.
Figure 10.

Comparative modelling coverage of 11 superfamilies of predicted CATH domains chosen for structural genomics target selection by the Midwest Center for Structural Genomics. Coverage achieved within GeMMA subfamilies is compared to that within Gene3D S30 clusters (multi-linkage clusters at 30% sequence identity). The numbers above the columns are the percentage of good models as determined using the GA341 score incorporated in Modeller.
S30 clusters are often used to assess the impact on modelling coverage that determining an experimental structure would have or to determine the number of structures that would be needed to provide total modelling coverage of a superfamily. Here, however, we propose the use of GeMMA subfamilies instead, since the use of S30 clusters can significantly underestimate the impact of a structure and overestimate the number of structures that are needed for total coverage. A further advantage of GeMMA subfamilies is that they correspond well to functional subfamilies and could thus help provide a structure for each function within a superfamily at a lower cost to the structural genomics initiative. Some of the superfamilies presented here already have quite good modelling coverage. Greater than 60% modelling coverage of the whole 3.30.930.10 superfamily is found using GeMMA. The coverage of other superfamilies could be greatly improved by identifying the largest GeMMA subfamilies that contain no experimentally solved structure and then targeting members of these subfamilies. A refinement of the targeting might be the selection of interesting or unknown functions associated with the subfamilies.
FUNDING
The National Institutes of Health Protein Structure Initiative (Midwest Center for Structural Genomics grant code GM074942 to D.L.); the Experimental Network for Functional Integration EU (to R.R.). Funding for open access charge: Midwest Center for Structural Genomics grant code GM074942.
Conflict of interest statement. None declared.
ACKNOWLEDGEMENTS
The authors acknowledge the use of the UCL Legion High Performance Computing facility, and associated services, in the completion of this work.
APPENDIX
Benchmark measures
GeMMA is applied to a benchmark similar to that used by Brown et al. (36). The following equations and large parts of the explanatory text are thus directly taken from this publication.
Purity
Purity is the percentage of subfamilies within which all annotated members are annotated with the same function. A 100% purity may be attained trivially by having each sequence in a separate subfamily and so only subfamilies with at least two annotated members are included in the calculation of purity.
Edit distance
Edit distance is the number of split or merge operations that are required to transform the computed subfamilies (the predicted partition) into the subfamilies that correspond to the available functional annotations (the reference partition). The edit distance between a reference and a predicted partition with clusters k and k′, respectively, is calculated as
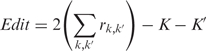 |
where  equals 1 if clusters k and k′ have items in common, and zero otherwise, and k and k′ are the number of clusters in each partition.
VI distance
Given two partitions, the VI distance measures the amount of information in each partition that is not shared between them. It is calculated as
where H is the entropy of a partition and I is the mutual information between two partitions:
Here, nk is the number of items in cluster k of partition S,  is the number of overlapping items between cluster k in partition S and cluster k′ in partition S′, K and K′ are the total number of clusters in the partitions S and S′, respectively, and N is the total number of items in the set. Identical partitions will have both an edit and VI distance of zero.
Both Edit distance and VI distance penalize over-division as well as mixing of subtypes, but the edit distance penalizes over-division of subtypes proportionately more than joining a few subtypes into large clusters. These two are analogous to sensitivity or recall, while purity is analogous to precision or specificity. The VI distance takes cluster size into account, and errors in large clusters (affecting many sequences) contribute more to the distance than errors in small clusters.
Further details of the HT-GeMMA method
When very large superfamilies are analyzed using HT-GeMMA, the memory requirements for storing an all-v-all matrix of profile–profile comparisons to be performed can be prohibitively large. This can be avoided by pre-clustering the sequences to reduce the initial number of clusters for HT-GeMMA analysis (Figures 2 and 11). This also reduces the time required by HT-GeMMA to converge on the final set of clusters. Gene3D S30 clusters are currently chosen as the starting point for pre-clustering. These are multi-linkage clusters constructed with a 30% sequence identity cut-off following an all-v-all pair wise comparison of sequences in a Gene3D superfamily. A simplified example is presented here to illustrate the reduction in the total number of comparisons that can be achieved by pre-clustering. Steps in the example are numbered in Figure 11.
Figure 11.

Illustration of the strategy employed to speed up HT-GeMMA. This uses a worked example described in the ‘Appendix’ section. Steps in the HT-GeMMA method are listed on the left and may be identified in the flow chart giving an overview of the method in Figure 2.
Pre-clustering
The all-v-all comparison of 50 000 sequences would require 1 249 975 000 comparisons [(50 000 × 49 999)/2] or nearly one and a quarter billion comparisons before any merging is performed. However, if these sequences were already clustered in Gene3D into 5000 S30 clusters each containing 10 sequences and FS-GeMMA (Figure 1) were used to analyse each S30 cluster then the total number of comparisons in the initial FS-GeMMA iterations would become 225 000 comparisons [5000 × (10 × 9)/2], which is a relatively manageable number (see steps 1 and 2 in Figure 11). FS-GeMMA usually requires multiple iterations so more comparisons than this would actually be performed but subsequent iterations require fewer comparisons and the total number of comparisons would still be relatively small. Not all sequences within a Gene3D S30 cluster necessarily have the same function and so FS-GeMMA when applied to the 5000 S30 clusters in this simplified example might typically produce 10 000 GeMMA clusters (an average of two GeMMA clusters per S30 cluster; see step 3 in Figure 11).
Sequences associated with the same molecular function are often found in different Gene3D S30 clusters so further analysis is required to merge together GeMMA clusters with the same function but HT-GeMMA analysis can now commence on the compute cluster with just 10 000 input clusters rather than the initial 50 000 (see steps 3–6 in Figure 11). The all-v-all comparison of 10 000 clusters would require 49 995 000 comparisons [(10,000 × 9,999)/2] or nearly 50 million comparisons. By commencing with 10 000 rather than 50 000 clusters there is a 25-fold reduction in the number of comparisons that need to be stored in memory when HT-GeMMA commences and a significantly shorter run time. A very stringent 1 × 10−80 E-value cut-off is used for FS-GeMMA in the pre-clustering step since it is important at this stage to avoid merging together any sequences associated with different functions before a superfamily wide all-v-all comparison is performed using HT-GeMMA.
HT-GeMMA clustering
HT-GeMMA must now undertake an all-v-all comparison of the 10 000 starting clusters to determine which clusters are functionally related and should be merged. A further strategy is employed to avoid performing the full 49 995 000 comparisons. Randomly selected batches of clusters are sent to each processor for all-v-all profile-profile comparison at the start of each iteration (steps 4–6 in Figure 11). The full 49 995 000 comparisons are not performed in the first iteration but rather just a subset, and similar clusters are merged so that there is a smaller total number of clusters remaining to select from for the next iteration.
Setting the HT-GeMMA batch size
The number of comparisons performed in each iteration is determined by the batch size, i.e. the number of comparisons that are selected for each batch that is sent to each processor. This is an adjustable parameter that depends on the total number of processors that are available in the compute cluster. For most of this work, 60 processors are available and the batch size is set to 30 000 (see step 4 in Figure 11). When the total number of comparisons for the whole data set is no more than 1 800 000 (60 × 30 000), an all-v-all comparison of the whole data set is accomplished in the first iteration. A total of 1 800 000 comparisons corresponds to an all-v-all comparison of no more than 1897 clusters. However, for the 10 000 starting clusters in this worked example up to about 28 iterations (49 995 000/1 800 000) might be required to achieve all-v-all comparison of the whole data set (see step 5 in Figure 11). An additional speed up is achieved with each iteration since merging clusters results in a reduction in the total number of clusters and hence in the total number of comparisons remaining to be completed in subsequent iterations (see step 6 in Figure 11). Some of the comparisons that would have needed to be performed no longer need to be performed.
Automatically setting the number of batches of comparisons sent to each processor in the compute cluster at the start of each iteration to be equal to the number of processors in the compute cluster reduces the waiting time between iterations (step 4 in Figure 11). As the GeMMA sequence clusters vary significantly in size, randomization of the pairs of clusters to be compared in each batch is used to even the load on the processors as well as provide an efficient sampling of pairs. Updated lists of all previously completed comparisons (written by scripts executing on the nodes) are read before commencing each iteration (except, of course, the first iteration; see step 5 in Figure 11). In this way, no comparisons need to be repeated. If the number of possible batches is less than the number of processors (e.g. during the final iterations before convergence on a high E-value cut-off, when the total number of clusters is small) then not all processors are used.
There is a potential problem associated with setting the batch size to a value that is too low. If an iteration completes before the all-v-all comparison of the whole data set had been achieved without any pairs being found with a sufficiently similar score then HT-GeMMA would terminate prematurely. For this reason it is necessary to set the batch size to a sufficiently large value so that the whole data set is sampled. It is found for the largest data sets analyzed in this work that a batch size of 30 000 is adequate to ensure that an all-v-all comparison is achieved in the first stage of HT-GeMMA with an E-value cut-off of 1 × 10−80 even when the matrix of all-v-all comparisons is quite sparse in terms of the number of clusters that have a similarity with a significance better than this cut-off, i.e. there may be only a small number of merges per iteration but never zero merges prior to convergence of the whole data set.
A smaller value for the batch size could be chosen for a compute cluster with more processors. If too few comparisons are available to allocate the batch size number of comparisons to each processor, HT-GeMMA automatically adjusts the batch size to equal the total number of comparisons divided by the number of processors. A large batch size also reduces the communication overhead on the compute cluster. This needs to be balanced against the speed up that is achieved, by keeping the batch size small enough for there to be multiple iterations leading to merges and a reduction in the number of pairs before the all-v-all comparison of the whole data set has been achieved, as described above.
REFERENCES
- 1.Lee D, Redfern O, Orengo C. Predicting protein function from sequence and structure. Nat. Rev. Mol. Cell Biol. 2007;8:995–1005. doi: 10.1038/nrm2281. [DOI] [PubMed] [Google Scholar]
- 2.Brenner SE. Errors in genome annotation. Trends Genet. 1999;15:132–133. doi: 10.1016/s0168-9525(99)01706-0. [DOI] [PubMed] [Google Scholar]
- 3.Devos D, Valencia A. Intrinsic errors in genome annotation. Trends Genet. 2001;17:429–431. doi: 10.1016/s0168-9525(01)02348-4. [DOI] [PubMed] [Google Scholar]
- 4.Yeats C, Lees J, Reid A, Kellam P, Martin N, Liu X, Orengo C. Gene3D: comprehensive structural and functional annotation of genomes. Nucleic Acids Res. 2008;36:D414–D418. doi: 10.1093/nar/gkm1019. [DOI] [PMC free article] [PubMed] [Google Scholar]
- 5.Cuff AL, Sillitoe I, Lewis T, Redfern OC, Garratt R, Thornton J, Orengo CA. The CATH classification revisited – architectures reviewed and new ways to characterize structural divergence in superfamilies. Nucleic Acids Res. 2009;37:D310–D314. doi: 10.1093/nar/gkn877. [DOI] [PMC free article] [PubMed] [Google Scholar]
- 6.Wilson D, Pethica R, Zhou Y, Talbot C, Vogel C, Madera M, Chothia C, Gough J. SUPERFAMILY—sophisticated comparative genomics, data mining, visualization and phylogeny. Nucleic Acids Res. 2009;37:D380–D386. doi: 10.1093/nar/gkn762. [DOI] [PMC free article] [PubMed] [Google Scholar]
- 7.Andreeva A, Howorth D, Chandonia JM, Brenner SE, Jubbard TJP, Chothia C, Murzin AG. Data growth and its impact on the SCOP database: new developments. Nucleic Acids Res. 2008;36:D419–D425. doi: 10.1093/nar/gkm993. [DOI] [PMC free article] [PubMed] [Google Scholar]
- 8.Friedberg I, Godzik A. Functional differentiation of proteins: implications for structural genomics. Structure. 2007;15:405–415. doi: 10.1016/j.str.2007.02.005. [DOI] [PubMed] [Google Scholar]
- 9.Pieper U, Chiang R, Seffernick JJ, Brown SD, Glasner ME, Kelly L, Eswar N, Sauder JM, Bonanno JB, Swaminathan S, et al. Target selection and annotation for the structural genomics of the amidohydrolase and enolase superfamilies. J. Struct. Funct. Genomics. 2009;10:107–125. doi: 10.1007/s10969-008-9056-5. [DOI] [PMC free article] [PubMed] [Google Scholar]
- 10.Rentzsch R, Orengo CA. Protein function prediction – the power of multiplicity. Trends Biotechnol. 2009;27:210–219. doi: 10.1016/j.tibtech.2009.01.002. [DOI] [PubMed] [Google Scholar]
- 11.Eisen JA. Phylogenomics: improving functional predictions for uncharacterized genes by evolutionary analysis. Genome Res. 1998;8:163–167. doi: 10.1101/gr.8.3.163. [DOI] [PubMed] [Google Scholar]
- 12.Engelhardt BE, Jordan MI, Muratore KE, Brenner SE. Protein molecular function prediction by Bayesian phylogenomics. PLoS Comput. Biol. 2005;1:e45. doi: 10.1371/journal.pcbi.0010045. [DOI] [PMC free article] [PubMed] [Google Scholar]
- 13.Finn RD, Tate J, Mistry J, Coggill PC, Sammut SJ, Hotz HR, Ceric G, Forslund K, Eddy SR, Sonnhammer EL, et al. The Pfam protein families database. Nucleic Acids Res. 2008;36:D281–D288. doi: 10.1093/nar/gkm960. [DOI] [PMC free article] [PubMed] [Google Scholar]
- 14.Sigrist CJA, Cerutti L, Hulo N, Gattiker A, Falquet L, Pagni M, Bairoch A, Bucher P. PROSITE: a documented database using patterns and profiles as motif descriptors. Brief Bioinform. 2002;3:265–274. doi: 10.1093/bib/3.3.265. [DOI] [PubMed] [Google Scholar]
- 15.Attwood TK, Bradley P, Flower DR, Gaulton A, Maudling N, Mitchell AL, Moulton G, Nordle A, Paine K, Taylor P, et al. PRINTS and its automatic supplement, prePRINTS. Nucleic Acids Res. 2003;31:400–402. doi: 10.1093/nar/gkg030. [DOI] [PMC free article] [PubMed] [Google Scholar]
- 16.Bru C, Courcelle E, Carrère S, Beausse Y, Dalmar S, Kahn D. The ProDom database of protein domain families: more emphasis on 3D. Nucleic Acids Res. 2005;33:D212–D215. doi: 10.1093/nar/gki034. [DOI] [PMC free article] [PubMed] [Google Scholar]
- 17.Letunic I, Copley RR, Pils B, Pinkert S, Schultz J, Bork P. SMART 5: domains in the context of genomes and networks. Nucleic Acids Res. 2006;34:D257–D269. doi: 10.1093/nar/gkj079. [DOI] [PMC free article] [PubMed] [Google Scholar]
- 18.Thomas PD, Campbell MJ, Kejariwal A, Mi H, Karlak B, Daverman R, Diemer K, Muruganujan A, Narechania A. PANTHER: a library of protein families and subfamilies indexed by function. Genome Res. 2003;13:2129–2141. doi: 10.1101/gr.772403. [DOI] [PMC free article] [PubMed] [Google Scholar]
- 19.Wu CH, Nikolskaya A, Huang H, Yeh LS, Natale DA, Vinayaka CR, Hu ZZ, Mazumder R, Kumar S, Kourtesis P, et al. PIRSF: family classification system at the Protein Information Resource. Nucleic Acids Res. 2004;32:D112–D114. doi: 10.1093/nar/gkh097. [DOI] [PMC free article] [PubMed] [Google Scholar]
- 20.Haft DH, Selengut JD, White O. The TIGRFAMs database of protein families. Nucleic Acids Res. 2003;31:371–373. doi: 10.1093/nar/gkg128. [DOI] [PMC free article] [PubMed] [Google Scholar]
- 21.Abhiman S, Sonnhammer EL. FunShift: a database of function shift analysis on protein subfamilies. Nucleic Acids Res. 2005;33:D197–D200. doi: 10.1093/nar/gki067. [DOI] [PMC free article] [PubMed] [Google Scholar]
- 22.Kaplan N, Sasson O, Inbar U, Friedlich M, Fromer M, Fleischer H, Portugaly E, Linial N, Linial M. ProtoNet 4.0: a hierarchical classification of one million protein sequences. Nucleic Acids Res. 2005;33:D216–D218. doi: 10.1093/nar/gki007. [DOI] [PMC free article] [PubMed] [Google Scholar]
- 23.Loewenstein Y, Portugaly E, Fromer M, Linial M. Efficient algorithms for accurate hierarchical clustering of huge datasets: tackling the entire protein space. Bioinformatics. 2008;24:i41–i49. doi: 10.1093/bioinformatics/btn174. [DOI] [PMC free article] [PubMed] [Google Scholar]
- 24.Petryszak R, Kretschmann E, Wieser D, Apweiler R. The predictive power of the CluSTr database. Bioinformatics. 2005;21:3604–3609. doi: 10.1093/bioinformatics/bti542. [DOI] [PubMed] [Google Scholar]
- 25.Mulder NJ, Kersey P, Pruess M, Apweiler R. In silico characterization of proteins: UniProt, InterPro and Integr8. Mol. Biotechnol. 2008;38:165–77. doi: 10.1007/s12033-007-9003-x. [DOI] [PubMed] [Google Scholar]
- 26.Kersey PJ, Duarte J, Williams A, Karavidopoulou Y, Birney E, Apweiler R. The International Protein Index: an integrated database for proteomics experiments. Proteomics. 2004;4:1985–1988. doi: 10.1002/pmic.200300721. [DOI] [PubMed] [Google Scholar]
- 27.Jensen LJ, Julien P, Kuhn M, von Mering C, Muller J, Doerks T, Bork P. eggNOG: automated construction and annotation of orthologous groups of genes. Nucleic Acids Res. 2008;36:D250–D254. doi: 10.1093/nar/gkm796. [DOI] [PMC free article] [PubMed] [Google Scholar]
- 28.O’Brien KP, Remm M, Sonnhammer EL. Inparanoid: a comprehensive database of eukaryotic orthologs. Nucleic Acids Res. 2005;33:D476–D480. doi: 10.1093/nar/gki107. [DOI] [PMC free article] [PubMed] [Google Scholar]
- 29.Chen F, Mackey AJ, Stoeckert CJ, Jr, Roos DS. OrthoMCL-DB: querying a comprehensive multi-species collection of ortholog groups. Nucleic Acids Res. 2006;34:D363–D368. doi: 10.1093/nar/gkj123. [DOI] [PMC free article] [PubMed] [Google Scholar]
- 30.Alexeyenko A, Tamas I, Liu G, Sonnhammer EL. Automatic clustering of orthologs and inparalogs shared by multiple proteomes. Bioinformatics. 2006;22:e9–e15. doi: 10.1093/bioinformatics/btl213. [DOI] [PubMed] [Google Scholar]
- 31.Enright AJ, Van Dongen S, Ouzounis CA. An efficient algorithm for large-scale detection of protein families. Nucleic Acids Res. 2002;30:1575–1584. doi: 10.1093/nar/30.7.1575. [DOI] [PMC free article] [PubMed] [Google Scholar]
- 32.Krishnamurthy N, Brown DP, Kirshner D, Sjolander K. PhyloFacts: an online structural phylogenomic encyclopaedia for protein functional and structural classification. Genome Biol. 2006;7:R83. doi: 10.1186/gb-2006-7-9-r83. [DOI] [PMC free article] [PubMed] [Google Scholar]
- 33.Brown DP, Krishnamurthy N, Sjolander K. Automated protein subfamily identification and classification. PLoS Comput. Biol. 2007;3:1526–1538. doi: 10.1371/journal.pcbi.0030160. [DOI] [PMC free article] [PubMed] [Google Scholar]
- 34.Berman HM, Westbrook J, Feng Z, Gilliland G, Bhat TN, Weissig H, Shindyalov IN, Bourne PE. The Protein Data Bank. Nucleic Acids Res. 2000;28:235–242. doi: 10.1093/nar/28.1.235. [DOI] [PMC free article] [PubMed] [Google Scholar]
- 35.Reeves GA, Dallman TJ, Redfern OC, Akpor A, Orengo CA. Structural diversity of domain superfamilies in the CATH database. J. Mol. Biol. 2006;360:725–741. doi: 10.1016/j.jmb.2006.05.035. [DOI] [PubMed] [Google Scholar]
- 36.Godzik A, Jambon M, Friedberg I. Computational protein function prediction: are we making progress? Cell Mol. Life Sci. 2007;64:2505–2511. doi: 10.1007/s00018-007-7211-y. [DOI] [PMC free article] [PubMed] [Google Scholar]
- 37.Wicker N, Perrin GR, Thierry JC, Poch O. Secator: A program for inferring protein subfamilies from phylogenetic trees. Mol. Biol. Evol. 2001;18:1435–1441. doi: 10.1093/oxfordjournals.molbev.a003929. [DOI] [PubMed] [Google Scholar]
- 38.Abascal F, Valencia A. Clustering of proximal sequence space for the identification of protein families. Bioinformatics. 2002;18:908–921. doi: 10.1093/bioinformatics/18.7.908. [DOI] [PubMed] [Google Scholar]
- 39.Li W, Godzik A. CD-hit: a fast program for clustering and comparing large sets of protein or nucleotide sequences. Bioinformatics. 2006;22:1658–1659. doi: 10.1093/bioinformatics/btl158. [DOI] [PubMed] [Google Scholar]
- 40.Pegg SC, Brown SD, Ojha S, Seffernick J, Meng EC, Morris JH, Chang PJ, Huang CC, Ferrin TE, Babbitt PC. Leveraging enzyme structure–function relationships for functional inference and experimental design: the structure–function linkage database. Biochem. 2006;45:2545–2555. doi: 10.1021/bi052101l. [DOI] [PubMed] [Google Scholar]
- 41.Brown SD, Gerlt JA, Seffernick JL, Babbitt PC. A gold standard set of mechanistically diverse enzyme superfamilies. Genome Biol. 2006;7:R8. doi: 10.1186/gb-2006-7-1-r8. [DOI] [PMC free article] [PubMed] [Google Scholar]
- 42.Dessailly BH, Nair R, Jaroszewski L, Fajardo JE, Kouranov A, Lee D, Fiser A, Godzik A, Rost B, Orengo C. PSI-2: structural genomics to cover protein domain family space. Structure. 2009;17:869–881. doi: 10.1016/j.str.2009.03.015. [DOI] [PMC free article] [PubMed] [Google Scholar]
- 43.Edgar RC, Sjölander K. SATCHMO: sequence alignment and tree construction using hidden Markov models. Bioinformatics. 2003;19:1404–1411. doi: 10.1093/bioinformatics/btg158. [DOI] [PubMed] [Google Scholar]
- 44.Sadreyev RI, Grishin NV. COMPASS: a tool for comparison of multiple protein alignments with assessment of statistical significance. J. Mol. Biol. 2003;326:317–336. doi: 10.1016/s0022-2836(02)01371-2. [DOI] [PubMed] [Google Scholar]
- 45.Katoh K, Kuma K, Toh H, Miyata T. MAFFT version 5: improvement in accuracy of multiple sequence alignment. Nucleic Acids Res. 2005;33:511–518. doi: 10.1093/nar/gki198. [DOI] [PMC free article] [PubMed] [Google Scholar]
- 46.Addou S, Rentzsch R, Lee D, Orengo CA. Domain-based and family-specific sequence identity thresholds increase the levels of reliable protein function transfer. J. Mol. Biol. 2009;387:416–430. doi: 10.1016/j.jmb.2008.12.045. [DOI] [PubMed] [Google Scholar]
- 47.Rost B. Enzyme function less conserved than anticipated. J. Mol. Biol. 2002;318:595–608. doi: 10.1016/S0022-2836(02)00016-5. [DOI] [PubMed] [Google Scholar]
- 48.Tian W, Skolnick J. How well is enzyme function conserved as a function of pairwise sequence identity? J. Mol. Biol. 2003;333:863–882. doi: 10.1016/j.jmb.2003.08.057. [DOI] [PubMed] [Google Scholar]
- 49.Eramian D, Eswar N, Shen MY, Sali A. How well can the accuracy of comparative protein structure models be predicted? Protein Sci. 2008;17:1881–1893. doi: 10.1110/ps.036061.108. [DOI] [PMC free article] [PubMed] [Google Scholar]
- 50.Sali A, Blundell TL. Comparative protein modelling by satisfaction of spatial restraints. J. Mol. Biol. 1993;234:779–815. doi: 10.1006/jmbi.1993.1626. [DOI] [PubMed] [Google Scholar]
- 51.John B, Sali A. Comparative protein structure modeling by iterative alignment, model building and model assessment. Nucleic Acids Res. 2003;31:3982–3992. doi: 10.1093/nar/gkg460. [DOI] [PMC free article] [PubMed] [Google Scholar]