Abstract
Lipid droplet proteins (LDPs) coat the surface of triglyceride-rich lipid droplets and regulate their formation and lipolysis. We profiled hepatic LDP expression in fatty liver dystrophic (fld) mice, a unique model of neonatal hepatic steatosis that predictably resolves between postnatal day 14 (P14) and P17. Western blotting revealed that perilipin-2/ADRP and perilipin-5/OXPAT were markedly increased in steatotic fld liver but returned to normal by P17. However, the changes in perilipin-2 and perilipin-5 protein content in fld mice were exaggerated compared with relatively modest increases in corresponding mRNAs encoding these proteins, a phenomenon likely mediated by increased protein stability. Conversely, cell death-inducing DFFA-like effector (Cide) family genes were strongly induced at the level of mRNA expression in steatotic fld mouse liver. Surprisingly, levels of peroxisome proliferator-activated receptor γ, which is known to regulate Cide expression, were unchanged in fld mice. However, sterol-regulatory element binding protein 1 (SREBP-1) was activated in fld liver and CideA was revealed as a new direct target gene of SREBP-1. In summary, LDP content is markedly increased in liver of fld mice. However, whereas perilipin-2 and perilipin-5 levels are primarily regulated posttranslationally, Cide family mRNA expression is induced, suggesting that these families of LDP are controlled at different regulatory checkpoints.
Keywords: hepatic steatosis, lipodystrophy, perilipin family, lipin, lipid droplet
Lipid droplets (LDs) are metabolically active structures that play important roles in lipid transport, sorting, and signaling cascades (1). Although adipose tissue is the predominant site of fat storage in higher organisms, most tissues have at least some capacity to store triglyceride (TG) in small LDs that can be used for an immediate energy source. However, several pathologic conditions are associated with marked ectopic fat deposition. For example, fatty liver disease is characterized by striking accumulation of neutral lipid in the cytosol of hepatocytes. The accumulation of LDs in hepatocytes is often, at least overtly, a nonprogressive condition. However, in some individuals, lipotoxicity can result in pathologic changes in hepatic cytoarchitecture, including hepatocyte apoptosis and ballooning and inflammation (steatohepatitis) that subsequently can result in fibrosis and parenchymal remodeling with cirrhosis.
The surface layer of LDs is coated by numerous proteins collectively known as lipid droplet proteins (LDPs) (reviewed in ref. 2). Although a variety of proteins associate with LDs, the best-studied is the family of PAT proteins (3). This family was named after the original three constituents, perilipin, adipocyte differentiation-related protein (ADRP), and tail interacting protein 47 (TIP47). Recently, a standardized nomenclature for PAT family proteins has been adopted (4) and this revised naming system for perilipin-1 (perilipin), perilipin-2 (ADRP or adipophilin), and perilipin-3 (TIP47) is used hereafter. Two additional proteins, perilipin-4 (S3-12) and perilipin-5 (also known as OXPAT, MLDP, PAT-1, and LSDP5) (5, 6), have now been added to the perilipin family based on sequence and functional similarities. Another family of proteins, known as the cell death-inducing DFFA-like effector (Cide) family of proteins (CideA, CideB, and CideC), has also recently emerged as LDPs that regulate LD metabolism (7). The mouse homolog of CideC is known as Fsp27 and will be referenced as such henceforth. Interestingly, work from several groups has convincingly demonstrated that Cide proteins are also physically associated with LDs and modulate LD size and metabolism (8, 9).
LDPs allow LDs to maintain a dynamic communication with the endoplasmic reticulum and the plasma membrane (1). Several lines of evidence suggest that perilipin-1 and perilipin-2 are physical barriers to lipolytic enzymes under basal conditions yet can facilitate interactions with lipases and enhance lipolysis in response to lipolytic stimuli (10–12). The significant alterations in lipid metabolism observed in mouse models with targeted deletion of LDPs are strong evidence for important roles for these proteins in regulating metabolism (13–15).
Although LDPs were originally studied from the perspective of their effects in adipose tissue, more recent work has shown critical roles for LDPs in regulating fat metabolism in liver, especially in the context of lipid overload such as occurs in obesity-related fatty liver disease. Specifically, the expression of perilipin-2, CideA, and Fsp27 is induced in liver of ob/ob mice, which exhibit marked hepatic steatosis (16–18). Moreover, mice deficient in perilipin-2, CideB, or Fsp27 are protected from developing obesity-related fatty liver disease (15, 19), suggesting that these proteins play a role in driving hepatic lipid accumulation or enhancing the capacity for storing lipid.
We sought to evaluate the expression of lipid droplet proteins in liver of fatty liver dystrophic (fld) mice, a lipodystrophic model of fatty liver (20). The complex and severe metabolic phenotype of fld mice is caused by a mutation in the gene encoding lipin 1 (Lpin1) (21). The fld mice appear normal at birth, but rapidly develop an enlarged fatty liver (20). Hepatic lipid accumulation in fld mice spontaneously and rapidly resolves prior to weaning (20), making this model a unique and interesting system in which to study the expression of the LDP proteins. Herein, we demonstrate that expression of several LDPs is markedly increased in the steatotic liver of fld mice, and decreases as the fatty liver phenotype resolves. Our studies also revealed that the PAT and Cide families of LDPs are controlled by distinct regulatory mechanisms in steatotic hepatocytes.
MATERIALS AND METHODS
Animal studies
All studies were conducted with matched littermate mice. Homozygous fld (fld/fld) mice were compared with littermate heterozygous (fld/+) or wild-type (+/+) control mice. Eighteen-week-old female ob/ob and lean littermate (ob/+) were sacrificed for tissue collection. All animal experiments were approved by the Washington University School of Medicine Animal Studies Committee and conformed to criteria outlined in the National Institutes of Health Guide for the Care and Use of Laboratory Animals.
Tissue histology
Freshly obtained liver samples were fixed overnight in 10% buffered formalin and embedded in paraffin. Hematoxylin and eosin staining was carried out by the Digestive Disease Research Core Center at Washington University School of Medicine.
Determination of liver TG levels
TG concentration was determined by a commercial colorimetric method (Wako Chemicals, Richmond, VA) with solvent extracted lipid, as described (22). Total liver protein was extracted using tissue protein extraction reagent (number 78510; Pierce) and TG concentration is expressed as milligrams of TG/g of liver protein.
mRNA isolation and gene expression analyses
Liver RNA was extracted with RNAzol Bee (Isotexdiagnostics, Friendswood, TX) according to the manufacturer's instructions. Real time RT-PCR was performed using the ABI PRISM 7500 sequence detection system (Applied Biosystems, Foster City, CA) and the SYBR green kit. Using the standard curve method, the relative amount of specific PCR products for each primer set was generated. For normalization, 36B4 was amplified from each sample, and arbitrary units of target mRNA were corrected to the corresponding level of the 36B4 mRNA. The sequences of the primers used in these studies can be found in supplementary Table I.
Protein isolation and cellular fractionation of mouse livers
For Western blot studies in Fig. 2, protein extracts were obtained from liver by using the following lysis buffer (10 mM HEPES pH 7.5, 150 mM NaCl, 1 mM EDTA, 1 mM EDTA, 0.1% sodium deoxycholate, and 1% Triton X-100) containing a protease inhibitor cocktail. For sterol-regulatory element binding protein (SREBP)-1 Western blots, nuclear proteins were isolated using the NXTRACT nuclear protein isolation kit (Sigma Chemical Co., St. Louis, MO). Protein concentrations were determined with the Micro BCA protein assay kit (Thermo Scientific, Rockford, IL).
Fig. 2.
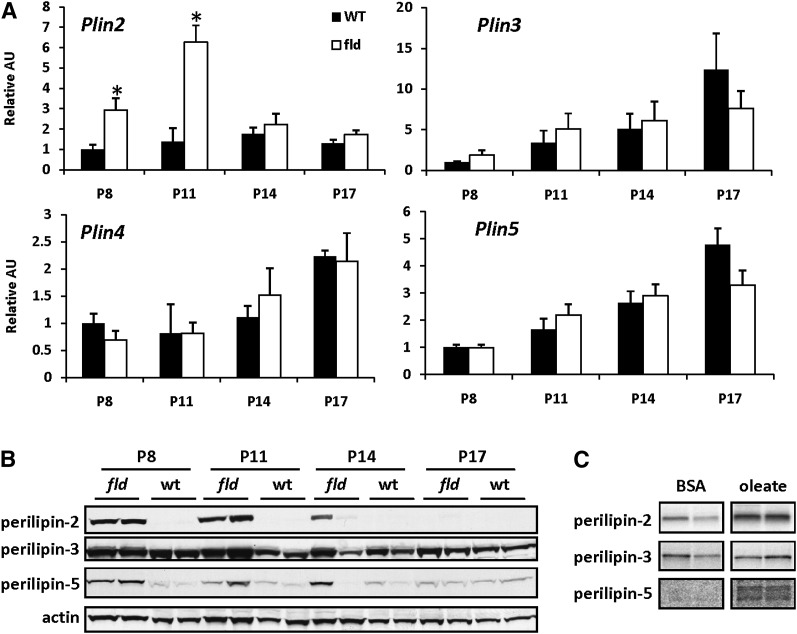
PAT family protein stability is increased in liver of fld mice and by fat loading. A: The graphs depict results of RT-PCR analyses to quantify mRNA levels of PAT proteins using liver RNA isolated from WT and fld mice at indicated postnatal days. Values are normalized (= 1.0) to P8 WT control expression levels. * P < 0.05 versus WT littermates. B: Representative Western blotting analyses using hepatic protein isolated from WT and fld mice at indicated postnatal days. C: Representative autoradiographs of immunoprecipitated 35S-labeled perilipin-2, perilipin-3, or perilipin-5 from pulse-chase studies are shown. Hepatocytes isolated from adult WT mice were cultured in the presence or absence of 0.4M oleic acid (OA) and labeled for 1 h with 35S-methionine. Labeled methionine was then chased with medium containing 1000× cold methionine for 12 h before cell lysates were collected. Perilipin-2 and perilipin-5 were then immunoprecipitated, purified by washing, separated by SDS-PAGE, and the fixed and dried gels exposed to autoradiographic film.
For subcellular fractionation studies, livers from 12-week-old fed fld and wild-type (WT) mice were minced and then homogenized by a Teflon pestle tissue homogenizer in lysis buffer (10 mM HEPES, 1 mM EDTA, pH 7.4). The nuclear fraction was obtained by 2,000 g centrifugation for 5 min. The 2,000 g supernatant was weighted with sucrose to 40% (w/v) with 65% sucrose and was then overlaid with successive layers of 5 ml 35% sucrose and 5 ml 10% sucrose. The tubes were then filled to capacity with lysis buffer. The gradients were centrifuged at 172,000 g for 3 h at 4°. Fractions were harvested as described previously and stored at −80°C until Western blot analyses (23).
Western blot analysis
Western blotting studies were performed with whole-cell lysates (40 µg) or nuclear lysates (20 µg) as indicated. Proteins from sucrose gradient isolation were loaded by volume rather than protein content. Proteins were separated on 4%–12% gradient gels by SDS-PAGE. Proteins were then transferred onto nitrocellulose membranes that were then blocked with 5% (w/v) nonfat dry milk in TBS-Tween (20 mM Tris-HCl pH 7.5, 0.9% NaCl, 0.05% Tween 20) prior to immunoblotting. Generation of rabbit-derived antibodies directed to carboxyl-terminus of perilipin-5, the amino-terminus of perilipin-3, and the amino-terminus of perilipin-2 has been described previously (5, 6). Antibodies to glycogen synthase (Proteintech Group, Chicago, IL), peroxisome proliferator-activated receptor γ (PPARγ) (Santa Cruz, San Diego, CA), SREBP-1 (Santa Cruz), CideA (Genway, San Diego, CA), Fsp27 (generous gift of Dr. Vishwajeet Puri), and actin (Sigma) were used according to the manufacturer's instructions.
Primary mouse hepatocyte isolation
Primary mouse hepatocytes were isolated from mice as previously described (24). Briefly, mice were anesthetized and then perfused through the portal vein with warmed HBSS containing collagenase. Livers were mechanically disrupted with forceps. Released cells were washed extensively and plated onto collagen coated dishes and grown in culture in DMEM supplemented with 5% FBS.
Pulse-chase experiment
After plating and adherence, hepatocytes from adult WT mice were washed three times with PBS and incubated in Met- and Cys-free DMEM for 1 h to deplete the cellular pool of Met and Cys. Thereafter, the medium was replaced with 1 ml of Met- and Cys-free DMEM containing 200 µCi of [35S]Promix with or without oleic acid (OA) (0.4 mM; to give an OA/BSA ratio of 6) for 1 h. After the 1 h pulse, the cells were washed twice with PBS and incubated in 1 ml of DMEM containing 10 mM Met and 3 mM Cys for 12 h with or without the specified OA.
Immunofluorescence microscopy
Hepatocytes from P14 WT or fld mice were isolated, plated, and then fixed with formaldehyde after adhering for 1 h. Fixed hepatocytes were then stained as described previously (25) with antibodies below. The cells were stained with anti- perilipin-2 (Fitzgerald Industries International, Flanders NJ, CAT# 20R-AP002), perilipin-3 (6), or perilipin-5 (5) antibodies. The secondary antibodies were goat Anti-Guinea Pig Alexa 488 and Donkey Anti-Rabbit Alexa 594 (Invitrogen, CAT# A-11073, CAT #A-21207), respectively. Images were captured on a Nikon Eclipse TE2000U by using a 60× oil objective lens on a photometric cool-snap camera (Nikon Instruments) driven by Metamorph software (UIC, Downingtown, PA). Appropriate filters were used to image the signals from the two secondary antibodies separately.
Adenovirus studies
To produce an adenovirus expressing a constitutively active form of human SREBP-1a (26), a cDNA fragment (∼1.5 kb) encoding the amino acids 1–460 of human SREBP-1a was generated from poly-A RNA isolated from HepG2 cells by RT-PCR using the following primers: 5′ primer, 5′-GGGAAGCTTGCTCCCTAGGAAGGGCCGTACGAGGCG-3′; and 3′ primer, 5′-GTCTAGACTACTAGTCAGGCTCCGAGTCACTGCCACTGCCAC-3′. The resultant PCR product was subcloned into a TA-cloning vector and subcloned into the Ad-track shuttle vector. For overexpression of PPARγ, a full-length, FLAG-tagged, mouse PPARγ1 cDNA was cloned into the Adtrack vector. The final adenovirus constructs were produced using the AdEasy system as described (27). Mouse hepatocytes were infected with the specified adenovirus at an MOI of 8 as described previously (28). RNA was isolated 48 h after adenoviral infection.
Promoter-luciferase reporter studies
HEK-293 cells were maintained in DMEM-10% fetal calf serum. Cells were transfected using calcium-phosphate coprecipitation and luciferase activity in cell lysates determined by Dual-Glo (Promega) assays 60 h after transfection. The Cidea promoter constructs have been previously described (29) and contain -1385 (pCID2), -888 (pCID3), or -578 (pCID4) of the 5′-flanking sequence of the Cidea gene (all notations are relative to the transcriptional start site). Cidea promoter constructs were cotransfected with expression constructs driving expression of the caSREBP-1 ((26), generous gift of Jay Horton) or empty vector control and SV40-driven renilla luciferase expression construct. All values are normalized to 1.0 and firefly luciferase values were corrected to renilla luciferase activity.
ChIP analyses
Chromatin immunoprecipitation (ChIP) experiments were performed as previously described (27). Hepatocytes from WT mice were dissociated with collagenase, plated, and infected with adenovirus to express caSREBP-1 and/or GFP. After 24 h of infection, hepatocytes were cross-linked in 1% formaldehyde for 15 min. Chromatin-bound proteins were immunoprecipitated using antibodies directed against SREBP-1 or IgG control. PCR primers (supplementary Table I) were designed to amplify a region of the Cidea gene promoter identified in the promoter deletion series as being responsive to SREBP-1 or an exon of the Acadm gene (27, 30).
Statistical analyses
Statistical comparisons were made using ANOVA or t-test. All data are presented as means ± SEM, with a statistically significant difference defined as a P value < 0.05.
RESULTS
Time-course of hepatic steatosis in neonatal fld mice
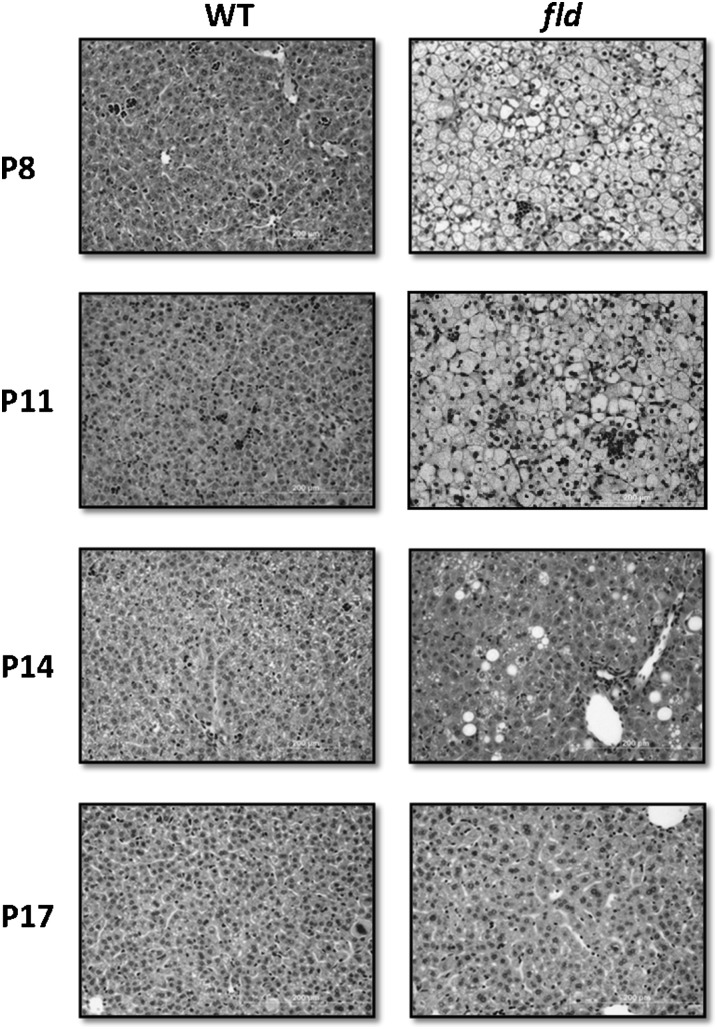
We sought to evaluate the hepatic histological and biochemical phenotype of young fld mice at 3 day intervals. Histological examination of hepatic sections from WT and fld mice at P8 and P11 revealed virtual replacement of the parenchyma by hepatocytes distended with tiny fat droplets. Hepatocytes had a “foamy” appearance, which is a morphologic appearance consistent with microvesicular steatosis (Fig. 1). Hepatic triglyceride content was strikingly elevated 30-fold and 40-fold at P8 and P11, respectively, in fld mice compared with WT mice (Table 1). By P14, microvesicular LD were greatly reduced in fld mice. However, occasional large lipid droplets remained present and hepatic TG content remained elevated 8-fold compared with WT. At P17, fld and WT liver sections were indistinguishable in biochemical TG and histological analyses
Fig. 1.
Lipid droplets in fld mouse liver exhibit a microvesicular distribution. Representative hematoxylin and eosin -stained liver sections from WT and fld mice at postnatal day 8 (P8), P11, P14, and P17 are shown. As can be noted, the marked microvesicular steatosis in P8 and 11 is gone in P14 and P17. In p14 mice, only scattered hepatocytes with macrovesicular fat droplets were noted, whereas P17 mice livers were indistinguishable from WT. (Hematoxylin and eosin; 20×).
TABLE 1.
Hepatic TG content in WT and fld mice at indicated postnatal day
| TG content | WT | fld |
|---|---|---|
| day | mg liver TG/g | mg liver TG/g |
| P8 | 4.97 ± 3.22 | 159.62 ± 71.54a |
| P11 | 5.42 ± 4.35 | 195.63 ± 100.83a |
| P14 | 4.94 ± 0.67 | 37.50 ± 16.43a |
| P17 | 3.71 ± 1.07 | 5.31 ± 3.27 |
P < 0.05.
PAT protein expression is increased in steatotic fld mouse liver
LDP expression is induced in many models of hepatic steatosis secondary to obesity or lipodystrophy (16, 18, 31–33), but whether these genes are regulated in fld mice is unknown. Of the five PAT genes, only the hepatic expression of perilipin-2 mRNA (Plin2) was significantly affected in fld mice compared with control WT littermates (Fig. 2A). Plin2 mRNA expression was increased in fld mice at P8 and P11 but then declined by P14 during the resolution of fatty liver. Perilipin-2 protein levels were also vigorously increased in fld mice at P8, P11, and P14, but declined by P17 (Fig. 2B). Compared with the increase in Plin2 mRNA, the increase in perilipin-2 protein was more robust, suggesting that posttranscriptional mechanisms also impact perilipin-2 protein content in lipid-laden liver.
The expression of Plin3 and Plin5 mRNA was unchanged between fld and WT animals at all ages examined (Fig. 2A). Conversely, perilipin-5 protein levels were induced markedly in fld liver compared with littermate controls at P8, P11, and P14 (Fig. 2B), suggesting posttranscriptional regulation. Perilipin-3 protein was also increased modestly in steatotic fld livers. Perilipin-3 and perilipin-5 protein levels declined coincident with the resolution of hepatic steatosis. Perilipin-1 and perlipin-4 protein and mRNA were undetectable in all livers (data not shown), consistent with low expression of these proteins in liver. These data suggest that levels of the PAT proteins, perilipin-2, perilipin-5, and to a lesser extent, perilipin-3, are increased in fld liver coincident with elevated hepatic TG levels, but are regulated independent of changes in their corresponding RNAs.
To confirm that the observed disconnect between mRNA protein was applicable to other models of hepatic steatosis, we measured the expression of Plin2 and Plin5 mRNA in ob/ob mouse liver and compared the levels of the corresponding proteins. We found that perilipin-2 and perilipin-5 protein levels were markedly induced in ob/ob liver compared with littermate controls (supplementary Fig. I). Although Plin2 and Plin5 mRNA expression was also upregulated, the observed increase in protein was out of proportion to the mRNA induction. These data also suggest posttranscriptional regulation of PAT proteins possibly related to the increased stability with fatty acid overabundance.
Fat loading increases PAT protein stability in hepatocytes
Previous work has shown that fatty acid abundance can increase the stability of perilipin-2 and perilipin-1 in immortalized cell lines (34, 35). Given the disconnect between PAT mRNA and protein in steatotic liver, we sought to evaluate protein stability of perilipin-2, perilipin-3, and perilipin-5 after loading WT hepatocytes with 400 uM oleate for 1 h. As we hypothesized, oleate loading increased the quantity of 35S-labeled perilipin-2 6-fold 12 h after chasing with cold methionine (Fig. 2C). Similarly, oleate loading increased perilipin-5 content (3-fold) after a 12 h chase, whereas perilipin-3 content was not significantly increased (Fig. 2C). These data suggest that lipid overabundance stabilizes perilipin-2 and perilipin-5 and enhances their half-lives.
Perilipin-2, perilipin-3, and perilipin-5 coat LDs but may mark distinct lipid pools
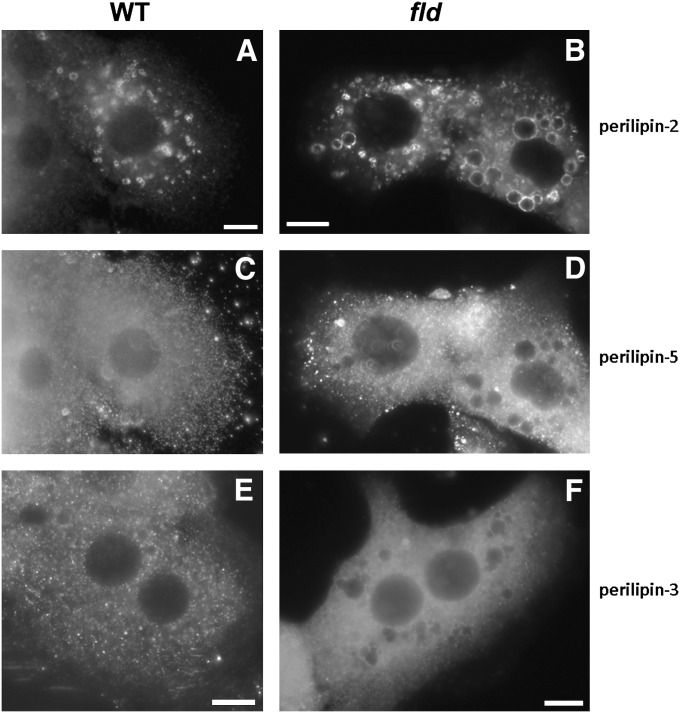
We next determined the subcellular distribution of the PAT proteins that were induced in fld liver by using isolated hepatocytes from WT and fld mice and performing immunofluorescent staining. Perilipin-2 was localized primarily to large LDs in both WT and fld hepatocytes (Fig. 3). An increase in the quantity of perilipin-2 in fld hepatocytes compared with WT cells was also evident. In contrast, perilipin-5 and perilipin-3 are observed in a diffuse pattern throughout the cytosol in both fld and WT hepatocytes with more intense staining in the fld hepatocytes (Fig. 3). Perilipin-5 antibodies also illuminate a punctate pattern in both WT and fld hepatocytes. Although the identity of the structures marked by perilipin-5 and perilipin-3 is beyond the technical capability of this technique to visualize, based on the biochemical studies below, we believe that these two proteins are soluble in WT mice and may be marking small LDs in fld hepatocytes.
Fig. 3.
Perilipin-2, perilipin-3, and perilipin-5 mark distinct subcellular structures in primary hepatocytes. Images were captured from isolated P14 WT (A, C, E) or fld (B, D, F) hepatocytes fixed and then stained with antibodies directed against perilipin-2, perilipin-3, or perilipin-5. Proteins were then visualized using immunofluorecent microscopy.
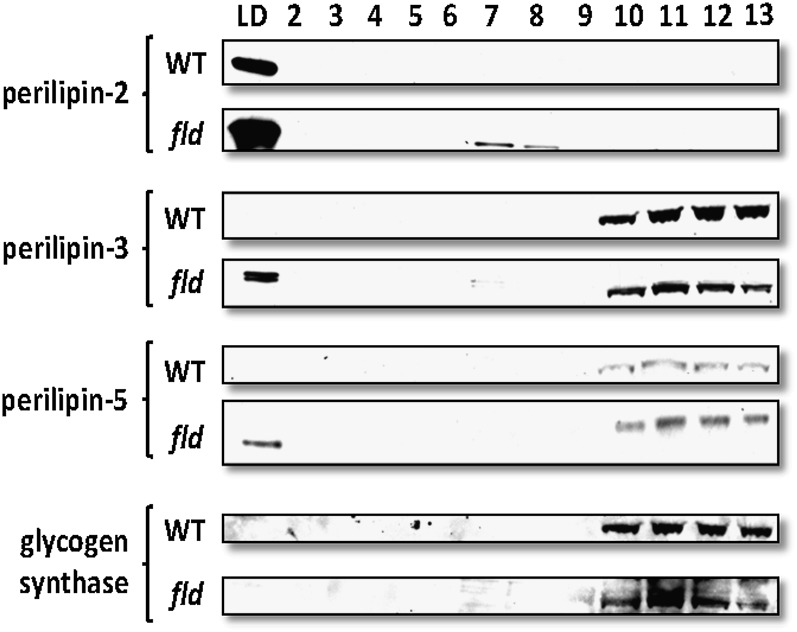
PAT protein localization was confirmed by subcellular fractionation and Western blotting. We subjected fld or WT liver homogenates to sucrose gradient centrifugation and determined the distribution of endogenous PAT proteins across the gradient (Fig. 4). In the WT liver homogenates, perilipin-2 was primarily detected in the LD fraction whereas perilipin-3 and perilipin-5 were detected primarily in the cytosolic fractions, which were marked by glycogen synthase (Fig. 4). Importantly, we also observed redistribution of perilipin-5 and perilipin-3 protein to the LD fraction in fld liver homogenates compared with WT controls. Together with the immunofluorescence data (Fig. 3), these data suggest that perilipin-3 and perilipin-5 proteins are primarily soluble in normal mouse liver, but a significant portion of the protein redistributes to coat small LDs in steatotic liver.
Fig. 4.
Perilipin-2, perilipin-3, and perilipin-5 are associated with lipid droplets in hepatic fractions from fld mice. WT and fld livers were homogenized and fractionated by ultracentrifugation as described in Materials and Methods. Fractions were collected from the top of each sample gradient, with fraction 1 corresponding to floating lipid droplets. Equivalent volumes of each fraction were run on SDS-PAGE so that the protein content of each lane varies. PAT expression was then quantified by Western blotting. Glycogen synthase (GyS) was used a marker for the cytosolic protein fractions.
Cide mRNA expression is increased in fld liver
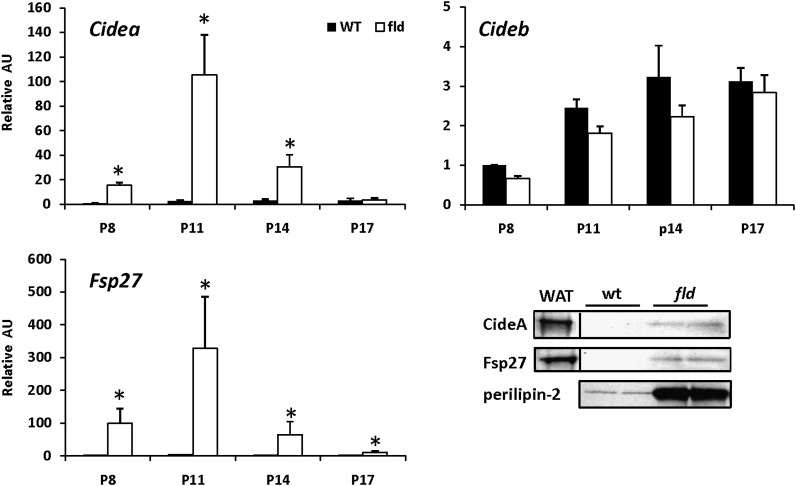
Given emerging evidence that the Cide family of LDPs plays important roles in regulating hepatic fat metabolism, we also examined the expression of this family of genes. Cidea and Fsp27 were strongly induced in fld livers at P8, P11, and P14 but then declined to control levels at P17 (Fig. 5). Cideb expression was unchanged between WT and fld livers (Fig. 5). These data parallel observed increases in Cidea and Fsp27 expression in ob/ob liver (supplementary Fig. I). Western blotting analyses using antibodies against CideA and Fsp27 and lysates from LD fractions from P8 WT and fld mice demonstrated that changes in Cide mRNA levels were accompanied by coordinate increases in protein levels.
Fig. 5.
The expression of CIDE genes is markedly induced in liver of fld mice. Graphs depict results of RT-PCR analyses to quantify mRNA levels of CideA, CideB, and Fsp27 using liver RNA isolated from WT and fld mice at indicated postnatal days. Values are normalized (= 1.0) to P8 WT control expression levels. *P < 0.05 versus WT littermates. Representative Western blotting analyses using hepatic protein isolated from lipid droplet fractions from WT and fld mice at P8 and antibodies indicated at left are shown.
PPARγ levels are not increased in fld liver
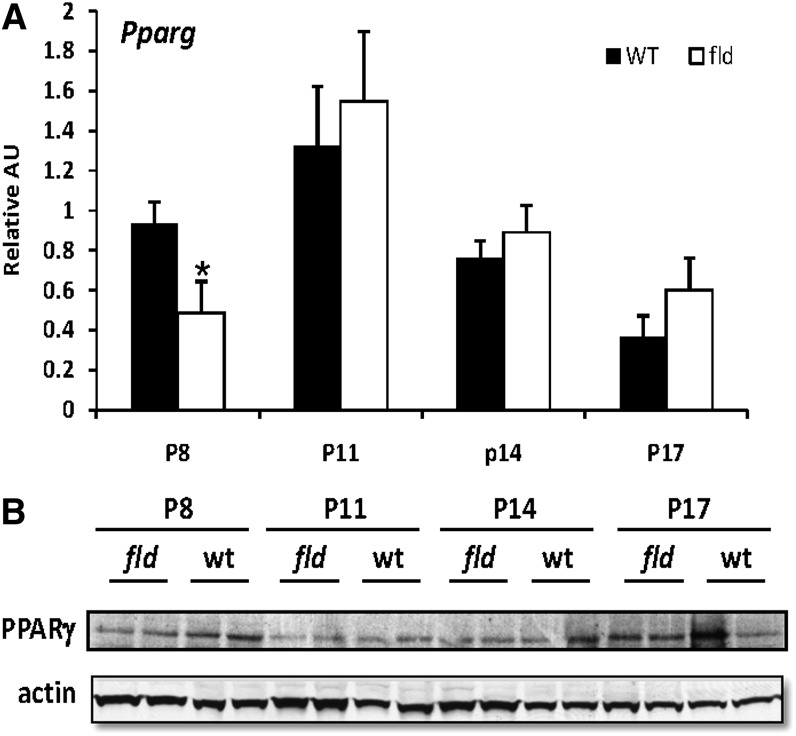
The induction of PPARγ is believed to be a primary driving force in the development of hepatic steatosis as well as the increased expression of perilipin-2 and Cide genes (18). PPARγ is expressed at very low levels in normal liver, but the hepatic expression of this transcription factor is induced in nearly every animal and human model of fatty liver disease examined thus far (36). Interestingly, PPARγ mRNA (Pparg) and protein were not increased in fld mice at any time point and were actually reduced in P8 fld mice compared with littermate controls (Fig. 6). This is a unique feature of fld liver that differentiates it from other fatty liver models.
Fig. 6.
Hepatic PPARγ expression is not induced in fld mice. A: The graph depicts results of RT-PCR analysis to quantify mRNA level of PPARγ using liver RNA isolated from WT and fld mice at indicated postnatal days. Values are normalized to P8 WT control expression levels. *P < 0.05 versus WT littermates. B: Representative Western blotting analysis of PPARγ using hepatic protein isolated from WT and fld mice at indicated postnatal days.
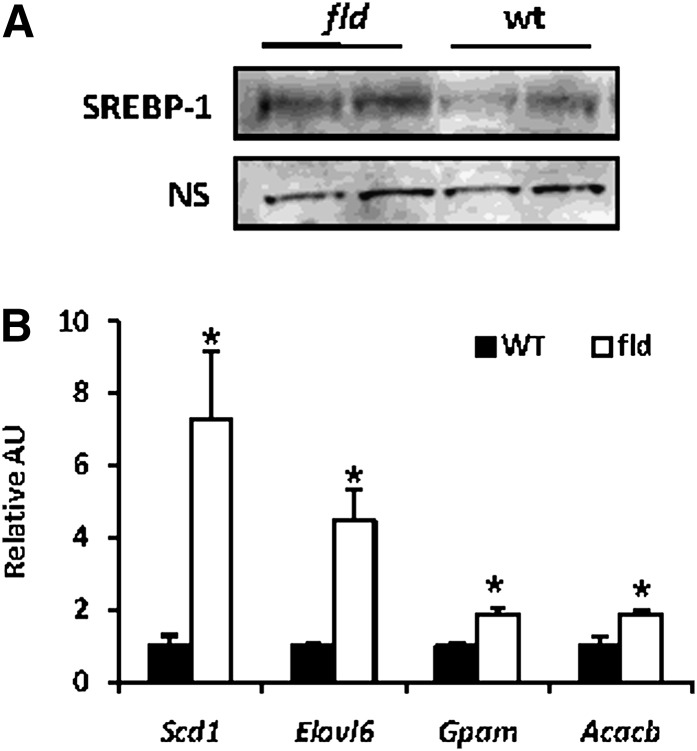
We also evaluated the nuclear content of SREBP-1, which is known to be activated in steatotic liver and to regulate lipogenic gene expression (37). Nuclear content of the active SREBP-1 cleavage product was increased in P8 fld mice (Fig. 7A), suggesting that SREBP-1 is activated in fld mouse liver. Consistent with an activation of SREBP-1, several well-defined SREBP-1 target genes [Scd1, Elovl6, Gpam, Acacb (38)] were increased in P8 fld mice compared with littermate controls (Fig. 7B). Collectively, this evidence supports the idea that SREBP-1 is activated in fld mouse liver.
Fig. 7.
Nuclear content of active SREBP-1 and the expression of SREBP-1-target genes are increased in fld mice. A: Representative Western blotting analysis of cleaved SREBP1 using hepatic nuclear protein preparations from WT and fld mice at postnatal day 8. B: Elevated expression of known SREBP-1 target genes in fld mice. The graph depicts the expression of established SREBP-1 target genes in fld liver (WT normalized to 1.0). *P < 0.05 versus WT control.
Cidea is a direct target gene of SREBP-1
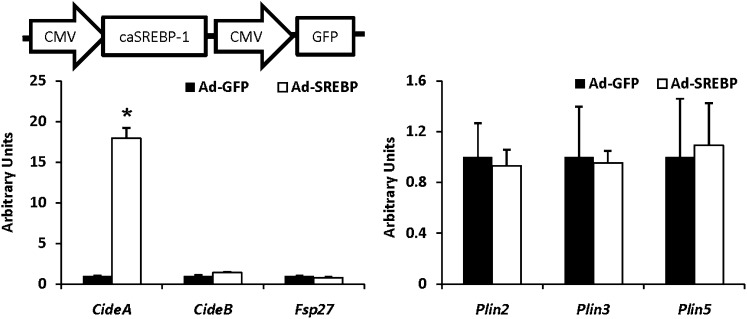
Although SREBP-1 regulates many genes involved in lipid metabolism, to our knowledge, Cide genes have not been identified as SREBP-1 targets. To address this, we overexpressed a constitutively active form of SREBP-1a (26) in WT hepatocytes using an adenovirus and assessed Cide gene expression. Cidea expression was robustly induced, whereas Fsp27 and Cideb were not significantly affected by constitutively-active SREBP-1 (Fig. 8). In addition, expression of Plin2, Plin3, and Plin5 were not induced by SREBP-1 (Fig. 8).
Fig. 8.
Forced-expression of SREBP-1 leads to increased expression of CideA. Hepatocytes isolated from adult WT mice were infected with adenovirus expressing a constitutively active form of SREBP-1a (Ad-caSREBP-1) or control adenovirus expressing green fluorescent protein (GFP). The graph depicts the results of quantitative RT-PCR analyses of Cide and Plin family genes. *P < 0.05 versus GFP control.
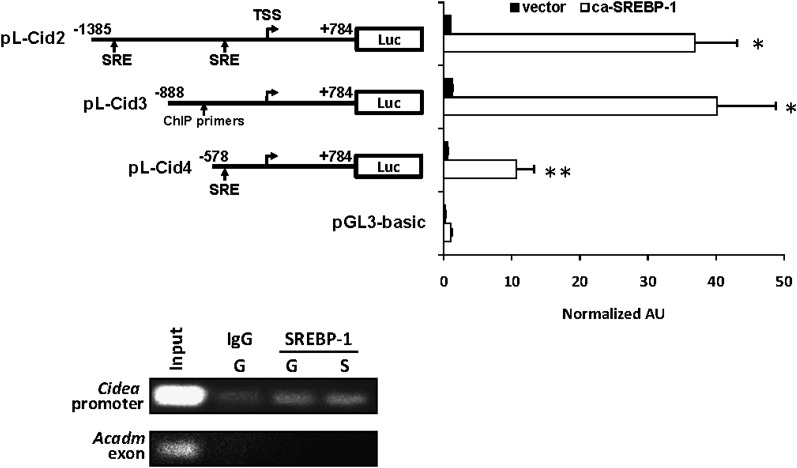
To determine whether SREBP-1 directly regulates Cidea transcription, a series of Cidea promoter-luciferase reporter constructs (29) was transfected into 293 cells, which are virtually null for SREBP-1, with a caSREBP-1 expression construct. As predicted, SREBP-1a overexpression induced Cidea promoter activity more than 30-fold in 293 cells (Fig. 9). A deletion series of Cidea promoter constructs was used to map the SREBP1-responsive regions of the Cidea promoter. Loss of nucleotides -888 to -578 relative to the transcriptional start site significantly blunted the SREBP-1 response. However, the previously defined minimal promoter remained responsive to SREBP-1 and was activated 10-fold. This is consistent with the presence of a canonical SREBP-1 response element (SRE) in this region. Congruent with this, ChIP studies demonstrated that endogenous SREBP-1 protein was directly associated with chromatin in the Cidea promoter (Fig. 9). Collectively, these data identify Cidea as a direct target of SREBP-1 signaling.
Fig. 9.
SREBP-1 directly activates Cidea gene transcription. Graphs represent mean (± SEM) luciferase activity in relative luciferase units (RLU) corrected for renilla luciferase activity and normalized (=1.0) to the value of empty expression vector-transfected cells. The results of studies using 293 cells cotransfected with a deletion series of Cidea promoter-luciferase reporter constructs and expression vectors driving expression of ca-SREBP-1 or empty vector control. Schematics of the various reporter constructs are shown at left. The location of canonical SREBP-1 response elements is denoted (SRE). TSS, transcriptional start site. * P<0.05 versus the value of empty vector control. ** P<0.05 versus caSREBP-1-stimulated pCID2 and pCID3. The images depict the results of chromatin immunoprecipitation (ChIP) studies using chromatin from hepatocytes isolated from WT mice infected with adenovirus to overexpress caSREBP-1 (abbreviated “S”) and/or GFP (abbreviated “G”). Crosslinked proteins were immunoprecipitated with SREBP-1 antibody or IgG control. Input represents 0.2% of the total chromatin used in the IP reactions. Primers specific for the Cidea promoter (The general annealing site of primers used is shown in A) or an exon of Acadm (negative control) were used to detect immunoprecipitated DNA.
DISCUSSION
The profile of proteins that coat LDs plays important roles in regulating LD formation, morphology, and lipolysis. Herein, we characterized the expression of LDP in fld mice; a unique model of lipodystrophy-related fatty liver that spontaneously and rapidly resolves. A loss of function mutation in the gene encoding lipin 1 causes the conspicuous hepatic steatosis and global metabolic abnormalities of fld mice (20, 21). The physiologic mechanisms whereby lipin 1 deficiency causes hepatic steatosis are still unclear, but the molecular functions of lipin 1 provide some possible explanations. Lipin 1 acts in the nucleus to coactivate PPARα to stimulate expression of genes involved in fatty acid oxidation (27). Steatotic hepatocytes from fld mice exhibit diminished rates of fatty acid catabolism (39) and mitochondrial dysfunction (our unpublished observations), suggesting that insufficient capacity for fatty acid oxidation leads to lipid accretion. Interestingly, the microvesicular pattern of LD partitioning observed in fld mice is consistent with microvesicular steatosis caused by pharmacological inhibitors of fatty acid oxidation (40) or inborn errors in mitochondrial metabolism (41). In contrast, obesity-related hepatic steatosis is usually characterized by macrovesicular fat droplets. Thus, the microvesicular morphology of the LD may be another indication of severe defects in hepatic fatty acid oxidation and/or mitochondrial dysfunction in fld liver that result in hepatic steatosis.
On the other hand, the lack of adipose tissue (lipodystrophy) is also likely to play a role in the development of hepatic steatosis in these mice. Most models of lipodystrophy are accompanied by hepatic steatosis (reviewed in ref. 42) probably because there is insufficient capacity to store TG in adipose tissue, which increases the flux of fatty acids to the liver. Lipin 1 is a bi-functional protein that also catalyzes a key step in TG synthesis [phosphatidate phosphohydrolase (43)]. Fld mice completely lack Mg2+-dependent phosphatidate phosphohydrolase activity in adipose tissue (44) leading to a failure of adipocytes to differentiate and store TG (45). It is our opinion that the hepatic steatosis in fld mice is a product of both the hepatic oxidative insufficiency and lipodystrophy, which synergize to cause severe hepatic steatosis. The explanation for the recovery remains unclear. Because lipodystrophy is a lifelong aspect of the fld mouse, the resolution suggests compensatory changes in liver metabolism. A developmental and adaptive normalization of oxidative capacity (our unpublished observations) or increased VLDL triglyceride export (28) could explain the resolution of the neonatal fatty liver. However, additional mouse models are needed to probe this idea further and to understand the sudden, predictable, and apparently genetically-programmed resolution of the fatty liver in this model.
The fld mouse model is also unique in that PPARγ levels are not increased as has been reported in nearly every model of obesity- or lipodystrophy-related hepatic steatosis (reviewed in ref. 36). The evidence for a key role for PPARγ in the development of hepatic steatosis and ectopic induction of lipogenic gene expression is extensive. Liver-specific inactivation of PPARγ markedly ameliorates fatty liver in several obesity-related fatty liver models (46, 47) whereas PPARγ overexpression drives hepatic steatosis (“hepatic adiposis”) in normal mice (17, 18, 48). It is believed that this transcription factor plays a primary role in the development of fatty liver by promoting the expression of adipogenic gene expression (17, 48). PPARγ is required for the induction of perilipin-2 (17, 32), Cidea, and Fsp27 (18) expression in ob/ob mice. The lack of increase in PPARγ in fld mice was unexpected and is challenging to explain. As with other forms of microvesicular steatosis, it is possible that the acute nature of fatty liver in fld mice may be insufficient to cause induction of PPARγ. As a caveat to this, because the transcriptional activity of PPARγ is highly dependent on ligand availability, we cannot say with certainty that PPARγ activity is unaffected in fld liver. Indeed, the availability of endogenous ligands for PPARγ, which are lipid derivatives, is probably high.
We also evaluated SREBP-1, which is activated in some steatotic liver models (37), as a potential mediator of lipogenic gene expression in fld liver. We found that the nuclear content of SREBP-1 and the expression of multiple known SREBP-1 target genes was induced in liver of P8 fld mice, which is strong evidence for increased SREBP-1 activity. We show herein that Cidea expression is induced by SREBP-1 via a direct effect of SREBP-1 occupying the Cidea promoter. To our knowledge, Cidea has not previously been identified as a target of SREBP-1 transcriptional control. Based on consensus sequence matching, the original characterization of the Cidea promoter identified two putative canonical SREBP-1 response elements, including a site within the minimal promoter (pL-Cid4) (29). Indeed the pL-Cid4 construct responds 10-fold to SREBP-1 overexpression and this region would be immunoprecipitated in our ChIP studies. The promoter deletion studies also suggest an SREBP-1-responsive region between -888 and -578. However, our searches have not revealed a canonical SREBP-1 response element within this region. Due to the proximity of the canonical site in the minimal promoter, ChIP studies cannot distinguish whether SREBP-1 binds directly to DNA in the -888/-578 region. Nevertheless, our studies indicate that Cidea is a new and direct target of SREBP-1 signaling and future work will be needed to determine the metabolic consequences of SREBP-1-mediated Cidea activation.
Whereas the Cide genes are regulated at the transcriptional level, PAT protein levels were governed by posttranslational mechanisms. Although Plin5 mRNA expression was unchanged, levels of its corresponding protein were increased several-fold in liver of fld mice compared with controls. Perilipin-2 was also upregulated at the level of its mRNA but the increase in its protein levels was significantly greater. Degradation of perilipin proteins can occur by proteosomal and lysosomal pathways (35, 49, 50). In immortalized cell lines, previous work has shown that perilipin-1 and perilipin-2 protein stability is enhanced by the presence of fatty acids and that the increased stability is due to inhibition of ubiquitin-mediated degradation (35, 49). Herein, we demonstrate that perilipin-2 stability is regulated by fat loading in primary hepatocytes and present data that perilipin-5 stability is also subject to regulation by fatty acid availability. This seems to be a key mechanism of regulation and demonstrates the importance of quantifying PAT protein levels, rather than mRNA content, in future studies.
CONCLUSIONS
Our work has shown that the microvesicular hepatic steatosis of fld mice is accompanied by increased levels of several LDPs. These studies also reveal that the PAT and Cide families of LDPs are controlled at different regulatory levels and that the acute hepatic steatosis in fld mice is not accompanied by an increased in PPARγ, a putative master regulator of hepatic steatosis. Further study of the mechanisms that regulate LD levels in steatotic liver, in particular the marked and rapid egress of steatosis, is needed to determine whether targeting these pathways might be a viable treatment for fatty liver disease.
Supplementary Material
Footnotes
Abbreviations:
- Acacb
- acetyl-coenzyme A carboxylase β
- ChIP
- chromatin immunoprecipitation
- Cide
- cell death-inducing DFFA-like effector
- Elovl6
- elongation of very long chain fatty acids-like 6
- fld
- fatty liver dystrophic
- Gpam
- glycerol-3-phosphate acyltransferase, mitochondrial
- LD
- lipid droplet
- LDP
- lipid droplet protein
- OA
- oleic acid
- P14
- postnatal day 14
- PAT
- perilipin-ADRP-TIP47
- PPARγ
- peroxisome proliferator-activated receptor γ
- Scd1
- stearoyl-coenzyme A desaturase 1
- SREBP-1
- sterol-regulatory element binding protein 1
- TG
- triglyceride
- WT
- wild-type
This work was supported by grants from the National Institutes of Health [DK078187 (to B.N.F.), GM23750 (to J.K.R), and DK083163 (to J.K.R)] and the American Diabetes Association 7-06-JF-69 (to N.E.W). A.M.H. is a fellow on National Heart, Lung and Blood Institute Training Grant T32 HL-007275. This work was also supported by the core services of the Digestive Diseases Research Core Center (P30 DK52574) and the Clinical Nutrition Research Unit (P30 DK56341) at Washington University School of Medicine. Its contents are solely the responsibility of the authors and do not necessarily represent the official views of the National Institutes of Health.
The online version of this article (available at http://www.jlr.org) contains supplementary data in the form of one table and one figure.
REFERENCES
- 1.Murphy D. J. 2001. The biogenesis and functions of lipid bodies in animals, plants and microorganisms. Prog. Lipid Res. 40: 325–438. [DOI] [PubMed] [Google Scholar]
- 2.Ducharme N. A., Bickel P. E. 2008. Lipid droplets in lipogenesis and lipolysis. Endocrinology. 149: 942–949. [DOI] [PubMed] [Google Scholar]
- 3.Brasaemle D. L. 2007. Thematic review series: adipocyte biology. The perilipin family of structural lipid droplet proteins: stabilization of lipid droplets and control of lipolysis. J. Lipid Res. 48: 2547–2559. [DOI] [PubMed] [Google Scholar]
- 4.Kimmel A. R., Brasaemle D. L., McAndrews-Hill M., Sztalryd C., Londos C. 2009. Adoption of PERILIPIN as a unifying nomenclature for the mammalian PAT-family of intracellular, lipid storage droplet proteins. J Lipid Res. 51: 468–471. [DOI] [PMC free article] [PubMed] [Google Scholar]
- 5.Wolins N. E., Quaynor B. K., Skinner J. R., Tzekov A., Croce M. A., Gropler M. C., Varma V., Yao-Borengasser A., Rasouli N., Kern P. A., et al. 2006. OXPAT/PAT-1 is a PPAR-induced lipid droplet protein that promotes fatty acid utilization. Diabetes. 55: 3418–3428. [DOI] [PubMed] [Google Scholar]
- 6.Wolins N. E., Quaynor B. K., Skinner J. R., Schoenfish M. J., Tzekov A., Bickel P. E. 2005. S3–12, Adipophilin, and TIP47 package lipid in adipocytes. J. Biol. Chem. 280: 19146–19155. [DOI] [PubMed] [Google Scholar]
- 7.Gong J., Sun Z., Li P. 2009. CIDE proteins and metabolic disorders. Curr. Opin. Lipidol. 20: 121–126. [DOI] [PubMed] [Google Scholar]
- 8.Puri V., Konda S., Ranjit S., Aouadi M., Chawla A., Chouinard M., Chakladar A., Czech M. P. 2007. Fat-specific protein 27, a novel lipid droplet protein that enhances triglyceride storage. J. Biol. Chem. 282: 34213–34218. [DOI] [PubMed] [Google Scholar]
- 9.Puri V., Ranjit S., Konda S., Nicoloro S. M., Straubhaar J., Chawla A., Chouinard M., Lin C., Burkart A., Corvera S., et al. 2008. Cidea is associated with lipid droplets and insulin sensitivity in humans. Proc. Natl. Acad. Sci. USA. 105: 7833–7838. [DOI] [PMC free article] [PubMed] [Google Scholar]
- 10.Subramanian V., Rothenberg A., Gomez C., Cohen A. W., Garcia A., Bhattacharyya S., Shapiro L., Dolios G., Wang R., Lisanti M. P., et al. 2004. Perilipin A mediates the reversible binding of CGI-58 to lipid droplets in 3T3–L1 adipocytes. J. Biol. Chem. 279: 42062–42071. [DOI] [PubMed] [Google Scholar]
- 11.Brasaemle D. L., Rubin B., Harten I. A., Gruia-Gray J., Kimmel A. R., Londos C. 2000. Perilipin A increases triacylglycerol storage by decreasing the rate of triacylglycerol hydrolysis. J. Biol. Chem. 275: 38486–38493. [DOI] [PubMed] [Google Scholar]
- 12.Sztalryd C., Xu G., Dorward H., Tansey J. T., Contreras J. A., Kimmel A. R., Londos C. 2003. Perilipin A is essential for the translocation of hormone-sensitive lipase during lipolytic activation. J. Cell Biol. 161: 1093–1103. [DOI] [PMC free article] [PubMed] [Google Scholar]
- 13.Martinez-Botas J., Anderson J. B., Tessier D., Lapillonne A., Chang B. H., Quast M. J., Gorenstein D., Chen K. H., Chan L. 2000. Absence of perilipin results in leanness and reverses obesity in Lepr(db/db) mice. Nat. Genet. 26: 474–479. [DOI] [PubMed] [Google Scholar]
- 14.Nishino N., Tamori Y., Tateya S., Kawaguchi T., Shibakusa T., Mizunoya W., Inoue K., Kitazawa R., Kitazawa S., Matsuki Y., et al. 2008. FSP27 contributes to efficient energy storage in murine white adipocytes by promoting the formation of unilocular lipid droplets. J. Clin. Invest. 118: 2808–2821. [DOI] [PMC free article] [PubMed] [Google Scholar]
- 15.Chang B. H., Li L., Paul A., Taniguchi S., Nannegari V., Heird W. C., Chan L. 2006. Protection against fatty liver but normal adipogenesis in mice lacking adipose differentiation-related protein. Mol. Cell. Biol. 26: 1063–1076. [DOI] [PMC free article] [PubMed] [Google Scholar]
- 16.Motomura W., Inoue M., Ohtake T., Takahashi N., Nagamine M., Tanno S., Kohgo Y., Okumura T. 2006. Up-regulation of ADRP in fatty liver in human and liver steatosis in mice fed with high fat diet. Biochem. Biophys. Res. Commun. 340: 1111–1118. [DOI] [PubMed] [Google Scholar]
- 17.Schadinger S. E., Bucher N. L., Schreiber B. M., Farmer S. R. 2005. PPARgamma2 regulates lipogenesis and lipid accumulation in steatotic hepatocytes. Am. J. Physiol. Endocrinol. Metab. 288: E1195–E1205. [DOI] [PubMed] [Google Scholar]
- 18.Matsusue K., Kusakabe T., Noguchi T., Takiguchi S., Suzuki T., Yamano S., Gonzalez F. J. 2008. Hepatic steatosis in leptin-deficient mice is promoted by the PPARgamma target gene Fsp27. Cell Metab. 7: 302–311. [DOI] [PMC free article] [PubMed] [Google Scholar]
- 19.Li J. Z., Ye J., Xue B., Qi J., Zhang J., Zhou Z., Li Q., Wen Z., Li P. 2007. Cideb regulates diet-induced obesity, liver steatosis, and insulin sensitivity by controlling lipogenesis and fatty acid oxidation. Diabetes. 56: 2523–2532. [DOI] [PubMed] [Google Scholar]
- 20.Langner C. A., Birkenmeier E. H., Ben-Zeev O., Schotz M. C., Sweet H. O., Davisson M. T., Gordon J. I. 1989. The fatty liver dystrophy (fld) mutation. A new mutant mouse with a developmental abnormality in triglyceride metabolism and associated tissue-specific defects in lipoprotein lipase and hepatic lipase activities. J. Biol. Chem. 264: 7994–8003. [PubMed] [Google Scholar]
- 21.Peterfy M., Phan J., Xu P., Reue K. 2001. Lipodystrophy in the fld mouse results from mutation of a new gene encoding a nuclear protein, lipin. Nat. Genet. 27: 121–124. [DOI] [PubMed] [Google Scholar]
- 22.Schwartz D. M., Wolins N. E. 2007. A simple and rapid method to assay triacylglycerol in cells and tissues. J. Lipid Res. 48: 2514–2520. [DOI] [PubMed] [Google Scholar]
- 23.Brasaemle D. L., Wolins N. E. 2006. Isolation of lipid droplets from cells by density gradient centrifugation. Curr. Protoc. Cell Biol. Chapter 3: Unit 3. 15. [DOI] [PubMed] [Google Scholar]
- 24.Chen Z., Fitzgerald R. L., Averna M. R., Schonfeld G. 2000. A targeted apolipoprotein B-38.9-producing mutation causes fatty livers in mice due to the reduced ability of apolipoprotein B-38.9 to transport triglycerides. J. Biol. Chem. 275: 32807–32815. [DOI] [PubMed] [Google Scholar]
- 25.Wolins N. E., Skinner J. R., Schoenfish M. J., Tzekov A., Bensch K. G., Bickel P. E. 2003. Adipocyte protein S3–12 coats nascent lipid droplets. J. Biol. Chem. 278: 37713–37721. [DOI] [PubMed] [Google Scholar]
- 26.Shimano H., Horton J. D., Hammer R. E., Shimomura I., Brown M. S., Goldstein J. L. 1996. Overproduction of cholesterol and fatty acids causes massive liver enlargement in transgenic mice expressing truncated SREBP-1a. J. Clin. Invest. 98: 1575–1584. [DOI] [PMC free article] [PubMed] [Google Scholar]
- 27.Finck B. N., Gropler M. C., Chen Z., Leone T. C., Croce M. A., Harris T. E., Lawrence J. C., Jr., Kelly D. P. 2006. Lipin 1 is an inducible amplifier of the hepatic PGC-1alpha/PPARalpha regulatory pathway. Cell Metab. 4: 199–210. [DOI] [PubMed] [Google Scholar]
- 28.Chen Z., Gropler M. C., Norris J., Lawrence J. C., Jr., Harris T. E., Finck B. N. 2008. Alterations in hepatic metabolism in fld mice reveal a role for lipin 1 in regulating VLDL-triacylglyceride secretion. Arterioscler. Thromb. Vasc. Biol. 28: 1738–1744. [DOI] [PMC free article] [PubMed] [Google Scholar]
- 29.Viswakarma N., Yu S., Naik S., Kashireddy P., Matsumoto K., Sarkar J., Surapureddi S., Jia Y., Rao M. S., Reddy J. K. 2007. Transcriptional regulation of Cidea, mitochondrial cell death-inducing DNA fragmentation factor alpha-like effector A, in mouse liver by peroxisome proliferator-activated receptor alpha and gamma. J. Biol. Chem. 282: 18613–18624. [DOI] [PubMed] [Google Scholar]
- 30.Dongol B., Shah Y., Kim I., Gonzalez F. J., Hunt M. C. 2007. The acyl-CoA thioesterase I is regulated by PPARalpha and HNF4alpha via a distal response element in the promoter. J. Lipid Res. 48: 1781–1791. [DOI] [PubMed] [Google Scholar]
- 31.Bell M., Wang H., Chen H., McLenithan J. C., Gong D. W., Yang R. Z., Yu D., Fried S. K., Quon M. J., Londos C., et al. 2008. Consequences of lipid droplet coat protein downregulation in liver cells: abnormal lipid droplet metabolism and induction of insulin resistance. Diabetes. 57: 2037–2045. [DOI] [PMC free article] [PubMed] [Google Scholar]
- 32.Imai Y., Varela G. M., Jackson M. B., Graham M. J., Crooke R. M., Ahima R. S. 2007. Reduction of hepatosteatosis and lipid levels by an adipose differentiation-related protein antisense oligonucleotide. Gastroenterology. 132: 1947–1954. [DOI] [PubMed] [Google Scholar]
- 33.Straub B. K., Stoeffel P., Heid H., Zimbelmann R., Schirmacher P. 2008. Differential pattern of lipid droplet-associated proteins and de novo perilipin expression in hepatocyte steatogenesis. Hepatology. 47: 1936–1946. [DOI] [PubMed] [Google Scholar]
- 34.Brasaemle D. L., Barber T., Kimmel A. R., Londos C. 1997. Post-translational regulation of perilipin expression. Stabilization by stored intracellular neutral lipids. J. Biol. Chem. 272: 9378–9387. [DOI] [PubMed] [Google Scholar]
- 35.Xu G., Sztalryd C., Londos C. 2006. Degradation of perilipin is mediated through ubiquitination-proteasome pathway. Biochim. Biophys. Acta. 1761: 83–90. [DOI] [PubMed] [Google Scholar]
- 36.Boelsterli U. A., Bedoucha M. 2002. Toxicological consequences of altered peroxisome proliferator-activated receptor gamma (PPARgamma) expression in the liver: insights from models of obesity and type 2 diabetes. Biochem. Pharmacol. 63: 1–10. [DOI] [PubMed] [Google Scholar]
- 37.Shimomura I., Bashmakov Y., Horton J. D. 1999. Increased levels of nuclear SREBP-1c associated with fatty livers in two mouse models of diabetes mellitus. J. Biol. Chem. 274: 30028–30032. [DOI] [PubMed] [Google Scholar]
- 38.Horton J. D., Shah N. A., Warrington J. A., Anderson N. N., Park S. W., Brown M. S., Goldstein J. L. 2003. Combined analysis of oligonucleotide microarray data from transgenic and knockout mice identifies direct SREBP target genes. Proc. Natl. Acad. Sci. USA. 100: 12027–12032. [DOI] [PMC free article] [PubMed] [Google Scholar]
- 39.Rehnmark S., Giometti C. S., Slavin B. G., Doolittle M. H., Reue K. 1998. The fatty liver dystrophy mutant mouse: microvesicular steatosis associated with altered expression levels of peroxisome proliferator-regulated proteins. J. Lipid Res. 39: 2209–2217. [PubMed] [Google Scholar]
- 40.van der Leij F. R., Bloks V. W., Grefhorst A., Hoekstra J., Gerding A., Kooi K., Gerbens F., te Meerman G., Kuipers F. 2007. Gene expression profiling in livers of mice after acute inhibition of beta-oxidation. Genomics. 90: 680–689. [DOI] [PubMed] [Google Scholar]
- 41.Fromenty B., Pessayre D. 1995. Inhibition of mitochondrial beta-oxidation as a mechanism of hepatotoxicity. Pharmacol. Ther. 67: 101–154. [DOI] [PubMed] [Google Scholar]
- 42.Asterholm I. W., Halberg N., Scherer P. E. 2007. Mouse models of lipodystrophy key reagents for the understanding of the metabolic syndrome. Drug Discov. Today Dis. Models. 4: 17–24. [DOI] [PMC free article] [PubMed] [Google Scholar]
- 43.O'Hara L., Han G. S., Peak-Chew S., Grimsey N., Carman G. M., Siniossoglou S. 2006. Control of phospholipid synthesis by phosphorylation of the yeast lipin Pah1p/Smp2p Mg2+-dependent phosphatidate phosphatase. J. Biol. Chem. 281: 34537–34548. [DOI] [PMC free article] [PubMed] [Google Scholar]
- 44.Harris T. E., Huffman T. A., Chi A., Shabanowitz J., Hunt D. F., Kumar A., Lawrence J. C., Jr. 2007. Insulin controls subcellular localization and multisite phosphorylation of the phosphatidic acid phosphatase, lipin 1. J. Biol. Chem. 282: 277–286. [DOI] [PubMed] [Google Scholar]
- 45.Phan J., Peterfy M., Reue K. 2004. Lipin expression preceding peroxisome proliferator-activated receptor-gamma is critical for adipogenesis in vivo and in vitro. J. Biol. Chem. 279: 29558–29564. [DOI] [PubMed] [Google Scholar]
- 46.Gavrilova O., Haluzik M., Matsusue K., Cutson J. J., Johnson L., Dietz K. R., Nicol C. J., Vinson C., Gonzalez F. J., Reitman M. L. 2003. Liver peroxisome proliferator-activated receptor gamma contributes to hepatic steatosis, triglyceride clearance, and regulation of body fat mass. J. Biol. Chem. 278: 34268–34276. [DOI] [PubMed] [Google Scholar]
- 47.Matsusue K., Haluzik M., Lambert G., Yim S. H., Gavrilova O., Ward J. M., Brewer B., Jr., Reitman M. L., Gonzalez F. J. 2003. Liver-specific disruption of PPARgamma in leptin-deficient mice improves fatty liver but aggravates diabetic phenotypes. J. Clin. Invest. 111: 737–747. [DOI] [PMC free article] [PubMed] [Google Scholar]
- 48.Yu S., Matsusue K., Kashireddy P., Cao W. Q., Yeldandi V., Yeldandi A. V., Rao M. S., Gonzalez F. J., Reddy J. K. 2003. Adipocyte-specific gene expression and adipogenic steatosis in the mouse liver due to peroxisome proliferator-activated receptor gamma1 (PPARgamma1) overexpression. J. Biol. Chem. 278: 498–505. [DOI] [PubMed] [Google Scholar]
- 49.Xu G., Sztalryd C., Lu X., Tansey J. T., Gan J., Dorward H., Kimmel A. R., Londos C. 2005. Post-translational regulation of adipose differentiation-related protein by the ubiquitin/proteasome pathway. J. Biol. Chem. 280: 42841–42847. [DOI] [PubMed] [Google Scholar]
- 50.Kovsan J., Ben-Romano R., Souza S. C., Greenberg A. S., Rudich A. 2007. Regulation of adipocyte lipolysis by degradation of the perilipin protein: nelfinavir enhances lysosome-mediated perilipin proteolysis. J. Biol. Chem. 282: 21704–21711. [DOI] [PubMed] [Google Scholar]
Associated Data
This section collects any data citations, data availability statements, or supplementary materials included in this article.


