

Abstract
Optical spectroscopy and imaging approaches offer the potential to noninvasively assess different aspects of the cellular, extracellular matrix, and scaffold components of engineered tissues. In addition, the combination of multiple imaging modalities within a single instrument is highly feasible, allowing acquisition of complementary information related to the structure, organization, biochemistry, and physiology of the sample. The ability to characterize and monitor the dynamic interactions that take place as engineered tissues develop promises to enhance our understanding of the interdependence of processes that ultimately leads to functional tissue outcomes. It is expected that this information will impact significantly upon our abilities to optimize the design of biomaterial scaffolds, bioreactors, and cell systems. Here, we review the principles and performance characteristics of the main methodologies that have been exploited thus far, and we present examples of corresponding tissue engineering studies.
Introduction
The dynamic interactions between cells, the supporting matrix, and the environment often dictate the fate of a tissue, independent of whether this tissue is within a human, an animal, or a bioreactor. Understanding and exploiting these interactions is crucial for optimizing tissue engineering efforts aiming ultimately to develop tissues that will be used to replace damaged tissues or organs, to model disease processes, or to test new drugs.1 Traditionally, the cell and matrix components of engineered tissues are assessed using methods that are either invasive or render the samples nonviable. This limits the frequency with which observations are made and prevents monitoring of dynamic changes that occur within a given specimen. The development of noninvasive, optical modalities to image the cellular and matrix components of engineered tissues is expected to overcome such limitations and enable improved understanding and strategies for functional tissue development.2
A number of optical techniques have been developed and used for disease detection and characterization in systems varying in complexity from cell monolayers to animals and humans. Some of these techniques rely entirely on endogenous sources of optical contrast, while others fully exploit traditional and novel contrast agents designed to enhance the level of detected signal or the specificity and sensitivity of the measurement. The main advantages of optical methods include the potential for very high spatial resolution (sufficient for imaging subcellular features), the capability to provide results in real time, and the ability to combine spectroscopy and imaging or multiple modalities in order to assess complementary aspects of the structure, morphology, biochemistry, and/or physiology of the sample. Since the approaches are noninvasive, this information is in principle extracted without interfering with the sample's physiology and without the potential of introducing artifacts. All of these features are also very desirable for characterizing engineered tissues.
Here, we will present an introductory overview of the different optical methods that are currently being explored in the context of tissue engineering, with a particular emphasis on approaches that rely on intrinsic sources of contrast (Table 1). We will discuss their principles of operation, advantages and limitations, as well as their prospects for further use, especially as the field of tissue engineering advances to more extensive in vivo testing.
Table 1.
Comparison of Optical Imaging and Spectroscopy Systems for Engineered Tissue Characterization
| Optical system | Resolution/size sensitivity | Penetration depth | Sources of contrast: information | Advantages | Limitations | Cost |
|---|---|---|---|---|---|---|
| Fluorescence spectroscopy | Probe and λ dependent (100s μm typical) | Probe and λ dependent (100s μm to few mm typical) | • Endogenous cellular fluorophores: cell biochemical, metabolic, differentiation status • Structural proteins: bulk matrix deposition, integrity, organization, remodeling • Exogenous labels: protein expression, cell lineage • Scaffolds, biomaterials: biomaterial status |
• Simple implementation • Quantitative information on composition • Can be molecularly specific • Portable |
• Low spatial resolution • Broad featureless spectra |
Low |
| Elastic light scattering spectroscopy | Probe dependent (100s μm typical) | Probe and λ dependent (100s μm to few mm typical) | • Cellular organelles and membranes: cell structure, organelle packing • Collagen fibers: density/remodeling • Biomaterials, scaffolds: scaffold integrity |
• Simple to implement • Portable |
• Low spatial resolution • Not imaging based • Not molecularly specific |
Low |
| Raman spectroscopy | Probe and system dependent (few μm to 100 μm) | Probe and λ dependent | Molecular bonds: biochemical composition, molecular structure | Molecular specificity | • Weak signal • Carefully designed fibers and/or detector required |
Moderate |
| Confocal microscopy | Lateral: 0.5 μm or larger Axial: 1 μm or larger Both NA and λ dependent |
10s μm to 300 μm | (Reflectance) • Collagen fibers, biomaterial scaffolds: detailed matrix morphology, organization, remodeling (Fluorescence) • Exogenous chromophores, FAD, collagen: cell presence, matrix morphology, blood flow/vascularization |
• Depth-resolved imaging • Repeated monitoring possible |
• Complex design • Limited depth resolution • Significant photobleaching • Cells usually visible with exogenous labels only |
Moderate to high |
| MPM | Lateral: 0.5 μm or larger Axial: 1 μm or larger Both NA/λ dependent |
100s μm to 1000 μm | • Endogenous cellular fluorophores: cell biochemistry, metabolism, organization • Elastin, collagen: matrix integrity, remodeling • Exogenous labels: molecular composition |
• High resolution • Reduced out-of-focus photobleaching • Efficient signal detection (no pinhole) • Biochemical and morphological information |
• High power density at focus • Not easily portable • Incompatible with traditional optical fiber delivery |
High |
| SHG | Lateral: 0.5 μm or larger Axial: 1 μm or larger Both NA and λ dependent |
100s μm to 1000 μm | Noncentrosymmetric structures: with polarization, alignment of structures. See Table 4. | • No photodamage • Efficient signal detection (no pinhole) |
Highly directional | High |
| OCT | Axial: 3–15 μm (5–15 μm typical)Lateral: 1–15 μm (10–15 μm typical) | Up to 2–3 mm | • Changes in refractive index: matrix and scaffold remodeling • (Polarization mode) • birefringent molecules such as collagen: structure, orientation • (Doppler mode) moving/ flowing components: vascularization, perfusion |
• Fast data acquisition • High depth penetration • Portable • Several commercial systems available |
• Not ideal for visualizing cells (for systems with typical resolution) • Morphological but not biochemical information |
Moderate |
Light–Matter Interactions
When light falls onto a material sample, there is a small number of distinct interactions that typically take place. The nature of these interactions depends upon the wavelength of light and the structure and composition of the material. Here, we will focus on processes that occur at wavelengths in the 300–900 nm range, spanning the near-ultraviolet (UV), visible, and near infrared (NIR) regions of the spectrum. In this range, it is the electronic structure of matter that is most relevant, since it is predominantly the electrons that interact with these electromagnetic waves. Specifically, when light interacts with a sample, the most probable events involve the processes of scattering, absorption, and luminescence, depicted schematically from an energy point of view in Figure 1.
FIG. 1.

Energy-level representation of light–matter interactions. (A) Elastic scattering; (B) inelastic Raman scattering; (C) absorption and nonradiative decay; (D) absorption and luminescence.
The most likely interaction between light and matter is scattering. The incident electromagnetic waves induce oscillations in the electrons of the sample at a frequency that matches the frequency of the wave. These oscillating electrons (i.e., electric dipoles) radiate waves, usually at the same frequency as that of the incident light. In that case, we have elastic scattering since there is no difference in the energy of the incident and scattered light (Fig. 1A). Scattered photons from nearby electrons of the sample can interfere, and the overall intensity pattern of scattered light that has undergone a single, or very few scattering events, varies as a function of wavelength and scattering angle in a manner that depends on the size, shape, organization, and refractive index of the scattering particle (the refractive index of a sample represents how much a light wave slows down when it travels through the sample as compared to its speed in vacuum). Thus, when elastic light scattering is used as a source of contrast, intensity variations can be measured and modeled in order to extract quantitative information about the detailed morphology of the scatterers within a sample. This spectroscopic approach has been shown to be sensitive to changes in size that are as small as 20 nm, that is, far below the diffraction limit!3 Scattering centers are structures that have a different refractive index than their surroundings. Membrane-rich organelles, such as the endoplasmic reticulum and mitochondria, lysosomes, and the nucleus are some examples of cell structures that scatter light. Collagen fibers also contribute significantly to tissue scattering. Since protein complexes and organelles spanning a wide range of sizes are tightly packed within a cell, light scattering–based approaches have been developed to extract information about the packing and organization of cell and matrix components for scales that vary from 20 nm to tens of microns.3–6
It is also possible that as the electrons of a molecule oscillate in response to their interactions with incident light waves, the vibrational state of the molecule changes; that is, the nucleus is displaced with respect to the electron cloud. These displacements represent distinct energy levels that are referred to as vibrational energy states. If the molecule is induced to occupy a different vibrational state, then this change is reflected as a small characteristic shift in the frequency of the scattered light, representing the energy loss (most likely) or gain that resulted from the change in the vibrational state of the molecule. This shift is referred to as a Raman shift, and this type of scattering is known as Raman or inelastic scattering (Fig. 1B). Thus, examination of Raman spectra can reveal the presence of distinct molecular bonds and in some cases, as in polarized Raman spectroscopy, their orientation. Raman peaks at distinct wavelengths exist, for example, for different types of carbon–carbon bonds, amide, carboxyl, sulfhydryl, and phenol groups, while in more complex samples, Raman peaks could be characteristic of entire molecules, such as carotenoids, glucose, and hydroxyapatite (HA). This process is usually several orders of magnitude weaker than elastic scattering, which makes its detection more challenging.
If the energy of the incident photons matches the energy required to change the electron distribution of a molecule from the ground state configuration (which represents the lowest energy state) to a different (excited) configuration, then absorption can occur (Fig. 1C). Main absorbers in the wavelength range of interest typically consist of rings and long chains of conjugated bonds. Electrons tend to delocalize along these chains of interchanging single and double carbon bonds and given the right energy it becomes likely to induce, for example, a π molecular orbital from a bonding (ground state) to a nonbonding (excited state) conformation. Hemoglobin (in blood), melanin (in skin), and β-carotene (in fatty tissues) are some of the main natural absorbers in human tissues.
Once a molecule gets excited following absorption, it will most likely relax to its initial (ground) state within a nanosecond or faster. The energy that is released during this relaxation process often gets converted to heat (nonradiative decay). Alternatively, some molecules reemit light, generally referred to as luminescence. Depending on whether the excited molecule relaxes to its ground state from an excited singlet or triplet state, this luminescence is more specifically referred to as fluorescence or phosphorescence, respectively (Fig. 1D). This reemitted light has lower energy and, therefore, longer wavelength than the incident light, because there are always some small energy losses during the relaxation process (remember that E = hν = hc/λ, where E is energy, h is Planck's constant, ν is frequency, c is the speed of light, and λ is the wavelength). Thus, fluorescence photons can be distinguished from the incident or scattered photons using standard bandpass filters, that is, filters that allow transmission only within a given wavelength range. There are a number of cell and tissue chromaphores that naturally emit light, and their optimal excitation and emission wavelengths are included in Table 2.
Table 2.
Intrinsic Fluorophores
| Endogenous chromophores | Single-photon excitation [λmax (nm)] | Single-photon emission [λmax (nm)] | Two-photon excitation [λmax (nm)] | Two-photon emission [λmax (nm)] | Single-photon cross section (cm2 s)/photon | Two-photon cross section (cm4 s)/photon |
|---|---|---|---|---|---|---|
| FAD | 375,84 45084 | 52084 | 73084 | 52584 | 1.29 × 10⁻²¹ (85,86)a | 8.55 × 10−52(84) |
| Flavins | 375,86 45086 | 520–55086 | 700–73087 | 52587 | 1.29 × 10⁻²⁰a | 1–8 × 10−52 (87) |
| NADH | 35088 | 45088 | 690–73088 | 45088 | 4.5 × 10⁻²² (89,90)a | 9 × 10−52 (87) |
| Tyrosine | 28391 | 30591 | 566–70087,91 | 30591 | 5.35 × 10⁻²²(90)a | 1 × 10−84(3PE)87 |
| Tryptophan | 28090 | 35090 | 1.86 × 10⁻²¹(90)a | 1 × 10−84(3PE)87 | ||
| Retinol | 325 | 400 | 700–83088 | 49088 | 4.76 × 10⁻²¹(92,93)a | 7 × 10−52(87) |
| Collagen type I | 280–32094,b | 350–42094,b | 730–800 (SHG strongest)87 | 44058 | ||
| 400 (SHG)87,b | ||||||
| Elastin | 300–34095 | 420–460 | 730–80059 | 420–46059 | ||
| 49558 |
Calculated value.
Emission varies with excitation λ.
In a highly scattering specimen, such as tissue, that is several millimeters to centimeters thick, a significant fraction of the light that we detect is typically in the backscattering direction, that is, at the same side as the side of light incidence (Fig. 2). Over 95% of this backscattered light undergoes several scattering events within the specimen before it is detected. Because the size, shape, and refractive index of potential scatterers within tissue can vary by orders of magnitude, this multiply scattered light no longer carries detailed structural information about the individual scatterers. However, the wavelength dependence of the multiply scattered light (referred to as an elastic scattering or diffuse reflectance spectrum) can be analyzed using light propagation models based on diffusion or Monte Carlo methods, to extract information about the bulk scattering and absorption properties of the specimen.7 The scattering coefficient can be related, for example, to the overall density of scatterers, while the absorption coefficient is highly dependent on the blood content and oxygenation status of the specimen.
FIG. 2.

Light–tissue interactions. When light interacts with matter, it can undergo the processes of scattering, absorption, and luminescence.
These three types of light–matter interactions, namely scattering, absorption, and luminescence, depicted schematically in Figure 2, represent the main mechanisms of contrast for optical spectroscopy and imaging modalities. Spectroscopic measurements are usually performed with low spatial resolution but have higher sensitivity to the structural, molecular, and biochemical aspects of the specimen. Imaging approaches confer spatial resolution, but are typically performed over a limited number of wavelengths and can thus provide less specific information with respect to the identity of the specimen's composition. The combination of spectral and imaging modalities overcomes this limitation. Also, exogenous chromophores are often employed that are designed to label very specific tissue features. Since most engineered tissue specimens extend from hundreds of microns to a few millimeters, it is not possible to use traditional microscopic approaches, such as brightfield, differential interference contrast, and fluorescence, to acquire high-resolution images; the out-of-focus light blurs and degrades the images. Thus, following a discussion of spectroscopic measurements and their application to tissue engineering, we will focus on techniques that have been developed specifically for high-resolution imaging of thick specimens, that is, techniques that provide optical sectioning. A summary of some of the key performance characteristics of these techniques is included in Table 1. Finally, we will conclude with some of the challenges and interesting opportunities presented by the development and use of optical spectroscopic and imaging modalities for tissue engineering applications.
Spectroscopic Measurements for Tissue Engineering Applications
As mentioned above, spectroscopy involves the measurement of the intensity of scattered or luminescent (typically fluorescent) light as a function of a variable, such as time, wavelength, polarization, frequency, or angle. Purely spectroscopic measurements have been performed to characterize different aspects of the matrix, scaffold, and cellular components of engineered tissues. Advantages of such approaches typically include fairly simple and portable instrumentation, fast data acquisition, and data analysis approaches that are straightforward and can be implemented in real time. These methods usually lack a high level of spatial resolution, but different probe designs can be implemented to enhance the sensitivity of the measurements to superficial (tens to hundred(s) of microns) or deeper (up to a few millimeters) regions of a specimen.8,9
Elastic scattering wavelength-dependent spectroscopic measurements have been performed in the 320–900 nm range to assess collagen fibril alignment and contraction.10,11 Specifically, there was a strong correlation in spectral features of the backscattered light intensity (such as the ratio of light scattered at 500 nm to the intensity and slope of the light spectrum in the 615–810 nm region) and the level of contraction of tethered and untethered collagen type I gels containing fibroblasts. Studies observing the light backscattered from equine superficial digital flexor tendons at different angles with reference to the longitudinal axis of the tendon reported a significant level of anisotropy that reflected the level of alignment of collagen fibrils of the tendon. When the distance of the fiber probes delivering and collecting the light was 2.75 mm, the measurements were sensitive to the alignment of the fibers within the tendon interior (up to 3-mm deep). However, when the probe separation was only 300 μm, the measurements were sensitive to the alignment of the epitenon collagen fibrils, which appeared to align at least in part around the circumference of the tendon.
More recently, light scattering spectroscopic measurements performed using linearly polarized light and detecting the backscattered light that has undergone only a single or very few scattering events have revealed the potential of this technique to assess important cellular and matrix features.12,13 Specifically, it has been found that the backscattered light intensity has an inverse power law dependence as a function of wavelength consistent with scattering from a log-normal distribution of scatterers with sizes varying from a few tens to a few hundreds of nanometers. The value of this power-law exponent was sensitive to the differentiation status of smooth muscle cells, the level of adhesion of endothelial cells on fibronectin and laminin substrates, and the extent of endothelial cell apoptosis in response to various concentrations of tumor necrosis factor-α.12 Similar measurements have also been acquired dynamically from silk films following several mineralization cycles.13 The intensity of the detected scattered light was highly correlated with the overall levels of mineral deposition, while the wavelength dependence of the scattered light revealed important differences in the organization of the mineral deposits, depending on the β-sheet content of the original film.
Raman microspectroscopy has been used to monitor the deposition of HA and HA precursors in human bone marrow–derived mesenchymal stem cells (hMSCs) treated with dexamethasone or a quality elk antler extract (QEVA) hypothesized to have high osteoinductive potential.14 A Raman peak at 960 cm−1 corresponding to a stretching vibration of PO in the PO43− tetrahedra of HA was detected in hMSCs after only 1 day of treatment with QEVA and after 10 days of treatment with dexamethasone. The intensity of the HA peak increased continuously for 14 days. Raman peaks corresponding to the HA precursors, amorphous calcium phosphate and octacalcium phosphate, were also detected. These measurements were performed in situ, while the cells were still alive and did not require any staining. Similar measurements have been performed to distinguish nondifferentiating from differentiating murine embryonic stem cells based on a ratio of RNA and total protein, calculated from the area under the RNA and phenylalanine Raman peaks (813 and 1005 cm−1).15
Collagen deposition during osteogenic differentiation of putative stem cells derived from human adipose tissue has been characterized by time-resolved laser-induced fluorescence spectroscopy measurements.16 During such measurements, the decay rate of the fluorescence intensity resulting from a very short, intense pulse of light was monitored to identify the relative expression of different types of collagen, including collagens I, III, IV, and V, since these collagen types have distinct decay rates and corresponding fluorescence lifetimes. This study confirmed the dominant presence of collagen type I, especially following the third week of differentiation.
Finally, fluorescence spectroscopic measurements have been performed to extract quantitative information related to the structural conformation of silk-based biomaterial scaffolds.17 Specifically, fluorescence emission spectra acquired at several excitation wavelengths in the 250–335 nm region were analyzed quantitatively in terms of components attributed to tyrosine, tryptophan, and crosslink contributions (Table 3). Significant spectral shifts in the emission profiles and relative contributions of these components were discovered among the silk solution, gel, and scaffold samples that represented enhancements in the levels of crosslinking, hydrophobic, and intermolecular interactions, consistent with an increase in the levels of β-sheet formation and stacking (Fig. 3 and Table 3). Based on this information, simple, noninvasive, ratiometric methods can be developed to assess and monitor the structural conformation of silk in engineered tissues.17 It is expected that similar approaches may be relevant for the monitoring of other biomaterial scaffolds.
Table 3.
Summary of Spectral Components of the Components Used to Describe Silk Samples
| |
Silk solution |
Silk gel |
Silk scaffold |
||||||
|---|---|---|---|---|---|---|---|---|---|
| λmax (nm) | FWHM (nm) | Contribution (%) | λmax (nm) | FWHM (nm) | Contribution (%) | λmax (nm) | FWHM (nm) | Contribution (%) | |
| Tyrosine | 305 | 34 | 32 | 305 | 34 | 12 | 305 | 34 | 1 |
| Tryptophan 1 | 345 | 66 | 39 | 340 | 67 | 36 | 335 | 57 | 44 |
| Tryptophan 2 | 310 | 37 | 12 | 310 | 39 | 23 | 310 | 42 | 32 |
| Tryptophan 3 | 345 | 57 | 15 | 340 | 51 | 25 | 345 | 60 | 17 |
| Crosslinks | 395 | 82 | 2 | 390 | 87 | 4 | 405 | 108 | 6 |
FWHM, full width at half maximum.
Reproduced with permission from Georgakoudi et al.17
FIG. 3.

Silk biomaterial fluorescence. (A) Fluorescence excitation-emission matrix of silk in solution. Arrows indicate major contributions from tyrosine, tryptophan, and crosslinks. (B) Representative fluorescence emission spectra acquired at 265 nm and (C) 310 nm from silk in solution, gel, and scaffold configurations are shown as solid lines. Reproduced with permission from Georgakoudi et al.17
While the combined use of spectroscopic techniques to characterize multiple components of engineered tissues has not been reported, such approaches have been used successfully both in vitro and in vivo to detect more accurately the presence of diseases such as early cancer.18–20 Thus, it is expected that a combination of scattering- and fluorescence-based measurements could be implemented to characterize simultaneously and in an entirely noninvasive manner cellular, scaffold, and matrix components of engineered tissues.
Depth-Resolved Imaging
Spectroscopic measurements such as the ones discussed above are typically performed at a single or a few locations within a specimen and provide biochemical and/or structural information about the sample with limited spatial resolution. To acquire an image with high spatial resolution from an engineered tissue specimen that extends beyond 20–30 μm, depth-resolved imaging approaches are employed. Confocal and multiphoton microscopy (MPM), as well as optical coherence tomography (OCT) are the major optical technologies that are being explored. Therefore, we present below some of the main principles of operation and performance characteristics of these tools along with examples of tissue engineering applications.
Confocal Microscopy
Confocal microscopy is now widely used for high-resolution imaging of optically thick samples. Its main advantage over standard microscopy is its ability to provide depth-resolved images. In a standard microscope, the whole field is illuminated with a collimated beam of light and imaged onto a detector (camera or eye retina). Even though the objective is positioned so that light emitted from its focal plane is optimally imaged onto the detector, light interacts with matter throughout the sample, and scattered or fluorescent light is generated and detected from multiple planes (Fig. 4).
FIG. 4.

Brightfield and confocal microscopy. (A) The optical path of a bright field microscope includes uniform illumination of a sample. Light from the focal plane as well as from the out-of-focus planes of the objective reaches the detector. (B) The optical path of a confocal microscope relies on focused illumination of a point on the sample, which is then imaged onto a pinhole in front of the detector. Most of the light emanating from the out-of-focus planes does not reach the detector because of the pinhole. (C) Transmission image of a silk scaffold including signal emanating from various planes along the specimen. (D) Corresponding confocal fluorescence image of a silk scaffold, illustrating optical sectioning (bar = 75 μm, magnification: 63× water immersion objective).
This results in significant loss of resolution and image degradation. In a confocal microscope, light of high intensity, typically from a point laser source, is imaged onto a point on the specimen. Light reflected or fluorescently emitted from that point is imaged onto a pinhole and detected by a sensitive detector, typically located behind the pinhole. Thus, the pinhole is confocal to the focal point of illumination on the sample, and it eliminates detection of most of the light that is emitted from points above and below the focal point (Fig. 4).
In a confocal microscope, only a single point along a plane is illuminated and imaged at a time. To acquire an image, either the illumination spot or the specimen needs to be scanned. For biological imaging, it is most often the laser excitation point that is scanned using a combination of two mirrors. Images at distinct depths within the specimen can be acquired by scanning either the objective or the specimen, and three-dimensional reconstructions can be rendered from a series of optical sections. We show in Figure 4 an example of a transmission image of a silk scaffold acquired using a standard microscope, and we compare it to a corresponding optical section acquired using fluorescence-based confocal imaging. The enhancement in resolution and the ability to visualize micron features of the silk scaffold architecture are immediately obvious.
The diffraction-limited lateral resolution (i.e., the resolution along the plane of focus) of a point-scanning confocal microscope is theoretically similar to that of a standard microscope and given by the expression
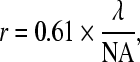 |
where r is the minimum distance between two points in the image that can be resolved, λ is the wavelength of light in vacuum, and NA is the numerical aperture of the objective.21 The latter is a parameter that is proportional to the cone of light that is collected by the objective. Thus, the shorter the wavelength and the higher the NA of the objective the better the resolution of an image we can achieve. For example, for an image collected at 500 nm with an objective that has an NA of 0.5, the theoretically achieved resolution is 610 nm. The theoretical axial resolution (i.e., the resolution in the direction perpendicular to the plane of focus) for a confocal microscope is
 |
where η is the refractive index of the object.21 Thus, for an objective with an NA of 0.5, an image from a biological specimen with a refractive index of 1.36 acquired at 500 nm could be acquired at an axial resolution of 5440 nm or 5.44 μm. When the NA increases to a value of 1.2 (for an immersion objective, for example), the axial resolution improves significantly to 833 nm. In practice, the experimental resolution of the instruments we use is worse than the theoretical resolution due to optical aberrations. Examples of depth-resolved endogenous fluorescence images of a silk scaffold and J2 fibroblast cells acquired with a 20×, 0.7 NA objective and a 63×, 1.2 NA water immersion objective are shown in Figure 5, to illustrate the improvement in resolution. It is also obvious that the size of the field that we image is directly proportional to the magnification of the objective. Therefore, the need to survey a large area may limit the resolution with which images are recorded, since low-magnification objectives typically have small NAs.
FIG. 5.

Dependence of image resolution on NA. TPEF (at 800 nm) image stack of a silk scaffold acquired with a (A) 20×, 0.7 NA objective (750 × 750 × 200 μm) and (B) 63×, 1.2 NA water immersion objective (238 × 238 × 200 μm). TPEF (at 740 nm) image sections of J2 fibroblasts acquired through a (C) 20×, 0.7 NA objective and (D) 63×, 1.2 NA water immersion objective. Bar = 75 μm.
High-magnification objectives that use water or oil as immersion media with NAs of 0.9–1.6 are commercially available. However, an important consideration to keep in mind is that such high-NA objectives typically have very short working distances, limited to a range of 100–300 μm (the working distance of an objective designed to image through a coverslip corresponds to the distance from the coverslip edge closest to the specimen to the furthest plane within the specimen that could be imaged by the objective). Thus, often times when imaging thick specimens, we need to compromise resolution for an increase in the imaging depth that can be achieved.
The depth of imaging (or penetration depth) in confocal microscopy is not always limited by the working distance of the objective, especially for low-NA objectives, whose working distance exceeds a few millimeters. The scattering, absorption, and optical aberrations that the light experiences as it travels into and out of the specimen are usually the main factors that limit the effective depth at which a reasonable signal to noise ratio can be achieved to reconstruct an image. Absorption simply results in a decrease in the number of photons that reach either the focal point on the specimen or the detector. In addition to decreasing the signal by diverting the photons out of the imaging path, scattering also results in an increase in the size of the focused spot that can be formed as a function of depth into the sample. Optical aberrations introduced by the optical elements of the system or by their improper use can also degrade significantly the quality of the focused spot onto our specimen. Spherical aberrations, which typically are the most significant aberrations affecting the performance of depth-resolved imaging setups, are minimized with water immersion objectives, because the refractive index of water (n = 1.33) is similar to the average refractive index of soft tissues (n = 1.36–1.46). Aberrations lead to a decrease in the signal, an increase in the background, and an overall decrease in the achievable signal to noise ratio and, ultimately, the image resolution. Therefore, the depth at which images of the desired resolution can be achieved depends not only on the capabilities of the microscope, but also on the optical properties of the specimen and the level of signal that is available for detection. Reflectance-based confocal microscopy images of human tissues relying entirely on endogenous scattering can be acquired typically with subcellular resolution for depths of up to 300 μm.22
Numerous confocal microscopy studies have been performed using exogenous fluorescence stains, often following fixation. Such stains provide high signal to noise ratio and specificity, especially in the case of fluorescently labeled antibodies, to cellular, extracellular matrix (ECM), and scaffold features of interest. For example, confocal studies with fluorescent stains often assess cell viability and proliferation, adhesion and spreading23–33 for novel biomaterials,24,26,27,31,32 scaffold designs,23,25,30 cell populations,29 or surface modification approaches28 and perfusion conditions.33 Functional information, such as neural activation27 or cardiomyocyte contraction,34 can also be obtained in engineered three-dimensional environments that are more physiologically relevant than two-dimensional cultures. Deposition of specific matrix components, such as collagen types I, II, and III, and aggrecan, has been assessed in three-dimensional scaffolds by confocal microscopy using fluorescently labeled antibodies.35,36 Detailed scaffold degradation studies are also possible in some cases. For example, the intensity and localization of rhodamine B fluorescence was imaged by confocal microscopy to assess the degradation kinetics of a novel hydrogel, consisting of physically crosslinked dextran microspheres of opposite charges, which also contained the rhodamine. Additional features, such as the dependence of the loading quantity and localization of fluorescently labeled bovine serum albumin (BSA) on the protein loading scheme (coprecipitation or surface adsorption) during mineralization of a polylactic-co-glycolic acid film,37 have been observed. Confocal fluorescence measurements have also allowed understanding and visualization of more complex effects, for example, suppression of the ability of human umbilical vein endothelial cells to form tube-like structures when they were cocultured with human osteoblasts in a three-dimensional collagen gel.38 Imaging of cell and matrix modifications and interactions in three-dimensional specimens is essential for optimizing engineering strategies to develop complex tissues. In Figure 6 we demonstrate the ability of confocal fluorescence imaging to visualize hMSC spreading and morphology on a silk scaffold in three dimensions. Nevertheless, imaging using such stains can compromise the viability of the cellular components and is limited to single time-point measurements. These limitations are overcome by confocal measurements relying on endogenous contrast or on the expression of fluorescent proteins, such as the green, yellow, cyan, and red fluorescent proteins, incorporated in the cellular genome.
FIG. 6.

hMSCs on silk scaffold. (A) hMSCs (green) sparsely seeded onto a silk scaffold, stained with calcein AM. Silk (red) is counter stained with ethidium homodimer (10× objective, bar = 300 μm, stack 1500 × 1500 × 630 μm). (B) Thickly seeded GFP-expressing hMSCs (green) on silk scaffold (red) (20× objective, bar = 75 μm, stack 750 × 750 × 210 μm).
Fluorescent proteins have been successfully expressed in cells such as fibroblasts, and very recently in stem cells. Such proteins are significantly more highly fluorescent than natural cellular fluorophores, allowing direct visualization of cells and their interactions with three-dimensional matrices (Fig. 6B). For example, green fluorescent protein (GFP)–expressing fibroblasts have been imaged within collagen gels embedded with fluorescent beads.39 By overlaying the cellular GFP confocal images with images from the fluorescent beads over a period of 6 h, it was possible to calculate the dependence of the translocation of collagen fibrils on cell seeding density and the presence of growth factors, such as lysophosphatidic acid (LPA), platelet-derived growth factor (PDGF), and BSA. High-resolution confocal imaging enabled the investigators to observe that the progression of the local remodeling of the collagen fibrils depended on the growth factor that was present. Specifically, contraction occurred in a unidirectional fashion in the presence of PDGF and led to a stellate morphology for the fibroblasts, while it proceeded in two waves and resulted in a bipolar morphology when LPA was present.
The morphology and mobilization of GFP-expressing fibroblasts was imaged within chitosan scaffolds and associated with extracellular matrix deposition over a period of days using a combination of fluorescence- and reflectance-based confocal microscopy.40 Specifically, fluorescence-based confocal microscopy at 488 nm excitation was used in combination with a spectral deconvolution algorithm to resolve the chitosan autofluorescence signal from that of the GFP signal, which in these particular cells was associated with vinculin expression. Reflectance-based confocal measurements performed with the same instrument at 514 nm allowed visualization of the extracellular matrix deposited by the cells over 9 days of culture. These studies showed that extracellular matrix was always present between the vinculin-expressing cells and the scaffold. While cells populated uniformly the entire scaffold (about 3 mm in height) during the initial 3–5 days, a higher density of cells and the deposited extracellular matrix was observed within the more superficial 100–200 μm layer following 7–9 days of culture, most likely in response to nutrient deprivation in the more central areas of the scaffold.
Confocal reflectance microscopy measurements have been performed by a number of investigators to assess noninvasively the organization and/or remodeling of extracellular matrix in three-dimensional specimens. Fibrillar collagens are typically good scattering sources and can be imaged without the need for staining. Fairly sophisticated algorithms based on Fourier analysis41 and line tracing approaches42 have been developed to quantify collagen content, fiber size, orientation, and alignment. Such studies have demonstrated that collagen fibrils become compacted and align parallel to the axis of stress fibers and pseudopodia of embedded fibroblasts.41 Inhibition of Rho kinase led to a significant decrease in collagen fibril density and alignment, suggesting that Rho kinase–dependent contractile force generation may be at least partially responsible for coalignment of cells and collagen fibrils along the plane of greatest resistance.41
Cartilage matrix deposition and integration of tissue-engineered cartilage with native tissue has also been assessed via reflectance-based confocal microscopy at 830 nm.43 Specifically, fibrin glue with or without chondrocytes was placed between living or devitalized cartilage discs and implanted in the back of nude mice. The specimens were surgically removed at 2, 5, and 8 weeks postimplantation and assessed by reflectance confocal microscopy and standard histopathology. These studies demonstrated that it was possible to visualize the interface between the newly formed and existing cartilage tissue by confocal microscopy and to detect new cartilage matrix as early as 2 weeks. It was possible to visualize both cellular and extracellular components of the implants, but impossible to assess cellular viability relying entirely on the reflectance signal. Interestingly, placement of the cellular fibrin glue in between the devitalized discs rather than the living discs led to more homogeneous cartilage tissue generation.
In addition, confocal reflectance microscopy was used successfully to assess the micro- and macropore diameters of 1- to 2-mm-thick defatted and deproteinized cancellous canine bone specimens without the use of an exogenous stain.44 Comparisons of pore diameter estimates using confocal reflectance and scanning electron microscopy imaging yielded statistically similar results, demonstrating the capability of confocal microscopy to provide morphological details. Further, it was found that addition of rhodamine B to fluorescently label the sample surfaces enhanced the signal to noise ratio and yielded higher-contrast images.
Confocal reflection interference contrast microscopy also relies on endogenous scattering contrast and has been used to perform detailed biophysical studies of the dependence of the adhesion contact dynamics of cells (fibroblasts and hepatocytes) on the surface properties of biomaterials, such as gelatin, chitosan, fibronectin, collagen, and polyethylene terephthalate.45–47 These measurements were performed in combination with fluorescence and/or phase-contrast microscopy in order to associate the degree of cell deformation and adhesion energy to cell spreading and the expression of specific proteins such as actin. One of these studies noted significant changes in the initial adhesion contact dynamics of HepG2 cells upon the transfection of GFP actin in these cells.46 Thus, while the introduction of fluorescent proteins enables cell visualization and confers molecular specificity, it may also alter cell–cell and cell–matrix interactions.
These examples demonstrate that confocal microscopy is a valuable tool for the noninvasive assessment of multiple aspects and components of engineered tissues. Using reflectance-based confocal microscopy, it is possible to acquire high-resolution images of the cellular and extracellular components. Such images can be used to determine in a highly quantitative manner various morphological and organizational features of the matrix,48 cellular, and intracellular morphology.49 However, it is not possible to assess cell viability or visualize, with high differential contrast, the internal morphology of cells. To achieve that, it is necessary to use fluorescence-based confocal microscopy relying on fluorescent protein expression or the administration of exogenous fluorescent stains. In some cases, autofluorescence of the scaffold biomaterial may provide sufficient contrast to image morphological features of interest, such as pore micro- and macroarchitecture.
Multiphoton Microscopy
MPM relies on nonlinear absorption and scattering interactions that can take place when light of very high intensity falls onto a specimen. The absorption interactions yield fluorescence emission, which is exploited as a source of contrast in multiphoton-excited fluorescence (MPEF) imaging modalities. Nonlinear scattering interactions result in harmonic generation at wavelengths that equal, for example, a half or a third of the incident wavelength, corresponding to second- and third-harmonic generation (SHG and THG) imaging approaches. These interactions are depicted from an energy-level standpoint in Figure 7 and discussed in more detail below.
FIG. 7.

Energy-level representation of nonlinear light–matter interactions. (A) Multiphoton excitation and emission of fluorescence. (B) Second harmonic generation.
In two-photon excited fluorescence (TPEF), two photons are absorbed simultaneously, and combine their energies to cause a molecular excitation that would otherwise occur through absorption of a single photon at half the wavelength. Therefore, the probability of two-photon absorption depends on the square of the instantaneous light intensity. The simultaneous absorption of two photons is significantly less probable than single-photon absorption, as evidenced by the single- and two-photon absorption cross-section values included in Table 2 for some endogenous chromophores. Thus, significant power levels (on the order of MW/cm2 to TW/cm2) are typically required to yield enough two-photon absorption and fluorescence emission events so that they can be detected. This in turn necessitates the use of lasers that provide highly intense pulses of light over a very short period of time and at repetition rates that ensure that the average power delivered to the specimen will remain low enough to avoid thermal damage. Most TPEF systems employ Ti:sapphire laser systems that provide light in the 700–1000 nm range in 80–150 fs pulses at a repetition rate of 80–100 MHz. Specifically, the probability that a fluorophore at the center of the focus absorbs a photon pair during a single-photon pulse is
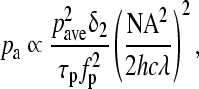 |
where pave is the average power, δ2 is the two-photon absorption cross section of the fluorophore, τp is the pulse duration, and fp is the repetition rate.50 For this expression to be valid, it is important that there are always fluorophore molecules available in the ground state (i.e., there is no saturation). For most chromophores, TPEF measurements are typically acquired at power levels that are significantly lower than what would be needed to achieve saturation. However, with fluorophores such as quantum dots that have significantly larger two-photon absorption cross sections, saturation may be reached at power levels of only a few megawatts.51 Thus, care should be taken to optimize the incident power if such chromophores are used.
If a fluorophore is excited by a multiphoton process, it can emit a single photon as it relaxes back to its ground state. In contrast to a fluorescent photon emitted following a linear excitation process, the photon emitted after nonlinear excitation will have a shorter wavelength and, thus, higher energy than each one of the incident photons. This allows much more efficient separation of the excitation and emission photons using optical filters, when compared to confocal fluorescence measurements for which the excitation and emission profiles of the chromophores overlap highly in most cases. There are a number of additional advantages associated with TPEF imaging compared to confocal microscopy summarized in Table 1. As mentioned above, the probability of inducing a two-photon excitation process depends on the square of the power of light incident on the sample. As a result, for a strongly focused excitation beam (i.e., a high-NA objective), the probability of two-photon absorption falls off as z−4, where z is the distance from the focal plane. Therefore, for an objective with an NA of 1.4 and excitation at 700 nm, 80% of the fluorescence we excite is confined within a volume of approximately 0.1 fL and a spot that extends only about 1 μm along the axial direction. So, in TPEF we achieve depth sectioning capabilities because of the inherent confinement of two-photon excitation within a small focal volume (Fig. 8). For this reason, we no longer need a pinhole to remove the out-of-focus light. As a result, we can collect the resulting TPEF photons using a much simpler and more efficient approach than in a confocal microscope, as shown in Figure 9. Moreover, since two-photon absorption processes are confined to a small focal volume, the level of photobleaching and photodamage can be significantly reduced compared to confocal microscopy. This has been demonstrated in a number of studies, including, for example, the imaging of living rhesus monkey embryos.52 However, because the peak power is significantly higher in TPEF than in confocal approaches, distinct photobleaching mechanisms are possible that can ultimately lead to increased levels of photobleaching within the focal volume.53 This depends on the type of chromophore and is a major motivation for using the lowest possible power to achieve a satisfactory signal to noise ratio. In addition, using two- and three-photon processes, it is possible to excite important biomolecules, such as NADH and flavins, without the need to use UV excitation and the corresponding specialized UV optical components. Finally, excitation in the NIR region of the spectrum, where scattering and absorption are significantly reduced compared to the visible, allows in principle for imaging deeper into a specimen. Imaging up to depths of 1 mm has been achieved in tissues such as the neocortex.54 The resolution capabilities of confocal and TPEF systems are practically very similar. However, TPEF systems require a very expensive laser that requires water cooling and tight control of the temperature and humidity of the facility for proper operation and alignment. In addition, the need for very short light pulses is not compatible with the use of traditional optical fibers that result in pulse broadening through dispersion.
FIG. 8.

Fluorescence excitation volume in confocal and MPM. (A) Fluorescence (green) is excited throughout the illumination light path (blue) in confocal microscopy. (B) Multiphoton excitation of fluorescence (green) is confined to a small focal volume of the illumination cone (red).
FIG. 9.

Schematic of confocal and multiphoton microscopes. (A) Confocal microscope. Precise alignment of the detector pinhole so that it is confocal to the focal point of the objective on the sample is critical. (B) Multiphoton microscope. Collection of the emitted light does not require a pinhole, resulting in a simpler detection design and more efficient signal collection.
SHG is another nonlinear optical phenomenon in which two photons of a certain frequency interacting with the material combine and yield a single photon at double the original frequency (i.e., half the wavelength). The physical principles underlying SHG microscopy are more complicated than those of TPEF, because it is an optical process that requires phase matching of the electric field radiated from all the molecules within the focal volume of nonlinear excitation (phase is the displacement of a sinusoidally oscillating field from a given origin). When an electric field is incident upon an object, it induces a polarization P(t) (electric dipole moment per unit volume) that is described by
 |
where ɛ0 is a constant (permittivity of free space) and χ(n) is the nth-order susceptibility of the material (a parameter that indicates how easily the electric field can interact with the material and induce a dipole).55 SHG is related to the second term of this equation and, thus, depends on the second-order susceptibility of the object. No SHG can be detected when the material possesses centrosymmetry or when the molecules that make up a material are oriented randomly. However, there are a number of cellular and tissue structures that are known to generate naturally detectable levels of SHG (Table 4). SHG provides automatically depth sectioning because, as in the case of TPEF, the SHG signal is proportional to the square of the instantaneous local intensity. In principle, the same microscope setup that is used to acquire TPEF images can be used for SHG imaging. However, because of the phase matching condition, SHG intensity is typically dependent highly on direction, unlike TPEF that is a spatially uniform process. Thus, in optically thin specimens that include collagen fibers, for example, it is much easier to detect SHG signal in the forward direction rather than in the backward direction. In thicker, more highly scattering samples, SHG detection is possible in the backward direction, mostly because a significant fraction of the forward-generated SHG signal is backscattered and collected by the detector. Detection of the polarization dependence of SHG also provides information with regards to the orientation of the molecules. Also, unlike TPEF, there is no absorption occurring in SHG, and, thus, no associated photodamage or photobleaching.
Table 4.
Sources of SHG
The combined use of TPEF and SHG to identify the cellular and matrix components of fibroblast-embedded collagen gels was initially demonstrated by Zoumi et al.56 Acquisition of two-photon excited spectra at several excitation wavelengths varying between 730 and 860 nm revealed a strong wavelength dependence on the intensity of the SHG and TPEF signal detected from collagen fibers in the backward direction, with 800 nm yielding the maximum SHG intensity. In addition, it was found that longer excitation wavelengths (840 nm, for example) facilitated distinction of the multiphoton signals from the collagen and the cellular components of the specimen, because at those wavelengths, collagen fibers produce almost exclusively SHG and no TPEF.
The combination of TPEF and SHG has been found useful as a tool for the characterization of ultrastructural properties of native and engineered vascular tissues that affect significantly their physiologic and mechanical function. For example, TPEF and SHG images acquired at 800 nm excitation were used to visualize the detailed structure of collagen and elastin fibers within the media and adventitia of excised rabbit aortas and pig coronary arteries, with collagen yielding predominantly SHG at 400 nm and elastin providing TPEF with an emission maximum at 495 nm57,58 (others have reported elastin emission of 420–460 nm59). TPEF from cells that were present in these specimens was also detected with an emission peak at 520 nm. Using combined TPEF and SHG imaging, a significant decrease in the collagen fiber thickness and the overall wall dimension was noted when comparing the no-stress and no-load condition to 30 and 180 mm Hg distension pressures. In other studies, TPEF excited at 760 nm was used to identify cellular NAD(P)H and elastin fiber autofluorescence and performed in combination with SHG imaging at 840 nm excitation to visualize the morphology of collagen fibers in excised and engineered heart valve tissues.59–61 The engineered tissues were prepared from decellularized porcine matrices repopulated with ovine myofibroblasts and endothelial cells and cultured under normal and supraphysiological pressure conditions.59 The MPM imaging studies demonstrated that growth under high pressure led to cellular detachment and the formation of a defective elastin network. The ability to visualize these structures without any processing allowed the acquisition of information that is virtually impossible to acquire using standard histochemical staining. A deficient and less-organized network of elastin fibers was also detected when the same imaging approach was used to examine excised tissue-engineered blood vessels implanted in the descending aorta of juvenile sheep for 24 weeks.60 Optimizing strategies for the development of an elastin network that is equivalent to that of native tissue following implantation of tissue-engineered blood vessels is a major obstacle that vascular tissue engineers need to overcome. TPEF/SHG imaging may serve as a useful monitoring tool in these efforts. Developing approaches to acquire this type of images in vivo through the blood vessel wall is certainly going to be challenging, but it is likely that, with the advent of novel fibers, many of the limitations can be overcome.
Combined measurements of SHG and TPEF have also been performed for hMSCs embedded in polyglycolic acid (PGA) scaffolds undergoing chondrogenic differentiation for cartilage tissue engineering applications.62 Measurements were performed at 760 nm excitation, and the corresponding SHG and TPEF signals were collected at 380 ± 20 nm and 490 ± 20 nm, respectively. The PGA scaffold produced intense autofluorescence in the 490 nm channel. Signal was also detected by the 380 nm channel, but since the bandpass filter employed was quite broad, it is not clear that the detected signal is SHG or TPEF. Autofluorescence was detected from the embedded stem cells, while increasing levels of deposited collagen fibers were monitored by SHG. It was found that the orientation of the deposited collagen fibers showed preferential alignment along the PGA fibers after 1 week of chondrogenic induction, but became more random at later time points (weeks 2 and 3). In addition, it was observed from the TPEF measurements that some of the PGA scaffold fibers started breaking within 1 week, possibly as a result of the forces exerted by the deposited matrix. Since the TPEF images were taken without any processing, it was evident that this was not an artifact of the imaging approach. Nevertheless, it may also be possible that some broken PGA fibers were present within the scaffold even before chondrogenic induction.
Additionally, MPEF and SHG imaging has been used to assess the effects of electrical stimulation on the orientation and alignment of collagen fibers and cells.63 Specifically, it was found that direct current stimulation of fibroblast-embedded collagen gels with 7 V/m led to preferential alignment of the cells and the collagen fibers perpendicularly to the direction of the applied field, within 30 min of exposure. However, no such changes were seen when the collagen gel was embedded with stem cells, even when the field strength increased to 10 V/m. Multiphoton imaging allowed the investigators to visualize the presence of concentrated fiber bundles with the MSCs prior to the electric field exposure, suggesting that tighter connections were present between MSCs and the surrounding matrix than between fibroblasts and collagen. It was hypothesized that these tight connections may be the reason why the MSCs did not change orientation in response to the electric field stimulation. Clearly, the ability to understand and monitor dynamically the adhesion and interactions of cells with their surrounding matrix in three-dimensional cultures is of paramount importance for optimizing tissue engineering strategies.
Spectroscopic multiphoton measurements have also been found useful in characterizing the detailed structure of biomaterials such as silk. Specifically, a blue shift in the TPEF spectra of silk-based scaffolds has been associated with an increase in the β-sheet content of the sample.64 SHG was detected only in natural silk fibers and in silk specimens in which there was enhanced orientation of the secondary silk structures along a particular axis. Since β-sheet content and orientation have been highly correlated with the stability, mechanical, and degradation properties of silk samples, such studies demonstrate that multiphoton imaging approaches may serve as useful tools for assessing noninvasively key structural features of scaffold materials, and, thus to understand better how they relate to the overall biochemical and physiological function of the resulting engineered tissues.
Additionally, it has been recently shown that endogenous TPEF images of hMSCs acquired using 800 nm excitation can be used to acquire quantitative biochemical and morphological information that can be correlated with the differentiation status of these cells along an adipogenic pathway.65 Specifically, the intensity ratio of images acquired at 525 ± 25 nm to those obtained at 455 ± 35 nm decreases significantly as hMSCs differentiate, as shown in Figure 10. These changes in TPEF emission represent differences in the relative concentrations of biochemicals, such as NADH, FAD, and retinol. In addition, the TPEF images reveal that the differentiated cells have a rounder morphology and occupy a larger area than their undifferentiated counterparts. One of the unique advantages of optical characterization is the ability to provide this type of biochemical and morphological information on a per cell basis (Fig. 10). This knowledge may in turn offer new insights in the factors that affect the progression of stem cell differentiation that we cannot obtain with techniques such as RT-PCR.
FIG. 10.

TPEF ratio of hMSCs. Fluorescence ratio of hMSCs after 21 days of culture in propagation medium remains high (panel A), while hMSCs in adipogenic medium (panel B) have a lower ratio. (C) The populations of hMSCs in propagation medium (triangles) and adipogenic medium (circles) can be differentiated by plotting the fluorescence ratio against normalized area [calculated as (1 − eccentricity) × area in thousands of pixels]. Reproduced with permission from Rice et al. 2007.65
In some cases, distinction of TPEF signals from the scaffold and cellular components may not be trivial, especially if their spectral emissions are highly overlapping. Acquisition of time-resolved multiphoton images could be a powerful tool in overcoming such limitations. Because very short pulses of light are used for the acquisition of TPEF images, addition of time-resolved detection capabilities to a multiphoton imaging system is fairly straightforward. For example, it has been found that the TPEF lifetimes of three GFP variants transfected in chondrocytes varied significantly, even though the TPEF emission spectra highly overlapped.66 Time-resolved TPEF measurements may be also useful for identifying collagen types or for assessing in more detail the biochemical status of cells. Time-resolved measurements have been used to distinguish the TPEF of the bound and the unbound NADH components in solution and in tissues.67,68 Such measurements may be for example useful in assessing the differentiation status or lineage of stem cells.
Because of the numerous advantages of MPM, including its ability to excite endogenous cellular chromophores without causing significant photodamage, and its flexibility, in terms of performing measurements at multiple wavelengths or in lifetime mode to assess matrix, scaffold, and cellular components, we expect that it will be an excellent tool for understanding the role of at least some of the intricate interactions between the different engineered tissue components and their relevance to functional development.
Optical Coherence Tomography
OCT is based on the concept of optical ultrasound. Light is shone onto a specimen and the morphological features of the specimen, as assessed by variations in their corresponding refractive index, are reconstructed by determining essentially the amount of time it takes light to travel through the specimen and back onto the detector. However, the speed of light (3 × 10⁸ m/s in vacuum) is significantly faster than that of sound (1.48 × 10³ m/s in water). Therefore, this optical delay time cannot be detected using standard electronics. Instead, the optical phenomenon of interference is used. Specifically, a standard OCT system consists of a Michelson interferometer and a low-coherence light source. Unlike typical laser sources that emit monochromatic light (i.e., light of a single frequency or wavelength), low-coherence light sources, such as superluminescent diodes, emit light that has a bandwidth of a few tens to hundreds of nanometers. In the frequency domain, such sources yield optical wavetrains of finite length with a fixed phase relationship only within each individual wavetrain. This is essential for image reconstruction in OCT as explained below.
In a typical time-domain OCT (TDOCT) system, light from a low-coherence source, emitted in the form of wave packets or wavetrains (Fig. 11), is split in two optical paths. One path leads to the sample, while the other, referred to as the reference arm, leads to a mirror whose position is scanned across a certain distance. When light in the sample path impinges upon a structure that has a different refractive index from its surroundings, it gets scattered back and reaches the fiber coupler or beamsplitter. There, it is combined with the light that has traversed the reference path. The two beams will interfere only if they are coherent, that is, if they originated from the same wavetrain and if the path that the wavetrain traveled along the reference arm matches the distance that the wavetrain traveled along the sample path up to within the coherence length of the light. Thus, we can associate the interference pattern detected when the reference mirror is at a specific location with a specific depth within the sample. The amplitude of the interference pattern reveals information about the intensity of the backscattered light. Thus, by analyzing the detected interference signal that is obtained as the reference mirror is scanned, we can reconstruct the backscattered intensity across the z direction for a given x,y position on the specimen. This is typically referred to as an A-scan. To recreate a two- or three-dimensional image, we need to scan the beam that hits the specimen along the x or x and y dimensions, respectively. The axial resolution of the images is determined by the coherence length, lc, of the light source:
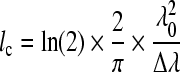 |
where λ0 and Δλ are the central wavelength and bandwidth of the light source, respectively.69 The lateral resolution of an OCT system depends on the wavelength and the NA of the lens that focuses the light onto the specimen in the same way as in a microscopy system. A major advantage of OCT compared to the depth-resolved microscopy approaches discussed in the previous section relies on its ability to provide information up to a depth of 2–3 mm. To achieve that high probing depth, systems typically employ lenses with low NA and long working distance. Therefore, both the lateral and axial resolution of standard OCT instruments is on the order of 10–15 μm. However, systems employing more sophisticated broadband light sources with axial resolution of up to 0.5 μm have been reported. In order to achieve similar resolution in the lateral direction, a high-NA objective is required that typically limits the probing depth to a few hundred microns.
FIG. 11.

Optical coherence tomography. Schematic diagram of a typical OCT system.
Recently, a more efficient method has been devised to acquire an A-scan profile, referred to as spectral-domain or Fourier-domain OCT.70 In such systems, the reference mirror is stationary, and the detector is replaced by a spectrometer and a multichannel detector. The approach relies on the fact that the frequency of the spectral oscillation of the measured signal in inverse wavelength (k) space is proportional to the path length difference between the reference mirror and a given depth within the specimen. For example, an interface corresponding to a longer path length difference will yield a faster oscillation in k space (k = 1/λ) than an interface with a shorter path length difference. As a result, a Fourier transform of the spectrally resolved signal yields an A-line profile. Spectral-domain OCT systems have a 20–30 dB sensitivity advantage over TDOCT systems, allowing for faster acquisition and/or increased penetration depth.70 Modifications in the standard OCT instrumentation, providing acquisition of Doppler-, polarization-, or absorption-sensitive signals, can yield useful functional information, related to flow, molecular orientation, and biochemical composition, respectively.71,72 In addition, acquisition of angular- or wavelength-dependent spectral information can be analyzed to provide further details on the morphology and organization of the scatterers within a specimen.73,74
Initial studies exploring the use of OCT as a noninvasive monitoring tool for tissue engineering applications are promising. Measurements performed with superluminescent diode–based systems that possess resolution on the order of 10–15 μm have demonstrated the ability of OCT to characterize the macrostructure of different types of scaffolds up to depths of 1–3 mm.75–78 Figure 12 illustrates a typical TDOCT image of a poly(l-lactic acid) scaffold, with and without MG63 cells. It is also possible to monitor the cellular distribution within those scaffolds and the rate with which the pores become gradually occupied by proliferating cells and the extracellular matrix they deposit.75 However, in some cases, it is difficult to differentiate the cells from the scaffold material. It is also not possible to differentiate clearly the cells from the deposited ECM or to distinguish live from dead cells. Nevertheless, OCT measurements performed at 820 nm have shown that the intensity of the backscattered signal can be qualitatively correlated with the oxidative state of cells, based on the changes in absorption that occur at this wavelength when the redox state of enzymes within the oxidative cascade (such as cytochrome c) is modified.78 Studies have also been performed using OCT systems with axial resolution on the order of ∼1–4 μm. In these experiments, it was possible to differentiate the cellular and extracellular matrix components of the engineered tissue specimens and to monitor cellular proliferation, adhesion, and motility.76,79 Such measurements were also performed with engineered skin equivalent tissues to visualize the stratum corneum, dermal and epidermal layers, as well as the basement membrane.69 Further, OCT was used to image the displacement of engineered tissues and the developing tissue of the Xenopus laevis tadpole in response to static compression.80 Differences were found in the corresponding strains calculated for cellular and acellular regions of the same scaffold. Thus, using OCT it is possible to correlate directly structural or architectural features of a scaffold and its mechanical properties. Perfusion is another critical parameter for functional engineered tissue development that can be assessed using Doppler OCT.81 Finally, in a number of these studies, the OCT imaging setup was integrated with the bioreactor in which the specimens were being cultured.75,79 Thus, investigators were able to take repeated measurements of the same location over extended periods of time.
FIG. 12.

Time-domain optical coherence tomography. TDOCT images of poly(l-lactic acid) scaffolds that are (A) blank and (B) seeded with 4 × 10⁶ cells for 5 weeks. Reproduced with permission from Yang et al.76
Recently, OCT measurements have been combined with MPM measurements as a means of assessing complementary structural and biochemical features of specimens. For example, such measurements were made to follow the results of thermal damage to engineered skin tissue equivalents and the ensuing healing responses.82 A decrease in OCT signal intensity following thermal damage was attributed to a decrease in the linear scattering properties of the specimen. The origin of this decrease was attributed to thermal denaturation of collagen fibers, which was consistent with the loss of SHG signal in the damaged areas. TPEF revealed fibroblast infiltration of the wounded area that was followed by matrix remodeling, as confirmed by an increase in OCT signal intensity and the reappearance of SHG-producing collagen fibers.
Clearly, OCT promises to serve as an excellent tool for the noninvasive monitoring of engineered tissues. This modality is highly flexible in its implementation, allowing for the acquisition of structural and functional information. It can be used to achieve imaging at depths that exceed 1 mm at resolutions that allow the visualization of cellular and extracellular matrix deposition within scaffold pores. Its potential to assess key parameters, such as perfusion, mechanical properties, scaffold morphology, and cellular distribution, has already been demonstrated. We expect that these capabilities will continue to be enhanced by technological improvements and its combination with other optical imaging modalities, such as MPM.
Conclusions and Future Directions
These initial studies demonstrate the potential of optical spectroscopy and imaging approaches to serve as useful tools for tissue engineers. Selection of the optimal technology is ultimately dictated by the type of information that is sought, the resolution/penetration depth requirements, and the cost and complexity of the system that can be afforded (Table 1). Spectroscopic techniques tend to be simple to implement, sensitive and specific to the composition of a sample over distances spanning tens to thousands of microns depending on the wavelength and light delivery/collection geometry, but lack high spatial resolution. Raman spectroscopy has superior molecular specificity to that of fluorescence or light scattering spectroscopic measurements, but its implementation is usually more difficult, as the signal to background level is typically lower by orders of magnitude. Fluorescence and Raman spectroscopic approaches yield biochemical and molecular composition information, while light scattering provides details on the morphology and organization of the specimen. Confocal microscopy provides for a relatively inexpensive way to acquire depth-sectioned high-resolution images that rely largely on the use of exogenous fluorescence chromophores or the expression of fluorescent proteins (e.g., green, yellow, and red fluorescent protein). On the other hand, endogenous scattering is typically the main contrast source for reflectance-based confocal microscopes. Systems operating at video-rate frames of image capture can also yield information on blood flow and/or perfusion, because of the negative (high absorption) contrast provided by hemoglobin in the blood.49
MPM also offers superb three-dimensional resolution (typically on the order of 1–2 μm axially and submicron laterally) and has a number of advantages over confocal microscopy, but it requires the use of a fairly expensive laser system that provides highly intense, ultrashort pulses, typically over a wide range of wavelengths. TPEF from exogenous, but also from endogenous chromophores, can be used to assess molecular, morphological, and biochemical information about the sample. SHG microscopy can be easily performed using the same instrument as TPEF measurements to acquire structural information about noncentrosymmetric tissue components, such as collagen fibers. Confocal and MPM imaging can typically provide information up to a few hundreds of microns deep within a biological specimen. OCT has significantly larger penetration depth capabilities, extending to 2–3 mm, at resolutions that usually vary between 3 and 15 μm. The development of broadband low-coherence sources has led to a significant improvement in the axial resolution of OCT systems. However, to achieve lateral resolution on the order of 1–2 μm, it is still necessary to use high NA objectives, whose working distance is typically (but not always) limited to hundreds of microns. OCT relies on scattering as a contrast source and yields morphological information. Nevertheless, the availability of broadband sources allows acquisition of spectroscopic data, which can reveal the presence of specific absorbers or the detailed structure of scatterers within a specimen.
The combination of spectroscopy with imaging is a powerful tool for acquiring more sensitive and specific information. In the case of Raman or TPEF, for example, spectroscopic or spectral imaging can reveal morphological information, in combination with biochemical, molecular, and/or structural information. In addition, the use of multiwavelength measurements can be useful for more sensitive differentiation of the cellular, scaffold, and extracellular matrix components of engineered tissues. A nonlinear approach that probes the vibrational states of molecules, coherent anti-Stokes Raman (CARS) microscopy, has also been recently implemented as a depth-resolved bioimaging approach with molecular specificity.83 Therefore, CARS microscopy could also serve as a useful tool for assessing important characteristics of engineered tissue components. The combination of all of these modalities is also feasible and can be used to provide complementary information on morphological and biochemical properties of the specimen, or other parameters such as perfusion/vascularization and mechanical/viscoelastic properties. The fact that such a wide gamut of information can be acquired repeatedly without affecting the viability or development of tissue specimens offers exciting opportunities for improving our understanding of tissue development. Further, such tools are expected to become integral to the expansion of tissue engineering into in vitro platforms for the study of human disease development and in the use of such systems for high throughput pharmaceutical screening strategies.
There are certainly plenty of challenges remaining so that the use of these approaches is optimized and ultimately extended from in vitro to in vivo applications. Development of quantitative biomarkers that correlate specific optical signals to unique tissue properties as assessed by more traditional (typically invasive) characterization procedures would enable tissue engineers to exploit more fully the dynamic/noninvasive nature of optical technologies. Further optimization and development of the approaches so that information can be acquired over more extensive depths will enhance opportunities for these techniques to be used in vivo, where the capability to assess information from the same specimen noninvasively is even more critical in terms of improving our understanding of cell–matrix interactions that play key roles during engineered tissue engraftment and development. The use of adaptive optics or minimally invasive probes may play a key role in achieving this goal. Identification and tracking of different cell populations, vascularization, perfusion, and monitoring of immune responses are processes that can be assessed by optical imaging and it will be important to determine their sensitivity in doing so, compared to invasive techniques. The use of exogenous contrast agents could enhance the sensitivity, specificity, and penetration depths achievable with these modalities. Further improvements in the ability of chromophores to label reliably a population of cells over extensive periods of time without affecting their function and/or physiology would be helpful. Ultimately, it is clear that a combination of optical techniques that rely on spectroscopy and imaging can provide a wealth of information that can be used to better assess the function of engineered tissues in vitro and in vivo and/or to optimize tissue engineering strategies.
Acknowledgments
Funding for the development of optical spectroscopic imaging approaches for tissue engineering applications has been provided in our laboratories by NSF (BES 0547292) and NIH (P41 EB002520 Tissue Engineering Resource Center).
References
- 1.Langer R. Vacanti J.P. Tissue engineering. Science. 1993;260:920–926. doi: 10.1126/science.8493529. [DOI] [PubMed] [Google Scholar]
- 2.Pancrazio J.J. Wang F. Kelley C.A. Enabling tools for tissue engineering. Biosens Bioelectron. 2007;22:2803–2811. doi: 10.1016/j.bios.2006.12.023. [DOI] [PubMed] [Google Scholar]
- 3.Fang H., et al. Noninvasive sizing of subcellular organelles with light scattering spectroscopy. IEEE J Sel Top Quantum Electron. 2003;9:267–276. [Google Scholar]
- 4.Backman V., et al. Measuring cellular structure at submicrometer scale with light scattering spectroscopy. IEEE J Sel Top Quantum Electron. 2001;7:887–893. [Google Scholar]
- 5.Kim Y., et al. Simultaneous measurement of angular and spectral properties of light scattering for characterization of tissue microarchitecture and its alteration in early precancer. IEEE J Sel Top Quantum Electron. 2003;9:243–256. [Google Scholar]
- 6.Mujat C., et al. Endogenous optical biomarkers of normal and human papillomavirus immortalized epithelial cells. Int J Cancer. 2008;122:363–371. doi: 10.1002/ijc.23120. [DOI] [PubMed] [Google Scholar]
- 7.Jacques S.L. Light distributions from point, line and plane sources for photochemical reactions and fluorescence in turbid biological tissues. Photochem Photobiol. 1998;67:23–32. [PubMed] [Google Scholar]
- 8.Wang A.M. Bender J.E. Pfefer J. Utzinger U. Drezek R.A. Depth-sensitive reflectance measurements using obliquely oriented fiber probes. J Biomed Opt. 2005;10:44017. doi: 10.1117/1.1989335. [DOI] [PubMed] [Google Scholar]
- 9.Arifler D. MacAulay C. Follen M. Richards-Kortum R. Spatially resolved reflectance spectroscopy for diagnosis of cervical precancer: Monte Carlo modeling and comparison to clinical measurements. J Biomed Opt. 2006;11:064027. doi: 10.1117/1.2398932. [DOI] [PubMed] [Google Scholar]
- 10.Kostyuk O. Brown R.A. Novel spectroscopic technique for in situ monitoring of collagen fibril alignment in gels. Biophys J. 2004;87:648–655. doi: 10.1529/biophysj.103.038976. [DOI] [PMC free article] [PubMed] [Google Scholar]
- 11.Kostyuk O. Birch H.L. Mudera V. Brown R.A. Structural changes in loaded equine tendons can be monitored by a novel spectroscopic technique. J Physiol (Lond) 2004;554:791–801. doi: 10.1113/jphysiol.2004.054809. [DOI] [PMC free article] [PubMed] [Google Scholar]
- 12.Allen J., et al. Spectroscopic translation of cell-material interactions. Biomaterials. 2007;28:162–174. doi: 10.1016/j.biomaterials.2006.07.002. [DOI] [PubMed] [Google Scholar]
- 13.Gupta S., et al. Non-invasive optical characterization of biomaterial mineralization. Biomaterials. 2008;29:2359–2369. doi: 10.1016/j.biomaterials.2008.01.034. [DOI] [PMC free article] [PubMed] [Google Scholar]
- 14.Azrad E., et al. Probing the effect of an extract of elk velvet antler powder on mesenchymal stem cells using Raman microspectroscopy: enhanced differentiation toward osteogenic fate. J Raman Spectrosc. 2006;37:480–486. [Google Scholar]
- 15.Notingher I., et al. In situ spectral monitoring of mRNA translation in embryonic stem cells during differentiation in vitro. Anal Chem. 2004;76:3185–3193. doi: 10.1021/ac0498720. [DOI] [PubMed] [Google Scholar]
- 16.Ashjian P., et al. Noninvasive in situ evaluation of osteogenic differentiation by time-resolved laser-induced fluorescence spectroscopy. Tissue Eng. 2004;10:411–420. doi: 10.1089/107632704323061771. [DOI] [PMC free article] [PubMed] [Google Scholar]
- 17.Georgakoudi I., et al. Intrinsic fluorescence changes associated with the conformational state of silk fibroin in biomaterial matrices. Opt Express. 2007;15:1043–1053. doi: 10.1364/oe.15.001043. [DOI] [PubMed] [Google Scholar]
- 18.Georgakoudi I., et al. Fluorescence, reflectance, and light-scattering spectroscopy for evaluating dysplasia in patients with Barrett's esophagus. Gastroenterology. 2001;120:1620–1629. doi: 10.1053/gast.2001.24842. [DOI] [PubMed] [Google Scholar]
- 19.Georgakoudi I., et al. Trimodal spectroscopy for the detection and characterization of cervical precancers in vivo. Am J Obstet Gynecol. 2002;186:374–382. doi: 10.1067/mob.2002.121075. [DOI] [PubMed] [Google Scholar]
- 20.Drezek R.A., et al. Optical imaging of the cervix. Cancer. 2003;98:2015–2027. doi: 10.1002/cncr.11678. [DOI] [PubMed] [Google Scholar]
- 21.Inoué S. Handbook of Biological Confocal Microscopy. In: Pawley J.B., editor. New York: Springer; 2005. pp. 1–19. [Google Scholar]
- 22.Huzaira M. Rius F. Rajadhyaksha M. Anderson R.R. Gonzalez S. Topographic variations in normal skin, as viewed by in vivo reflectance confocal microscopy. J Invest Dermatol. 2001;116:846–852. doi: 10.1046/j.0022-202x.2001.01337.x. [DOI] [PubMed] [Google Scholar]
- 23.Landis F.A. Stephens J.S. Cooper J.A. Cicerone M.T. Lin-Gibson S. Tissue engineering scaffolds based on photocured dimethacrylate polymers for in vitro optical imaging. Biomacromolecules. 2006;7:1751–1757. doi: 10.1021/bm0600466. [DOI] [PubMed] [Google Scholar]
- 24.Xu C.Y. Inai R. Kotaki M. Ramakrishna S. Electrospun nanofiber fabrication as synthetic extracellular matrix and its potential for vascular tissue engineering. Tissue Eng. 2004;10:1160–1168. doi: 10.1089/ten.2004.10.1160. [DOI] [PubMed] [Google Scholar]
- 25.Dubruel P., et al. Porous gelatin hydrogels: 2. In vitro cell interaction study. Biomacromolecules. 2007;8:338–344. doi: 10.1021/bm0606869. [DOI] [PubMed] [Google Scholar]
- 26.Martina M., et al. Developing macroporous bicontinuous materials as scaffolds for tissue engineering. Biomaterials. 2005;26:5609–5616. doi: 10.1016/j.biomaterials.2005.02.011. [DOI] [PubMed] [Google Scholar]
- 27.Mahoney M.J. Anseth K.S. Three-dimensional growth and function of neural tissue in degradable polyethylene glycol hydrogels. Biomaterials. 2006;27:2265–2274. doi: 10.1016/j.biomaterials.2005.11.007. [DOI] [PubMed] [Google Scholar]
- 28.Chen F. Lee C.N. Teoh S.H. Nanofibrous modification on ultra-thin poly(epsilon-caprolactone) membrane via electrospinning. Mater Sci Eng C Biomimetic Supramol Syst. 2007;27:325–332. [Google Scholar]
- 29.Leong D.T. Khor W.M. Chew F.T. Lim T.C. Hutmacher D.W. Characterization of osteogenically induced adipose tissue-derived precursor cells in 2-dimensional and 3-dimensional environments. Cells Tissues Organs. 2006;182:1–11. doi: 10.1159/000091713. [DOI] [PubMed] [Google Scholar]
- 30.Zhao Y.S., et al. Construction of a unidirectionally beating 3-dimensional cardiac muscle construct. J Heart Lung Transplant. 2005;24:1091–1097. doi: 10.1016/j.healun.2004.07.010. [DOI] [PubMed] [Google Scholar]
- 31.Turner N.J. Kielty C.M. Walker M.G. Canfield A.E. A novel hyaluronan-based biomaterial (Hyaff-11((R))) as a scaffold for endothelial cells in tissue engineered vascular grafts. Biomaterials. 2004;25:5955–5964. doi: 10.1016/j.biomaterials.2004.02.002. [DOI] [PubMed] [Google Scholar]
- 32.Wang Y.Z. Kim U.J. Blasioli D.J. Kim H.J. Kaplan D.L. In vitro cartilage tissue engineering with 3D porous aqueous-derived silk scaffolds and mesenchymal stem cells. Biomaterials. 2005;26:7082–7094. doi: 10.1016/j.biomaterials.2005.05.022. [DOI] [PubMed] [Google Scholar]
- 33.Gomes M.E. Sikavitsas V.I. Behravesh E. Reis R.L. Mikos A.G. Effect of flow perfusion on the osteogenic differentiation of bone marrow stromal cells cultured on starch-based three-dimensional scaffolds. J Biomed Mater Res A. 2003;67A:87–95. doi: 10.1002/jbm.a.10075. [DOI] [PubMed] [Google Scholar]
- 34.Caspi O., et al. Tissue engineering of vascularized cardiac muscle from human embryonic stem cells. Circ Res. 2007;100:263–272. doi: 10.1161/01.RES.0000257776.05673.ff. [DOI] [PubMed] [Google Scholar]
- 35.Richardson S.M., et al. The differentiation of bone marrow mesenchymal stem cells into chondrocyte-like cells on poly-L-lactic acid (PLLA) scaffolds. Biomaterials. 2006;27:4069–4078. doi: 10.1016/j.biomaterials.2006.03.017. [DOI] [PubMed] [Google Scholar]
- 36.Fawzi-Grancher S. de Isla N. Faure G. Stoltz J.F. Muller S. Optimisation of biochemical condition and substrates in vitro for tissue engineering of ligament. Ann Biomed Eng. 2006;34:1767–1777. doi: 10.1007/s10439-006-9180-y. [DOI] [PMC free article] [PubMed] [Google Scholar]
- 37.Luong L.N. Hong S.I. Patel R.J. Outslay M.E. Kohn D.H. Spatial control of protein within biomimetically nucleated mineral. Biomaterials. 2006;27:1175–1186. doi: 10.1016/j.biomaterials.2005.07.043. [DOI] [PubMed] [Google Scholar]
- 38.Wenger A., et al. Modulation of in vitro angiogenesis in a three-dimensional spheroidal coculture model for bone tissue engineering. Tissue Eng. 2004;10:1536–1547. doi: 10.1089/ten.2004.10.1536. [DOI] [PubMed] [Google Scholar]
- 39.Tamariz E. Grinnell F. Modulation of fibroblast morphology and adhesion during collagen matrix remodeling. Mol Biol Cell. 2002;13:3915–3929. doi: 10.1091/mbc.E02-05-0291. [DOI] [PMC free article] [PubMed] [Google Scholar]
- 40.Tan W., et al. Structural and functional optical imaging of three-dimensional engineered tissue development. Tissue Eng. 2004;10:1747–1756. doi: 10.1089/ten.2004.10.1747. [DOI] [PubMed] [Google Scholar]
- 41.Kim A. Lakshman N. Petroll W.M. Quantitative assessment of local collagen matrix remodeling in 3-D culture: the role of Rho kinase. Exp Cell Res. 2006;312:3683–3692. doi: 10.1016/j.yexcr.2006.08.009. [DOI] [PMC free article] [PubMed] [Google Scholar]
- 42.Wu J., et al. Analysis of orientations of collagen fibers by novel fiber-tracking software. Microsc Microanal. 2003;9:574–580. doi: 10.1017/S1431927603030277. [DOI] [PubMed] [Google Scholar]
- 43.Peretti G.M., et al. Tissue engineered cartilage integration to live and devitalized cartilage: a study by reflectance mode confocal microscopy and standard histology. Connect Tissue Res. 2006;47:190–199. doi: 10.1080/03008200600809935. [DOI] [PubMed] [Google Scholar]
- 44.Smith I.O. Ren F. Baumann M.J. Case E.D. Confocal laser scanning microscopy as a tool for imaging cancellous bone. J Biomed Mater Res B Appl Biomater. 2006;79B:185–192. doi: 10.1002/jbm.b.30529. [DOI] [PubMed] [Google Scholar]
- 45.Fang N. Zhu A. Chan-Park M.B. Chan V. Adhesion contact dynamics of fibroblasts on biomacromolecular surfaces. Macromol Biosci. 2005;5:1022–1031. doi: 10.1002/mabi.200500123. [DOI] [PubMed] [Google Scholar]
- 46.Feng Q.L. Materials selection and scaffold construction for liver tissue engineering. PRICM 5: The Fifth Pacific Rim International Conference on Advanced Materials and Processing, Pts 1–5. 2005;475–479:2391–2394. [Google Scholar]
- 47.Tan W.J., et al. Adhesion contact dynamics of primary hepatocytes on poly(ethylene terephthalate) surface. Biomaterials. 2005;26:891–898. doi: 10.1016/j.biomaterials.2004.03.041. [DOI] [PubMed] [Google Scholar]
- 48.Petroll W.M. Differential interference contrast and confocal reflectance imaging of collagen organization in three-dimensional matrices. Scanning. 2006;28:305–310. doi: 10.1002/sca.4950280602. [DOI] [PubMed] [Google Scholar]
- 49.Gonzalez S. Gilaberte-Calzada Y. In vivo reflectance-mode confocal microscopy in clinical dermatology and cosmetology. Int J Cosmet Sci. 2008;30:1–17. doi: 10.1111/j.1468-2494.2008.00406.x. [DOI] [PubMed] [Google Scholar]
- 50.Denk W. Strickler J.H. Webb W.W. Two-photon laser scanning fluorescence microscopy. Science. 1990;248:73–76. doi: 10.1126/science.2321027. [DOI] [PubMed] [Google Scholar]
- 51.Larson D.R., et al. Water-soluble quantum dots for multiphoton fluorescence imaging in vivo. Science. 2003;300:1434–1436. doi: 10.1126/science.1083780. [DOI] [PubMed] [Google Scholar]
- 52.Squirrell J.M. Schramm R.D. Paprocki A.M. Wokosin D.L. Bavister B.D. Imaging mitochondrial organization in living primate oocytes and embryos using multiphoton microscopy. Microsc Microanal. 2003;9:190–201. doi: 10.1017/S1431927603030174. [DOI] [PMC free article] [PubMed] [Google Scholar]
- 53.Patterson G.H. Piston D.W. Photobleaching in two-photon excitation microscopy. Biophys J. 2000;78:2159–2162. doi: 10.1016/S0006-3495(00)76762-2. [DOI] [PMC free article] [PubMed] [Google Scholar]
- 54.Theer P. Hasan M.T. Denk W. Two-photon imaging to a depth of 1000 mm in living brains by use of a Ti:Al2O3 regenerative amplifier. Opt Lett. 2003;28:1022–1024. doi: 10.1364/ol.28.001022. [DOI] [PubMed] [Google Scholar]
- 55.Ping-Chin Cheng C.K.S. Handbook of Biological Confocal Microscopy. In: Pawley J.B., editor. New York: Springer; 2005. pp. 703–721. [Google Scholar]
- 56.Zoumi A. Yeh A. Tromberg B.J. Imaging cells and extracellular matrix in vivo by using second-harmonic generation and two-photon excited fluorescence. Proc Natl Acad Sci USA. 2002;99:11014–11019. doi: 10.1073/pnas.172368799. [DOI] [PMC free article] [PubMed] [Google Scholar]
- 57.Zoumi A. Lu X. Kassab G.S. Tromberg B.J. Imaging coronary artery microstructure using second-harmonic and two-photon fluorescence microscopy. Biophys J. 2004;87:2778–2786. doi: 10.1529/biophysj.104.042887. [DOI] [PMC free article] [PubMed] [Google Scholar]
- 58.Palero J.A.de Bruijn H.S.van den Heuvel A.V.Sterenborg H.J.C.M.,Gerritsen H.C.Spectrally resolved multiphoton imaging of in vivo and excised mouse skin tissues Biophys J 93992–1007.2007 [DOI] [PMC free article] [PubMed] [Google Scholar]
- 59.Konig K. Schenke-Layland K. Riemann I. Stock U.A. Multiphoton autofluorescence imaging of intratissue elastic fibers. Biomaterials. 2005;26:495–500. doi: 10.1016/j.biomaterials.2004.02.059. [DOI] [PubMed] [Google Scholar]
- 60.Opitz F., et al. Tissue engineering of aortic tissue: dire consequence of suboptimal elastic fiber synthesis in vivo. Cardiovasc Res. 2004;63:719–730. doi: 10.1016/j.cardiores.2004.05.002. [DOI] [PubMed] [Google Scholar]
- 61.Schenke-Layland K. Riemann I. Stock U.A. Konig K. Imaging of cardiovascular structures using near-infrared femtosecond multiphoton laser scanning microscopy. J Biomed Opt. 2005;10:024017. doi: 10.1117/1.1896966. [DOI] [PubMed] [Google Scholar]
- 62.Lee H.S., et al. Imaging human bone marrow stem cell morphogenesis in polyglycolic acid scaffold by multiphoton microscopy. Tissue Eng. 2006;12:2835–2841. doi: 10.1089/ten.2006.12.2835. [DOI] [PubMed] [Google Scholar]
- 63.Sun S. Titushkin I. Cho M. Regulation of mesenchymal stem cell adhesion and orientation in 3D collagen scaffold by electrical stimulus. Bioelectrochemistry. 2006;69:133–141. doi: 10.1016/j.bioelechem.2005.11.007. [DOI] [PubMed] [Google Scholar]
- 64.Rice W.L., et al. Non-invasive characterization of structure and morphology of silk fibroin biomaterials using non-linear microscopy. Biomaterials. 2008;29:2015–2024. doi: 10.1016/j.biomaterials.2007.12.049. [DOI] [PMC free article] [PubMed] [Google Scholar]
- 65.Rice W.L. Kaplan D.L. Georgakoudi I. Quantitative biomarkers of stem cell differentiation based on intrinsic two-photon excited fluorescence. J Biomed Opt. 2007;12:060504. doi: 10.1117/1.2823019. [DOI] [PubMed] [Google Scholar]
- 66.Dumas D., et al. Spectral and lifetime fluorescence imaging microscopies: new modalities of multiphoton microscopy applied to tissue or cell engineering. Biorheology. 2004;41:459–467. [PubMed] [Google Scholar]
- 67.Kierdaszuk B. Malak H. Gryczynski I. Callis P. Lakowicz J.R. Fluorescence of reduced nicotinamides using one- and two-photon excitation. Biophys Chem. 1996;62:1–13. doi: 10.1016/s0301-4622(96)02182-5. [DOI] [PubMed] [Google Scholar]
- 68.Skala M.C., et al. In vivo multiphoton fluorescence lifetime imaging of protein-bound and free nicotinamide adenine dinucleotide in normal and precancerous epithelia. J Biomed Opt. 2007;12:024014. doi: 10.1117/1.2717503. [DOI] [PMC free article] [PubMed] [Google Scholar]
- 69.Spoler F., et al. High-resolution optical coherence tomography as a non-destructive monitoring tool for the engineering of skin equivalents. Skin Res Technol. 2006;12:261–267. doi: 10.1111/j.0909-752X.2006.00163.x. [DOI] [PubMed] [Google Scholar]
- 70.de Boer J.F., et al. Improved signal-to-noise ratio in spectral-domain compared with time-domain optical coherence tomography. Opt Lett. 2003;28:2067–2069. doi: 10.1364/ol.28.002067. [DOI] [PubMed] [Google Scholar]
- 71.Pierce M.C. Strasswimmer J. Park B.H. Cense B. de Boer J.F. Advances in optical coherence tomography imaging for dermatology. J Invest Dermatol. 2004;123:458–463. doi: 10.1111/j.0022-202X.2004.23404.x. [DOI] [PubMed] [Google Scholar]
- 72.Lu C.W. Lee C.K. Tsai M.T. Wang Y.M. Yang C.C. Measurement of the hemoglobin oxygen saturation level with spectroscopic spectral-domain optical coherence tomography. Opt Lett. 2008;33:416–418. doi: 10.1364/ol.33.000416. [DOI] [PubMed] [Google Scholar]
- 73.Dennis T. Dyer S.D. Dienstfrey A. Phase-dispersion light scattering for quantitative size-imaging of spherical scatterers. Art. no. 644609. Proceedings of the Society of Photo-Optical Instrumentation Engineers (SPIE) 2007;6446:44609–44609. [Google Scholar]
- 74.Xu C.Y., et al. Spectroscopic spectral-domain optical coherence microscopy. Opt Lett. 2006;31:1079–1081. doi: 10.1364/ol.31.001079. [DOI] [PubMed] [Google Scholar]
- 75.Bagnaninchi P.O., et al. Chitosan micro-channel scaffolds for tendon tissue engineering characterized using optical coherence tomography. Tissue Eng. 2007;13:323–331. doi: 10.1089/ten.2006.0168. [DOI] [PubMed] [Google Scholar]
- 76.Yang Y., et al. Investigation of optical coherence tomography as an imaging modality in tissue engineering. Phys Med Biol. 2006;51:1649–1659. doi: 10.1088/0031-9155/51/7/001. [DOI] [PubMed] [Google Scholar]
- 77.Mason C. Markusen J.F. Town M.A. Dunnill P. Wang R.K. The potential of optical coherence tomography in the engineering of living tissue. Phys Med Biol. 2004;49:1097–1115. doi: 10.1088/0031-9155/49/7/002. [DOI] [PubMed] [Google Scholar]
- 78.Xu X.Q. Wang R.K.K. El Haj A. Investigation of changes in optical attenuation of bone and neuronal cells in organ culture or three-dimensional constructs in vitro with optical coherence tomography: relevance to cytochrome oxidase monitoring. Eur Biophys J Biophys Lett. 2003;32:355–362. doi: 10.1007/s00249-003-0285-z. [DOI] [PubMed] [Google Scholar]
- 79.Tan W. Oldenburg A.L. Norman J.J. Desai T.A. Boppart S.A. Optical coherence tomography of cell dynamics in three-dimensional tissue models. Opt Express. 2006;14:7159–7171. doi: 10.1364/oe.14.007159. [DOI] [PubMed] [Google Scholar]
- 80.Ko H.J. Tan W. Stack R. Boppart S.A. Optical coherence elastography of engineered and developing tissue. Tissue Eng. 2006;12:63–73. doi: 10.1089/ten.2006.12.63. [DOI] [PubMed] [Google Scholar]
- 81.Mason C. Markusen J.F. Town M.A. Dunnill P. Wang R.K. Doppler optical coherence tomography for measuring flow in engineered tissue. Biosens Bioelectron. 2004;20:414–423. doi: 10.1016/j.bios.2004.03.035. [DOI] [PubMed] [Google Scholar]
- 82.Yeh A.T., et al. Imaging wound healing using optical coherence tomography and multiphoton microscopy in an in vitro skin-equivalent tissue model. J Biomed Opt. 2004;9:248–253. doi: 10.1117/1.1648646. [DOI] [PubMed] [Google Scholar]
- 83.Muller M. Zumbusch A. Coherent anti-Stokes Raman scattering microscopy. Chemphyschem. 2007;8:2156–2170. doi: 10.1002/cphc.200700202. [DOI] [PubMed] [Google Scholar]
- 84.Huang S. Heikal A.A. Webb W.W. Two-photon fluorescence spectroscopy and microscopy of NAD(P)H and flavoprotein. Biophys J. 2002;82:2811–2825. doi: 10.1016/S0006-3495(02)75621-X. [DOI] [PMC free article] [PubMed] [Google Scholar]
- 85.Du M.Yeh H.-C.Berka V.Wang L.-H.Tsai A.-l.Redox properties of human endothelial nitric-oxide synthase oxygenase and reductase domains purified from yeast expression system J Biol Chem 2786002–6011.2003 [DOI] [PubMed] [Google Scholar]
- 86.Holzer W., et al. Photo-induced degradation of some flavins in aqueous solution. Chem Phys. 2005;308:69–78. [Google Scholar]
- 87.Zipfel W.R., et al. Live tissue intrinsic emission microscopy using multiphoton-excited native fluorescence and second harmonic generation. Proc Natl Acad Sci USA. 2003;100:7075–7080. doi: 10.1073/pnas.0832308100. [DOI] [PMC free article] [PubMed] [Google Scholar]
- 88.Chris Xu R.M.W.W.Z.W.W.W. Multiphoton excitation cross-sections of molecular fluorophores. Bioimaging. 1996;4:198–207. [Google Scholar]
- 89.Scott T.G. Spencer R.D. Leonard N.J. Weber G. Emission properties of Nadh. Studies of fluorescence lifetimes and quantum efficiencies of Nadh, Acpyadh, and simplified synthetic models. J Am Chem Soc. 1970;92:687. [Google Scholar]
- 90.Richards-Kortum R. Sevick-Muraca E. Quantitative optical spectroscopy for tissue diagnosis. Annu Rev Phys Chem. 1996;47:555–606. doi: 10.1146/annurev.physchem.47.1.555. [DOI] [PubMed] [Google Scholar]
- 91.Lakowicz J.R. Kierdaszuk B. Callis P. Malak H. Gryczynski I. Fluorescence anisotropy of tyrosine using one-and 2-photon excitation. Biophys Chem. 1995;56:263–271. doi: 10.1016/0301-4622(95)00040-5. [DOI] [PubMed] [Google Scholar]
- 92.Cogan U. Kopelman M. Mokady S. Shinitzky M. Binding affinities of retinol and related compounds to retinol binding proteins. Eur J Biochem. 1976;65:71–78. doi: 10.1111/j.1432-1033.1976.tb10390.x. [DOI] [PubMed] [Google Scholar]
- 93.Szuts E.Z. Harosi F.I. Solubility of retinoids in water. Arch Biochem Biophys. 1991;287:297–304. doi: 10.1016/0003-9861(91)90482-x. [DOI] [PubMed] [Google Scholar]
- 94.Navarro F.A., et al. Two-photon confocal microscopy: a nondestructive method for studying wound healing. Plast Reconstr Surg. 2004;114:121–128. doi: 10.1097/01.prs.0000128374.20913.4b. [DOI] [PubMed] [Google Scholar]
- 95.Schenke-Layland K. Riemann I. Damour O. Stock U.A. Konig K. Two-photon microscopes and in vivo multiphoton tomographs—powerful diagnostic tools for tissue engineering and drug delivery. Adv Drug Deliv Rev. 2006;58:878–896. doi: 10.1016/j.addr.2006.07.004. [DOI] [PubMed] [Google Scholar]
- 96.Campagnola P.J., et al. Three-dimensional high-resolution second-harmonic generation imaging of endogenous structural proteins in biological tissues. Biophys J. 2002;82:493–508. doi: 10.1016/S0006-3495(02)75414-3. [DOI] [PMC free article] [PubMed] [Google Scholar]
- 97.Nadiarnykh O. LaComb R. Campagnola P.J. Mohler W.A. Coherent and incoherent SHG in fibrillar cellulose matrices. Opt Express. 2007;15:3348–3360. doi: 10.1364/oe.15.003348. [DOI] [PubMed] [Google Scholar]